| Issue |
Knowl. Manag. Aquat. Ecosyst.
Number 427, 2026
Biological conservation, ecosystems restoration and ecological engineering
|
|
|---|---|---|
| Article Number | 10 | |
| Number of page(s) | 13 | |
| DOI | https://doi.org/10.1051/kmae/2025031 | |
| Published online | 25 February 2026 | |
Research Paper
Managing invasive alien crayfish in isolated water bodies: Evaluating control strategies for biodiversity conservation
1
Stichting Bargerveen, Toernooiveld 1, 6525 ED Nijmegen, Netherlands
2
Radboud Institute for Biological and Environmental Sciences, Radboud University, Department of Plant & Animal Biology, P.O. Box 9100, 6500 GL Nijmegen, The Netherlands
3
Netherlands Centre of Expertise for Exotic Species (NEC‐E), Nature plaza, P.O. Box 9010, 6500 GL Nijmegen, The Netherlands
4
Natuurbalans – Limes Divergens, Toernooiveld 1, 6525 ED Nijmegen, Netherlands
5
Netherlands Institute of Ecology, Animal Ecology, Wageningen, Netherlands
6
Karlstad University, Department of Environmental and Life Sciences, Biology, Karlstad, Sweden
* Corresponding author: This email address is being protected from spambots. You need JavaScript enabled to view it.
Received:
25
June
2025
Accepted:
6
December
2025
Abstract
Invasive alien crayfish pose significant threats to biodiversity in aquatic ecosystems. In isolated water bodies they impact local amphibian populations by predation, and altering water quality due to burrowing behaviour. Eight pools in either natural and urban areas were selected, where either signal crayfish, red swamp crayfish, or both species occurred. During six years, we assessed three methods to reduce crayfish abundances: biannual crayfish trapping and removal, trapping combined with drainage of pools, and trapping combined with introducing eels as predators. Trapping alone was insufficient to stagnate population growth of red swamp crayfish, though it slowed. Trapping + draining proved ineffective, since red swamp crayfish hid in burrows and aquatic vegetation. The trapping + eels method, reduced population growth and mean length of the red swamp crayfish. Furthermore, we observed a strong population decline in signal crayfish when the red swamp crayfish colonised a pool. Our findings demonstrate that crayfish negatively impact populations of several amphibian species. In natural pools, amphibian numbers increased when crayfish numbers decreased. Urban pools, which showed an increase in crayfish numbers, displayed a decline in amphibians. A combination of predator introduction and removal of crayfish could provide a sustainable solution for controlling crayfish populations and improving amphibian habitats.
Key words: Ecosystem‐based measures / eel stocking / invasive alien species management / Pacifastacus leniusculus / Procambarus clarkii
Publisher note: The “Supplementary material” has been added on 9 March 2026.
© L.S. van Veenhuisen et al., Published by EDP Sciences 2026
 This is an Open Access article distributed under the terms of the Creative Commons Attribution License CC-BY-ND (https://creativecommons.org/licenses/by-nd/4.0/), which permits unrestricted use, distribution, and reproduction in any medium, provided the original work is properly cited. If you remix, transform, or build upon the material, you may not distribute the modified material.
1 Introduction
A species that is introduced outside its natural range and becomes established is referred to as an alien species. It is considered as an invasive alien species (IAS) when adverse effects on biodiversity or socio‐economic impacts occur (Early et al., 2016). Aquatic ecosystems are particularly vulnerable to biological invasions—a threat amplified by human‐mediated connectivity (e.g., canals, shipping, reservoirs) and intensive use, which together form pathways that facilitate the introduction and spread of non‐native species (Hulme, 2009; Leuven et al., 2009; Havel et al., 2015).
In the European Union, approximately twelve invasive crayfish species have become established (Ion et al., 2024). This includes the signal crayfish (Pacifastacus leniusculus) and red swamp crayfish (Procambarus clarkii), which were introduced via the aquarium trade, consumption trade and intentional introductions by governments (Bohnman et al., 2006; Lemmers et al., 2021; Oficialdegui et al., 2025). Both species are listed as IAS of European Union concern (EU Invasive Alien Species Regulation 1143/2014). IAS of EU concern are subject to restrictions on possession, transportation, import, trade and breeding. Member states must minimise pathways of unintentional introduction, take actions for early detection and rapid eradication of these IAS, and control species that are widely spread. The red swamp crayfish is a generalist species that disperses through water and can cover distances over 1 km over land rapidly establishing populations in various habitats (Treguier et al., 2011). The species causes negative ecological effects by reducing macrophyte cover through both feeding and destruction (e.g., clipping), preying on native species, disrupting food webs, increasing water turbidity through burrowing, and transmitting diseases such as crayfish plague (Aphanomyces astaci), leading to biodiversity loss and ecosystem service disruption in European aquatic environments (Souty‐Grosset et al., 2016). The red swamp crayfish is highly invasive as a result of rapid maturation, high fecundity, and high plasticity (Huner, 1999; Gherardi, 2006). This species is widespread across at least fourteen European countries (Ion et al., 2024), and occurs in a wide range of environmental conditions represented in Europe (Souty‐Grosset et al., 2006; Cusell et al., 2020). The signal crayfish is established in at least twenty European countries (Ion et al., 2024). This species mainly occupies riverine ecosystems but it can also establish in pools or ponds (Souty‐Grosset et al., 2006). The signal crayfish can also reach high densities and cause substantial, comparable ecological impact (Nyström et al., 1996; Vaeßen et al., 2015). Both crayfish species reduce macrophytes by clipping and feeding (Nyström et al., 1996). This may lead to a strong reduction in amphibian hiding and oviposition sites (Axelsson et al., 1997). Newts utilise submersed macrophytes by folding eggs between the leaves (Töth et al., 2011). Frogs deposit their egg clumps just below the water surface, which sink to the bottom when there is a shortage of macrophytes, where they become an easy prey for the crayfish (Jooris et al., 2010). Both during the egg and larval phases, amphibians are vulnerable to crayfish predation (Cruz et al., 2005). Larvae of frogs and toads are diurnal and often rest at night on the bottom of the pool, which is when the nocturnal crayfish are foraging. Also, the amphibians in the Netherlands are ecologically naive to crayfish predation, because there have not been native crayfish species that filled that role before non‐native crayfish invaded the habitats, which makes these amphibians especially vulnerable to crayfish predation (Gomez‐Mestre et al., 2011).
Eliminating invasive crayfish from amphibian reproduction habitat can be challenging. It can only be achieved using biocides in populations with a small geographic range at sites with a low habitat complexity (Peay et al., 2019). Biocide treatments can be performed without eliminating amphibian populations (O'Brien et al., 2013). However in many instances crayfish elimination is not feasible due to interconnectedness of crayfish populations (recolonisation), structural complexity of the habitat and because use of biocides is not allowed. Alternatively, management strategies should be aimed at suppressing populations. Water systems with few predators and a high degree of unnatural aquatic habitats are assumed to have a large carrying capacity for invasive crayfish, which allows these IAS to form unnaturally large populations (Lemmers et al., 2018). In this context, the introduction of native predators, such as pike (Esox lucius), European perch (Perca fluviatilis), or eel (Anguilla anguilla), has been suggested as a potentially valuable strategy to control invasive crayfish. Predation experiments have shown that juvenile signal crayfish are vulnerable to predation by perch and eel (Blake et al., 1995), and pike have been observed to effectively prey on red swamp crayfish in Spanish streams (Elvira et al., 1996). These findings suggest that strengthening natural predation pressure could help reduce crayfish abundance, especially in shallow or structurally simple water bodies where ambush predators may be more effective.
Another potentially promising approach is the temporary draining of water bodies, which can directly reduce crayfish populations by removing suitable aquatic habitat and may also limit reproduction. This method has been successfully applied in Switzerland to suppress spinycheek crayfish (Faxonius limosus) populations, especially in isolated or small water bodies such as ponds and ditches (Krieg et al., 2020). However, its applicability in Dutch isolated waters, and its specific effects on both different crayfish species and on native amphibians, have so far received limited scientific attention.
Overall, while predator introduction and controlled drying are both promising measures, they have been under‐evaluated. There is still a lack of systematic studies assessing their effectiveness across crayfish species, water types, and their potential side effects on native fauna. This study aims to fill that gap by exploring the feasibility and ecological consequences of such interventions in various freshwater systems, with a specific focus on their potential to support amphibian conservation.
The present study evaluated three control strategies in isolated Dutch freshwater systems; (1) trapping only, (2) trapping combined with draining pools, and (3) trapping combined with introducing non‐reproducing crayfish predators. The goal was to improve the quality of amphibian breeding habitats, test control methods, and evaluate management strategies for crayfish invasions. We hypothesised that introducing a crayfish predator to the isolated amphibian pools would lead to fewer crayfish in the long run (Hein et al., 2007; Krieg et al., 2020), and could therefore lead to an increase in amphibian populations. Additionally, we expected that draining of crayfish‐infested pools was a suitable strategy for lowering invasive crayfish populations for two to three years. Combining these strategies with biannual crayfish trapping was expected to keep the invasive crayfish population low enough for amphibians to restore their populations.
2 Methods
2.1 Study area
The study was conducted in the municipality of Tilburg in the Netherlands (Fig. 1). The red swamp crayfish and signal crayfish both colonised isolated water bodies from the adjacent lowland stream ‘Oude Leij— (Crombaghs et al., 2017). The signal crayfish has a limited distribution, while the red swamp crayfish is widely distributed in the Netherlands.
Eight pools were selected for this study (Fig. 2 and SI1). The selected pools were all considered free of fish and fully isolated from the Oude Leij stream and did not overflow even during periods of high water. Therefore, there was no direct hydrological connection allowing crayfish to enter the pools during floods. However, it is likely that new crayfish still entered the pools from the stream, for example via active dispersal or overland movement. For this reason, eradication of crayfish was not considered a management goal in these pools. The study area was divided into two areas: a nature and urban area (Fig. 1). The nature area concerned the area ‘De Kaaistoep— where three of the pools (labelled with N in Fig. 1) were located (van Wielink et al., 2020). These natural pools are part of breeding grounds for the nine species of amphibians known to occur in the area. These include several EU‐protected amphibian species, such as common spadefoot toad (Pelobates fuscus), European tree frog (Hyla arborea), and crested newt (Triturus cristatus).
The five remaining pools are located in the urban part of the study area, named ‘De Dongevallei’— (labelled with U in Fig. 1) in the city of Tilburg. In this part, the stream runs through a city district. The pools in this area are overseen by the nearby houses and part of an open grassy landscape, which is partly a recreational area grazed by cattle.
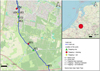 |
Fig. 1 Map of the study area (Tilburg, The Netherlands) and the isolated pools which were part of this research. The blue line passing through the area indicates the location of the lowland stream Oude Leij from which the crayfish species colonised the pools. The labelled symbols represent the locations of the pools, and the colour of the dots shows which method was used in which pool. |
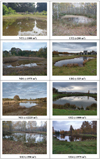 |
Fig. 2 Photograph of each pool, with corresponding pool label and average water surface (m2). Pool labels correspond with those in Figure 1. |
2.2 Tested management strategies and monitoring
In all pools, crayfish were trapped and removed twice a year: in spring (April/May) and autumn (August/September) from 2019 until 2024. The 2019 counts can be regarded as reference values as they were done before the treatments started. Crayfish were captured using halibut fish pellets baited crayfish traps (64 × 46 × 20 cm; mesh size 25 mm), approximately 1 metre from the bank over the course of seven days, with the traps being emptied and baited every 2–3 days. The number of traps used was roughly based on the surface and reachability of the banks of each pool (Fig. 2 and SI1). Only in pool NE1 were the traps in the pool for 14 days each monitoring round, with the traps also being emptied and baited every 2–3 days. This pool was monitored differently due to its larger size and being deeper than the other pools. In addition, part of this pool was inaccessible due to deep water and locally dense reed (Phragmites australis) vegetation. The captured crayfish were counted and measured (total length), and their sex was determined. We ensured that all individuals were fully extended during measurement by gently flattening the abdomen, thereby reducing variability due to posture. Crayfish were unfortunately not measured in 2019. All crayfish were euthanised by freezing, which is considered an appropriate method for euthanising crayfish (Scheers et al., 2023).
Capture (and removal) was thus the baseline monitoring and management strategy. The two trapping only sites (NT1 and UT2) only received this management, while the other six pools received additional measures to manage the crayfish. Two of these pools (ND1 and UD2) were drained directly after the first round of crayfish trapping in August 2019. The pools were drained for one workday (eight hours) using mechanical pumps. Crayfish that became visible on the bottom of the pool during the draining process were captured by hand or using nets. Due to high seepage pressure in UD2, a small layer of silt and water remained in the pool which could not be drained.
The final method, applied in four pools (NE1, UE2, UE3 and UE4), was the release of European eels (Anguilla anguilla) combined with trapping twice a year. Eels prey on both adult and juvenile crayfish and were therefore considered a promising predator for keeping populations of non‐native crayfish at a low level (Aquiloni et al., 2010). Moreover, eels are unable to reproduce in freshwater, so their introduction will result in only a temporary increase in the native predator population and is not expected to pose an uncontrollable threat to amphibians. Eels of wild origin were purchased from a commercial fishing company and were originally intended for consumption. In August 2019, a total of 364 eels were released (mean length TL 25 cm), and in August 2020, an additional 97 eels were released (mean length TL 38.5 cm; mean weight 117.2 g) (Tab. 1). The eels released in 2020 were PIT‐tagged to make them individually identifiable and to monitor the development of the length and weight of each animal. For this purpose, eels were first anaesthetised with benzocaine (approximately 80 mg/l). After full anaesthesia, a 23 mm tag was inserted into the abdominal cavity. The wound was then sealed with cyanoacrylate glue. This was approved by the Radboud University ethics committee and performed under the animal experimentation law Wod licence holder no. TRC/NVWA/2014/1558.
2.3 Amphibian and eel monitoring
Amphibians were annually monitored during two rounds from the spring of 2019 until 2024, and by three people. At least one person was present at each round during the six years to ensure the consistency of the methodology used. The first round was carried out at the end of April or beginning of May with torchlights, specifically for larvae of the early spawning species brown frog (Rana temporaria) and common toad (Bufo bufo). During this period, submersed vegetation is scarce, making inventorying of amphibian larvae with flashlights a suitable method (Kröpfli et al., 2010). Strong Nitecore P30 torchlights were used for this. While wading, each pool was visited, and all observed amphibians, including adults, were counted. The second monitoring round was performed at the end of June using 70 × 55 cm dipnets with a mesh size of 4 mm. At the end of June, aquatic plants are more developed, making amphibian larvae less visible at night with a torchlight. This round was intended for all other amphibian species that are present later. Pools were sampled by three people by scooping for amphibians at all accessible places. Each pool was sampled in full coverage where possible. Due to higher water depth, a full sample coverage could not be achieved in NE1 and UE2. Despite these methodological differences between pools, the interannual surveys of the same pool are comparable. Due to high water levels in the spring of 2023 and 2024, not all places that were sampled in 2019–2022 could be reached. This may have led to an underestimation of the actual numbers in those later years.
To determine the eel survival and growth, eels were surveyed three times: in the winter of 2020–2021, 2021–2022 and 2022–2023. Due to high water levels, it was not possible to survey eels in 2024. Monitoring was carried out by hand electrofishing (Bretschneider EFGI 650) along the banks while wading, targeting eels. A pragmatic search was conducted for the presence of eels, with greater attention being given to habitats preferred by eels, such as reed‐vegetated banks. Natural structures such as stone or wood were not present in the pools investigated. The weight and length of each eel caught were recorded. The captured eels were checked for the presence of a PIT tag using a wireless handheld scanner to monitor the growth in weight and length over time, and they were subsequently released.
2.4 Water quality measurements
Surface water samples were collected from all ponds in 2019, 2022 and 2024 during summer. Water samples were collected in iodated polyethylene bottles. The pH was measured within 24 h after collection with a standard combined glass Ag/AgCl pH electrode (Orion Research, Beverly, CA, USA) connected to a pH meter (Tim800; Radiometer analytical, Lyon, France). Concentrations of ammonium (NH4+), chloride (Cl−), nitrate (NO3−), orthophosphate(PO43−) and sodium (Na+) were measured using an auto‐analyser 3 system (Bran and Lubbe, Norderstedt, Germany), colourimetrically using hydrazine sulphate (Stumm and Morgan, 2013). Kalium and total phosphorus concentrations were determined using an inductively coupled plasma spectrometer (ICP‐OES icap 6000; Thermo Fischer Scientific, Waltham, MA, USA).
2.5 Statistical analyses
R version 4.4.2 was used for all statistical analyses (R Core Team, 2024). To analyse differences in the number of individuals of a specific crayfish species caught per sampling round between the different management treatments, negative‐binomial mixed‐effect models were applied using the package glmmTMB (Brooks et al., 2017). Pool label was included as a random factor to account for variation between individual pools. The fixed factors in the model were Year, Treatment, and Period (spring or autumn), with an interaction term between Year and Treatment to test whether the effectiveness of the treatments changed over time. This model structure was chosen because the count data showed overdispersion.
To analyse changes in crayfish total length over time, a generalised linear mixed‐effect model (GLMM) with a Gaussian distribution (assumptions for normality were met) was used per species, including Treatment, Year, and their interaction as fixed factors, and pool label as a random factor to account for repeated measurements within the same pools. This model allowed us to evaluate whether crayfish size differed between treatments and across years while accounting for pool‐level variation.
The models were tested for overdispersion and zero‐inflation using the DHARMa package (Hartig, 2016), which was also used for model validation. The DHARMa package provides a QQ plot of the model residuals, using a Kolmogorov‐Smirnov (KS) test to assess whether the model residuals deviate significantly from a normal distribution. The Akaike Information Criterion (AIC) was used to select the most parsimonious model based on the lowest AIC value.
Since a direct effect of crayfish on larvae of amphibians was expected, only larvae were included in the statistical analyses. The statistical analysis of the amphibian data focused on whether there is a relationship between the species‐specific number of larvae encountered and the number of signal crayfish, red swamp crayfish and the sum of both crayfish species. Spearman's rank correlation analyses were performed to assess the relationship between the larval abundance of various amphibian species and the two crayfish species (including the sum of both species) across the two pool types: natural and urban. Spearman's correlation was chosen due to its robustness against non‐normal distributions and its suitability for monotonic but potentially non‐linear relationships. The results are visualised in the correlation matrix and reveal the differences in correlation patterns. The following packages were used for analyses and visualisation: ggplot2 (Wickham, 2016), dplyr (Wickham et al., 2023), purrr (Henry et al., 2023), and tidyverse (Wickham et al., 2019).
Variations in water quality among the treatments and years were analysed using non‐metric multidimensional scaling (NMDS) based on Bray–Curtis dissimilarities of standardised values for chloride, sodium, pH, potassium, phosphate, nitrate, and ammonium. Significance was tested with PERMANOVA including treatment, year, and their interaction (treatment × year). Multivariate analyses were performed using the vegan package.
3 Results
3.1 Crayfish populations
Despite the three measures (i.e., trapping only, trapping + drainage, trapping + eel introduction) to reduce crayfish densities, the number of red swamp crayfish actually increased between 2019 and 2024 (Fig. 3). However, the signal crayfish population did collapse. The analysis showed significant increases in numbers of red swamp crayfish between 2019 and the years 2022, 2023, and 2024. Specifically, the increase from 2019 to 2022 (GLMM; z = 3.504, p < 0.001), from 2019 to 2023 (GLMM; z = 4.449, p < 0.001), and from 2019 to 2024 (GLMM; z = 5.357, p < 0.001) were significant. No significant changes were observed for 2020 (z = 1.778, p = 0.075) or 2021 (z = 1.536, p = 0.125). Crayfish counts were also significantly lower in spring compared to autumn (GLMM; z = −2.291, p = 0.022), reflecting seasonal differences in catchability. Interactions between period and year were not significant, indicating that the overall yearly decreases were consistent across both spring and autumn sampling. For signal crayfish, the statistical analysis showed a significant decrease in abundance between 2019 and all other years. Crayfish numbers were significantly lower than in 2019 in 2020 (GLMM; z = −2.526, p = 0.012), 2021 (z = −3.947, p < 0.001), 2022 (z = −3.920, p < 0.001), 2023 (z = −4.306, p < 0.001), and 2024 (z = −4.255, p < 0.001). No significant effects of sampling period (spring vs autumn) or interactions between period and year were found, indicating that the decreases occurred consistently across both periods.
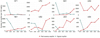 |
Fig. 3 Catch per unit effort (CPUE; total number of signal and red swamp crayfish captured per year per pool, standardised per 100 trap nights). Note: In 2019, only one round of sampling took place in autumn. Missing lines for a species indicate that the species was not detected in the corresponding pool during the study period. Crayfish captured during draining events not included in this figure. N = nature pool, U = urban pool, T = trapping only, E = trapping + eel treatment, D = trapping + draining treatment. Pool labels correspond with those in Figure 1. |
3.2 Crayfish and the effects of management methods
During the draining of pool ND1, a total of 65 signal crayfish were removed. In pool UD2, 243 red swamp crayfish were caught during drainage in 2019. These individuals were recorded but were not included in the statistical analysis of the catch data per treatments. In this pool (UD2), an unknown number of red swamp crayfish were hiding in burrows up to 1 meter deep during the draining process. A few individuals were dug out, but it was not feasible to locate and remove all of the crayfish from their burrows. As a result, some red swamp crayfish inevitably remained in their burrows. Other complicating factors of the draining method were that crayfish of both species were difficult to find in patches of vegetation. Furthermore, complete drainage of pool UD2 could not be achieved due to continuing inflow of seepage water, probably originating from the adjacent stream. Specimens also remained in the silt bottom of both pools and were therefore difficult to locate.
The negative‐binomial mixed‐effect model showed that the effect of the trapping + eel method on the number of red swamp crayfish caught was not significant as a main effect (GLMM; z = −1.366, p = 0.172). Similarly, the trapping + draining method showed no significant difference compared to trapping only (GLMM; z = 0.876, p = 0.381). However, significant interactions between the trapping + eel method and the years 2021, 2022, 2023, and 2024 were observed (GLMM; respectively z = 2.922, p = 0.0035 for 2021; z = 2.443, p = 0.0146 for 2022; z = 2.979, p = 0.0029 for 2023; and z = 3.542, p = 0.0004 for 2024). This indicates that the effectiveness of the trapping + eel method increased over time. In addition, the season (Period) had a significant effect, with fewer crayfish caught in spring compared to autumn (GLMM; z = −5.310, p < 0.001). Overall, these results suggest that the presence of eels can lead to a gradual reduction in crayfish numbers over multiple years, even though there is no immediate difference compared to trapping‐only or drainage treatments in any single year.
The results show a significant decrease in the abundance of signal crayfish between the years 2021 and 2022, regardless of the method used (GLMM; z = −1.851, p = 0.06410 for 2020 and z = −2.602, p = 0.00928 for 2021). This suggests an overall decline in signal crayfish populations over time. The season (Period) did not have a significant effect on signal crayfish abundance (GLMM; z = −0.097, p = 0.923).
Regarding the treatments, the trapping + eel method showed a significant interaction effect with the year 2022 (GLMM; z = −2.132, p = 0.03302), indicating a lower number of signal crayfish caught in eel‐treated ponds during that year. The main effects of the trapping + eel and trapping + draining methods were not significant (GLMM; respectively z = 1.158, p = 0.247 and z = −0.155, p = 0.877). The interaction effects for other years and treatments were also not significant, suggesting that the observed decline in signal crayfish abundance was only partially influenced by the presence of eels in 2022.
The type of method had a significant effect on the length of red swamp crayfish (Fig. 4). The trapping + draining method had a negative effect in the early year of 2021 (red swamp crayfish became smaller in total length, 2021; t = −2.206; p = 0.05), but later the size did not differ. In 2023, the effect of the trapping + draining method was positive (GLMM; t = 8.422; p < 0.0001), indicating a significantly greater length in that year compared to the trapping only method. This positive effect on the total length of crayfish continued in 2024 (GLMM; t = 6.617; p < 0.001), again showing a significant increase in length. The trapping + eel method also had a positive effect on the mean total length of the red swamp crayfish, particularly in later years. In 2020, there was no significant effect of the trapping + eel method on crayfish length, but in subsequent years, this effect was significant. In 2022, crayfish in the pools with the trapping + eel method were significantly greater in length than crayfish from the trapping only method (GLMM; t = 5.655, p < 0.001). Also in 2023 and 2024, the trapping + eel method resulted in significantly larger crayfish in both years (GLMM; t = 8.240, p <0.001 for 2023 and t = 9.543, p <0.001 for 2024).
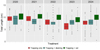 |
Fig. 4 The development of length over the years for the red swamp crayfish per treatment applied. Each box represents the interquartile range, which displays the middle 50% of the data. The bottom of the box is the first quartile (Q1), and the top of the box is the third quartile (Q3). The horizontal line within the box represents the median. As no length measurements were taken in 2019, the first available length data originates from the first sampling round following draining and eel release. |
3.3 Amphibians
During six years of monitoring, a total of 112,291 larvae of amphibians were counted, divided into seven species: Alpine newt, European tree frog, common frog, common toad, edible frog (Pelophylax kl. esculentus), crested newt and smooth newt (Lissotriton vulgaris). One adult common spadefoot toad was caught in a crayfish trap in 2020 during the spring crayfish monitoring in pool NE1.
The common toad is the most represented amphibian species in the dataset, with a total of 96,237 larvae counted. The next most abundant species were the common frog (n = 8,574), smooth newt (n = 5,940), edible frog (n = 1,261), European tree frog (n = 202), Northern crested newt (n = 66), and alpine newt (n = 11), respectively. A figure displaying the number of amphibians per species over the years per pool is included as Supplementary Information (SI2).
In the natural pools (i.e., those not in urban habitats), several significant temporal and spatial correlations were identified (Fig. 5). A negative correlation was observed between the European tree frog and the combined abundance of both crayfish species (ρ = –0.77, p < 0.001). Similarly, the common toad showed a significant negative correlation with the red swamp crayfish (ρ = –0.52, p = 0.028) and the signal crayfish (ρ = –0.52, p = 0.026). The edible frog exhibited contrasting associations: a strong positive correlation with the red swamp crayfish (ρ = 0.73, p < 0.001) and a significant negative correlation with the signal crayfish (ρ = –0.57, p = 0.014). Additionally, the crested newt was negatively associated with the combined crayfish abundance (ρ = –0.60, p = 0.008), and the smooth newt showed strong negative correlations with both the signal crayfish (ρ = –0.60, p = 0.008) and the combined crayfish abundance (ρ = –0.67, p = 0.003).
In urban pools, fewer significant correlations were demonstrated (Fig. 5). The alpine newt exhibited a positive correlation with the signal crayfish (ρ = 0.42, p = 0.023), whereas the common toad showed a negative correlation with the combined crayfish abundance (ρ = –0.42, p = 0.022). The edible frog displayed a positive correlation with the signal crayfish (ρ = 0.43, p = 0.018) and negative correlations with both the red swamp crayfish (ρ = –0.50, p = 0.0049) and the combined crayfish abundance (ρ = –0.55, p = 0.0018). No correlation values were available for the crested newt and European tree frog in urban pools since these species were not present here.
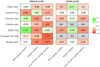 |
Fig. 5 The Spearman rank correlation coefficients between the numbers of seven encountered amphibian species and numbers of two crayfish species in pools in natural and urban areas. The correlation values range from −1 to 1, where negative values indicate an inverse relationship, positive values indicate a direct relationship, and values close to 0 suggest a minor to no correlation. Asterisks (*) next to the correlation values indicate statistically significant correlations with a p‐value less than 0.05. ‐“N/A” values represent cases where there was insufficient data to calculate the Spearman correlation. The data are visualised as a heatmap, with a colour gradient from red (negative correlations) to green (positive correlations), with white indicating no correlation. |
3.4 Eel
During the three monitoring periods (winter 2020, 2022, and 2023), a total of 62 eels was recaptured. Eight of these had a PIT tag.
Of the eight tagged eels that were recaptured, two were recaptured twice. All recaptured tagged eels increased in length and weight. Compared to initial length and weight from August 2020, the two animals that were recaptured during the survey in winter 2020 both increased 2 cm in length, the weight increased deviated (9 and 16 g increase). The two animals that were recaptured during the survey in winter 2022 increased 6 and 8 cm in length and increased 148 and 134 g in weight, respectively. In winter 2023, two animals were recaptured for the second time. Compared to the initial lenght and weight, the eels increased 9 and 10 cm, and 116 and 78 g, respectively. The two additional recaptured eels both increased 1 cm in length since August 2020, and 76 and 78 g, respectively.
3.5 Water quality
Water quality differed significantly between years and between treatments, while the temporal patterns were similar across treatments (PERMANOVA; treatment: pseudo‐F = 1.41, p = 0.005; year: pseudo‐F = 3.85, p = 0.005; treatment × year: pseudo‐F = 0.30, p = 0.99). The NMDS visualization confirms these patterns, showing that water quality varied between years and treatments but maintained similar interannual trajectories across all treatments (SI3 Fig. 2). Crayfish abundances were generally lower in eel‐treated pools than in the other treatments, which might suggest that the observed differences in water quality may be linked to the suppression of crayfish populations by the presence of eels. Additional results on water quality are presented in the Supplementary Information (SI3).
4 Discussion
One of the most remarkable results of this study is the collapse of the signal crayfish populations in most studied pools in three years. The disappearance of the signal crayfish was succeeded by an increase in the red swamp crayfish populations in these pools. It is unlikely that this rapid decline of the signal crayfish populations is caused entirely by the employed management methods. A plausible explanation is that the red swamp crayfish caused the signal crayfish to disappear from the study area. Competition for resources could have contributed to this, although it is known that the species can coexist (Nakata et al., 2005; Bernardo et al., 2011). Both species are also potential carriers of crayfish plague (Holdich et al., 2009). However, the signal crayfish may suffer significant mortality and behavioural shifts when the fungus is introduced in uninfected populations (Aydin et al., 2014; Thomas et al., 2020). The red swamp crayfish may have carried the crayfish plague, as this species colonised the studied pools years after the establishment of the signal crayfish, resulting in a decline of signal crayfish numbers. However, this observation also complicated the effectiveness assessments of the various control methods for this species.
The correlation analyses revealed species‐specific and location‐dependent relationships between native amphibian larvae and invasive crayfish in both natural and urban pools. In natural pools, several amphibian species exhibited moderate to strong negative associations with crayfish abundances. Notably, smooth newt, crested newt, and European tree frog showed significant negative correlations with the combined abundance of both crayfish species, suggesting a strong adverse effect on the native amphibians. Common toad and common frog showed negative relationships with the red swamp and signal crayfish, respectively. Interestingly, edible frog displayed contrasting patterns: a significant negative correlation with the signal crayfish, but a positive correlation with the red swamp crayfish. This pattern is particularly evident in natural pools, where red swamp crayfish densities have remained relatively low and smooth newt populations have significantly declined. As a result, it is not surprising that edible frogs started to increase in these pools, given that overall crayfish densities remained much lower after 2019.
The urban pools were subject to multiple stressors beyond invasive crayfish, including eutrophication (e.g., guanotrophication), Australian swamp stonecrop (Crassula helmsii) invasion, and grazing by geese. Amphibian larval densities were consistently low throughout the study in the urban pools, and water quality was poorer compared to natural pools (see SI3). Notably, phosphate concentrations increased markedly in pools UC1, UE2, and UE3 between 2022 and 2024, indicating ongoing nutrient enrichment despite dilution from more rainfall and higher water levels in those years. Amphibian‐crayfish correlations in urban pools were weaker and more heterogeneous than in the natural pools. Alpine newt and edible frog showed significant positive correlations with the signal crayfish. However, this was likely due to the low (and decreasing) numbers of signal crayfish from the start of the study. It is likely that if the abundance of signal crayfish was high during the course of this study, these positive correlations would not exist. Only a few amphibians exhibited a significant negative association with the total crayfish abundance in urban pools. This concerned the common toad and edible frog. Absence or rarity of certain species (e.g., European tree frog, crested newt) in urban pools limited statistical inference and further underlined the poor connectivity or suitability of these habitats for these amphibians. These results could suggest that while invasive crayfish may exert strong negative pressures on amphibians in more intact natural ecosystems, their impact in urban areas may be concealed by the prior collapse of amphibian populations due to unfavourable habitat conditions.
In the present study, amphibians generally showed higher abundances in the natural pools. The urban pools, where amphibian populations have collapsed or species have only been observed sporadically, are probably no longer suitable breeding waters. These pools may also suffer more from the indirect negative effects of the burrowing crayfish because nutrient concentrations are higher in these pools (SI3), and the additional increase in nutrients leads to more turbid water with reduced plant growth as a result (Angeler et al., 2001).
The European tree frog and the crested newt were observed the least. The occurrence of both species was only recorded in two natural pools. The European tree frog is a rare and endangered species in the Netherlands for which a pioneer situation with developed vegetation in breeding water is required (Schenk et al., 2018). In addition, the species prefers an environment that is grazed extensively and where shrub‐forming species such as brambles are present as a resting place (Glesener et al., 2024). In pool NT1, an increase in the number of European tree frogs was recorded in 2023, and in that year, the lowest number of crayfish was found in the same pool. The crested newt, another rare and endangered species in the Netherlands, is found in small meadow and forest pools (Vergoossen et al., 2009). The crested newt was rarely encountered during the study. In 2023, an increase in numbers was observed in pool NT1 and in 2022, the presence of the crested newt was recorded for the first time in pool ND1. A previous study showed that multiple crested newts species actively avoid wetlands for breeding when they are invaded by red swamp crayfish (Ficetola et al., 2011). Axelsson et al. (1997) showed that an increase in habitat complexity resulted in a decrease in predation by crayfish on European tree frogs. A combination of a suitable habitat and a decrease in the crayfish abundance in these pools likely had a positive effect on the European tree frog and crested newt populations.
The mean total length of red swamp crayfish decreased significantly after 2020. Trapping is known to capture mainly larger individuals (Green et al., 2018). This could have led to a constant depletion of larger animals, which ultimately resulted in a lower mean length. Our study shows that different control methods had different effects on the populations of the red swamp and signal crayfish. The method of only trapping was not sufficient to stagnate the population growth of the red swamp crayfish in the pools. The populations of red swamp crayfish increased rapidly between the start (2019) and the end of this study (2024). A previous study in the peat area of Molenpolder (Utrecht) demonstrated that intensive crayfishing can lead to a sufficiently low number that recovery of the ecosystem occurred (Bleile et al., 2024). The trapping intensity used in our study was found to be too low to significantly reduce the red swamp crayfish populations in the pools, but it is likely to have slowed down the growth of the populations. However, this could not be confirmed since there were no pools included in this study where biannual crayfish trapping was not applied.
Draining + trapping proved to be an ineffective method for controlling the red swamp crayfish, mainly because of the >1 m deep burrows, persistent aquatic vegetation and supply of seepage water from the adjacent lowland stream. In pool UD2 a large number of red swamp crayfish were hiding in burrows during the draining process. This was confirmed when adult red swamp crayfish were caught in these pools shortly after draining. It can be concluded that draining is not suitable for eliminating crayfish from pools (Hein et al., 2007). Although the draining method had a significant negative effect on the length of the red swamp crayfish in the first years, this effect was no longer present in subsequent years. A possible explanation is that larger animals were probably more visible than smaller specimens and were therefore more likely to be caught. As a result, smaller crayfish were more likely to survive in the drained pools, which was noticeable in the lower mean total length of the animals caught in the subsequent years. After 2022, this effect was no longer apparent. In 2023, the crayfish in the drained pools were significantly larger than those in the trapping only pools, mainly due to an overall decrease in crayfish length in the trapping only pools. The cause of this phenomenon remains unclear.
Of the three methods tested, the release of eels combined with trapping appeared to have the strongest impact on the populations of the red swamp crayfish. There is an increase in the number of red swamp crayfish caught over the years, but this increase is significantly smaller than the increase in the pools where only crayfish were caught. The release of the eel, therefore, appears to have an inhibiting effect on the population growth of the red swamp crayfish. This is supported by the recaptures of eels that were marked with a PIT tag; the individuals were long and heavy, suggesting that they did well in the pools. In 2022, the trapping + eel treatment was associated with a significantly higher average crayfish length compared to the capture method, indicating that the eels mainly eat the smaller crayfish, leaving the larger individuals behind. This signifies that the eels can effectively contribute to limiting the increase of crayfish populations through predation, especially in combination with intense trapping, which will remove the remaining large crayfish. A previous study also showed that eels can be used to suppress crayfish populations, resulting in the recovery of aquatic vegetation (Musseau et al., 2015). In this study, on average approximately 4000 eels per hectare were present in the pool. This is a much higher number than the average released during our study, being 433 eels per hectare. Stocking eels was done to evaluate a self‐sustaining form of crayfish control, in which crayfish populations remain at low levels without the need for continuous manual removal. When trapping is stopped, crayfish populations generally recover quickly to high densities (Kvistad et al., 2023), whereas in the presence of eels such a rebound may prevent a compensatory response. This potential for persistent suppression is an advantage of the method and the predator cannot reproduce, which means it cannot proliferate in the amphibian waters. It should be noted, however, that eels cannot complete their full life cycle there, as they are unable to migrate. Nevertheless, because eels are long‐lived animals, they can continue to exert predation pressure on crayfish for many years. The effect of eels on crayfish populations may even increase over time as the eels increase in size and predation capacity. It is important to note, however, that in this study we could only assessed the number of crayfish actually caught in the traps. Previous research has shown that crayfish activity (especially of small crayfish) can decrease in the presence of predatory fish, which may also explain part of the observed reduction in trap catches (Keller et al., 2000). Continued monitoring of both eel and crayfish populations would be valuable to assess the long‐term dynamics and effectiveness of this management approach.
In conclusion, none of the three tested methods proved fully effective in halting the population growth of red swamp crayfish in Dutch pools. However, each intervention showed measurable effects: Trapping + draining and trapping only reduced the size of individual crayfish, while trapping + eel introduction decreased the number of juveniles and, at higher densities, may suppress populations effectively (as shown by Hein, 2007; Musseau et al., 2015). The optimal trapping period depends on the recruitment timing of the crayfish species. Female red swamp crayfish in the Netherlands are berried in autumn and winter. In early spring, the juveniles are released from their mothers, after which they are large enough to be caught with traps from the end of the following summer. Summer and autumn are the optimal period to catch this species as a control measure (Koese et al., 2025). This was also confirmed in our study since significantly more red swamp crayfish were caught in autumn compared to spring. The majority of signal crayfish are berried in late spring. The optimal time for control measures is from the early spring. Based on these results, we recommend an integrated and intensified management strategy that combines these methods, complemented with a continuous monitoring of amphibian populations to evaluate the effectiveness and detect potential negative impacts of eel introduction on non‐target species.
Supplementary material
Supplementary file provided by the authors. Access Supplementary Material
Acknowledgements
This research was made possible through a grant from the Biodiversity and Habitats subsidy program of the Province of North Brabant (Grant C2224871/4370535), with additional financial support from the Brabantse Delta Water Board and the Municipality of Tilburg. We are grateful to these organisations for their support. We thank Jaap van Kemenade of TWM Gronden B.V. for his kind cooperation and for granting permission to conduct research at the Kaaistoep site. We also acknowledge Jeroen van Oosterhout, Frans Kolsters, and Wim de Jong of Brabants Landschap for their assistance in the field and for providing access permits for research on their nature reserves. Rob van Dijk of the Municipality of Tilburg is thanked for granting access to municipal properties. This study could not have been carried out without the collaboration and field support of the following colleagues and students; Thomas Amorij, Mila de Bruijn, Ben Crombaghs, Niels Eimers, Sandra de Goeij, Dirk Heijkers, Paula van der Heide, Kylian Janssen, Gert Hoogerwerf, Paul van Hoof, Noortje Hilger, Mirjam van der Kruijt, Roos van der Kroon, Johan Meijer, Luc Pastoors, Towi van der Putten, Jacqueline Selles, Job Steyntjes, Lennart Vonk, Joris Verhees, Quint Jace Wiegerinck, Jeroen Willems and Jelle Wissink.
References
- Angeler DG, Sánchez‐Carillo S, García G, Alvarez‐Cobelas M. 2001. The influence of Procambarus clarkii (Cambaridae, Decapoda) on water quality and sediment characteristics in a Spanish floodplain wetland. Hydrobiologia 464: 89–98. [Google Scholar]
- Aquiloni L, Brusconi S, Cecchinelli E, Tricarico E, Mazza G, Paglianti A, Gherardi F. 2010. Biological control of invasive populations of crayfish: the European eel (Anguilla anguilla) as a predator of Procambarus clarkii. Biol Invasions 12: 3817–3824. [Google Scholar]
- Axelsson E, Nyström P, Sidenmark J, Brönmark C. 1997. Crayfish predation on amphibian eggs and larvae. Amphibia‐Reptilia 18: 217–228. [Google Scholar]
- Aydin H, Kokko H, Makkonen J, Kortet R, Kukkonen H, Jussila J. 2014. The signal crayfish is vulnerable to both the As and the PsI‐isolates of the crayfish plague. Knowl Manag Aquat Ecosyst 413: 03. [Google Scholar]
- Bernardo JM, Costa AM, Bruxelas S, Teixeira A. 2011. Dispersal and coexistence of two non‐native crayfish species (Pacifastacus leniusculus and Procambarus clarkii) in NE Portugal over a 10‐year period. Knowl Manag Aquat Ecosyst 401: 28. [Google Scholar]
- Blake MA, Hart PJB. 1995. The vulnerability of juvenile signal crayfish to perch and eel predation. Freshw Biol 33: 233–244. [Google Scholar]
- Bleile N, Kampen J, Janssen Y. 2024. Ecosysteemherstel Molenpolder 2021–2024. Eindrapport. ATKB, Waardenburg (in Dutch). [Google Scholar]
- Bohman P, Nordwall F, Edsman L. 2006. The effect of the large‐scale introduction of signal crayfish on the spread of crayfish plague in Sweden. Bull Fr Pêche Piscic 380–381: 1291–1302. [Google Scholar]
- Brooks ME, Kristensen K, Benthem KJ, Magnusson A, Berg CW, Nielsen A, Skaug HJ, Mächler M, Bolker BM. 2017. glmmTMB balances speed and flexibility among packages for zero‐inflated generalized linear mixed modeling. R J 9: 378–400. [CrossRef] [Google Scholar]
- Crombaghs BHJM, Lemmers P, Kemenade J, Felix R, Kolsters F, de Jong W, Roover S. 2017. ‘Kat en muis‐spel— met Californische kreeft: bestrijding van een zeer bedreigende invasieve soort. Vakbl Natuur Bos Landschap 142: 18–21. (in Dutch) [Google Scholar]
- Cruz MJ, Rebelo R. 2005. Vulnerability of Southwest Iberian amphibians to an introduced crayfish, Procambarus clarkii. Amphibia‐Reptilia 26: 293–303. [Google Scholar]
- Cusell C, Brederveld B, Doef L, Jans M, Lammers D, Tangerman M, Weerman E, Moth L, Kampen J, van de Haterd R, Koese B, Nieuwhof S, Kooijman A, van de Craats A. 2020. Rode Amerikaanse rivierkreeften in Nederland: relaties met milieu- en omgevingsfactoren. Stichting Toegepast Onderzoek Waterbeheer, Amersfoort. (in Dutch) [Google Scholar]
- Elvira B, Gnicola G, Almodovar A. 1996. Pike and red swamp crayfish: a new case on predator–prey relationship between aliens in central Spain. J Fish Biol 48: 437–446. [Google Scholar]
- Early R, Bradley BA, Dukes JS, Lawler JJ, Olden JD, Blumenthal DM, Gonzalez P, Grosholz ED, Ibañez I, Miller LP, Sorte CJB, Tatem AJ. 2016. Global threats from invasive alien species in the twenty‐first century and national response capacities. Nat Commun 7: 12485. [Google Scholar]
- Early R, Bradley BA, Dukes JS, Lawler JJ, Olden JD, Blumenthal DM, Gonzalez P, Grosholz ED, Ibañez I, Miller LP, Sorte CJB, Tatem AJ. 2016. Global threats from invasive alien species in the twenty‐first century and national response capacities. Nat Commun 7: 12485. [Google Scholar]
- Ficetola GF, Siesa ME, Manenti R, Bottoni L, De Bernardi F, Padoa-Schioppa E. 2011. Early assessment of the impact of alien species: differential consequences of an invasive crayfish on adult and larval amphibians. Divers Distrib 17: 1141–1151 [Google Scholar]
- Gherardi F. 2006. Crayfish invading Europe: the case study of Procambarus clarkii. Mar Freshw Behav Physiol 39: 175–191. [Google Scholar]
- Glesener L, Gräser P, Schneider S. 2024. Successful development of European tree frog (Hyla arborea Linnaeus, 1758) populations in the south‐west and west of Luxembourg following reintroduction. Bull Soc Nat Luxemb 126: 87. [Google Scholar]
- Gomez‐Mestre I, Díaz‐Paniagua C. 2011. Invasive predatory crayfish do not trigger inducible defences in tadpoles. Proc R Soc B 278(1723): 3364–3370. [Google Scholar]
- Green N, Bentley M, Stebbing P, Andreou D, Britton R. 2018. Trapping for invasive crayfish: comparisons of efficacy and selectivity of baited traps versus novel artificial refuge traps. Knowl Manag Aquat Ecosyst 419: 15. [CrossRef] [EDP Sciences] [Google Scholar]
- Hartig F. 2016. DHARMa: residual diagnostics for hierarchical (multi‐level/mixed) regression models. R package. [Google Scholar]
- Havel JE, Kovalenko KE, Thomaz SM, Amalfitano S, Kats LB. 2015. Aquatic invasive species: challenges for the future. Hydrobiologia 750: 147–170. [CrossRef] [Google Scholar]
- Hein CL, Zanden MJ, Magnuson JJ. 2007. Intensive trapping and increased fish predation cause massive population decline of an invasive crayfish. Freshw Biol 52: 1134–1146. [Google Scholar]
- Henry L, Wickham H. 2023. purrr: Functional programming tools. R package version. [Google Scholar]
- Holdich DM, Reynolds JD, Souty‐Grosset C, Sibley PJ. 2009. A review of the ever increasing threat to European crayfish from non‐indigenous crayfish species. Knowl Manag Aquat Ecosyst 394–395: 11. [Google Scholar]
- Hulme PE. 2009. Trade, transport and trouble: managing invasive species pathways in an era of globalization. J Appl Ecol 46: 10–18. [CrossRef] [Google Scholar]
- Huner JV. 1999. Ossi v. Lindqvist. In: Gherardi F, Holdich DM (eds), Crayfish in Europe as Alien Species: How to Make the Best of a Bad Situation, pp. 23–30. A.A. Balkema. [Google Scholar]
- Ion MC, Bloomer CC, Bărăscu TI, Oficialdegui FJ, Shoobs NF, Williams BW, et al. 2024. World of Crayfish™: A web platform towards real‐time global mapping of freshwater crayfish and their pathogens. PeerJ 12: e18229. [CrossRef] [PubMed] [Google Scholar]
- Jooris R, Holsbeek G. 2010. Groene kikkers in Vlaanderen en het Brusselse Hoofdstedelijk Gewest. Mechelen: Natuur studie. [Google Scholar]
- Keller TA, Moore PA. 2000. Contextspecific behavior: crayfish size influences crayfish–fish interactions. J N Am Benthol Soc 19: 344–351. [Google Scholar]
- Koese B, Wissink J, Janssen Y. 2025. De levenscyclus van de rode en geknobbelde Amerikaanse rivierkreeft in Nederland: implicaties voor beheer. Leiden (in Dutch): EIS Kenniscentrum Insecten. [Google Scholar]
- Krieg R, King A, Zenker A. 2020. Measures to control invasive crayfish species in Switzerland: A success story? Front Environ Sci 8: 609129. [Google Scholar]
- Kröpfli M, Heer P, Pellet J. 2010. Costeffectiveness of two monitoring strategies for the great crested newt (Triturus cristatus). AmphibReptil 31: 403–410. [Google Scholar]
- Kvistad JT, Galarowicz TL, Clapp DF, Chadderton WL, Tucker AJ, Annis G, Herbert M. 2023. Evidence of a compensatory response in invasive rusty crayfish (Faxonius rusticus) following intensive harvest removal from northern Lake Michigan fish spawning reefs. Biol Invasions 25: 2831–2847. [Google Scholar]
- Lemmers P, Crombaghs BHJM, Leuven RSEW. 2018. Invasieve exotische kreeften in het beheergebied van waterschap Rivierenland: Verkenning van effecten, risico's en mogelijke aanpak. Nijmegen /Leiden (in Dutch): Natuurbalans – Limes Divergens BV, Radboud Universiteit & Nederlands Expertise Centrum Exoten. [Google Scholar]
- Lemmers P, Collas FRL, Gylstra R, Crombaghs BHJM, Velde G, Leuven RSEW. 2021. Risks and management of alien freshwater crayfish species in the Rhine–Meuse river district. Manage Biol Invasions 12: 193–220. [Google Scholar]
- Leuven RSEW, Velde G, Baijens I, Snijders J, Zwart C, Lenders HJR, Bij de Vaate A. 2009. The river Rhine: A global highway for dispersal of aquatic invasive species. Biol Invasions 11: 1989–2008. [Google Scholar]
- Musseau C, Boulenger C, Crivelli AJ, Lebel I, Pascal M, Boulêtreau S, Santoul F. 2015. Native European eels as a potential biological control for invasive crayfish. Freshw Biol 60: 636–645. [Google Scholar]
- Nakata K, Tsutsumi K, Kawai T, Goshima S. 2005. Coexistence of two North American invasive crayfish species, Pacifastacus leniusculus (Dana, 1852) and Procambarus clarkii (Girard, 1852) in Japan. Crustaceana 78: 1389–1394. [Google Scholar]
- Nyström P, Strand JA. 1996. Grazing by a native and exotic crayfish on aquatic macrophytes. Freshw Biol 36: 637–682. [Google Scholar]
- O'Brien CD, Hall JE, O'Brien CT, Baum D, Ballantyne L. 2013. Impact of a natural pyrethrin biocide on two amphibians, common toad Bufo bufo and palmate newt Lissotriton helveticus, in Highland, UK. Conserv Evid 10: 70. [Google Scholar]
- Oficialdegui FJ, Bláha M, Prati S, Lipták B, Weiperth A, Bányai ZM, Maciaszek R, Patoka J, Scheers K, Lemmers P, Petutschnig J, Petrtýl M, Petrusek A, Kouba A. 2025. Contrasting patterns of genetic variability in pet‐traded red swamp crayfish Procambarus clarkii and its feral populations. Freshw Biol 70: e70008. [Google Scholar]
- Peay S, Johnsen SI, Bean CW, Dunn AM, Sandodden R, Edsman L. 2019. Biocide treatment of invasive signal crayfish: successes, failures and lessons learned. Divers 11: 29. [Google Scholar]
- Scheers K, Steen F, Abeel T. 2023. Advies over het behandelen van invasieve rivierkreeften en hun aquaria. Brussel (in Dutch): Instituut voor Natuur‐ en Bosonderzoek. [Google Scholar]
- Schenk F, Vantorre R. 2018. Boomkikkers terug van bijna weggeweest in de Zwinstreek. Lev Natuur 119: 175–177. (in Dutch) [Google Scholar]
- Souty‐Grosset C, Anastácio PM, Aquiloni L, Banha F, Choquer J, Chucholl C, Tricarico E. 2016. The red swamp crayfish Procambarus clarkii in Europe: impacts on aquatic ecosystems and human well‐being. Limnologica 58: 78–93. [CrossRef] [Google Scholar]
- Souty‐Grosset C, Holdich D, Noël PY, Reynolds JD, Haffner P. 2006. Atlas of crayfish in Europe. Paris: Museum National d'Histoire Naturelle. [Google Scholar]
- Stumm W, Morgan JJ. 2013. Aquatic chemistry: chemical equilibria and rates in natural waters. John Wiley & Sons. [Google Scholar]
- Thomas JR, Robinson CV, Mrugała A, Ellison AR, Matthews E, Griffiths SW, Consuegra S, Cable J. 2020. Crayfish plague affects juvenile survival and adult behaviour of invasive signal crayfish. Parasitology 147: 706–714. [Google Scholar]
- Tóth Z, Hoi H, Hettyey A. 2011. Intraspecific variation in the egg‐wrapping behaviour of female smooth newts, Lissotriton vulgaris. Amphibia‐Reptilia 32: 77–82. [Google Scholar]
- Tréguier A, Roussel JM, Schlaepfer MA, Paillisson JM. 2011. Landscape features correlate with spatial distribution of red‐swamp crayfish Procambarus clarkii in a network of ponds. Knowl Manag Aquat Ecosyst 401: 19. [Google Scholar]
- Vaeßen S, Hollert H. 2015. Impacts of the North American signal crayfish (Pacifastacus leniusculus) on European ecosystems. Environ Sci Eur 27: 1–6. [Google Scholar]
- van Wielink P, Felix R, Kemenade J, Mol A, Peeters T, Stooker G. 2020. De Kaaistoep, het best onderzochte stuk natuur in Nederland. Zeist (in Dutch): KNNV. [Google Scholar]
- Vergoossen WG, Buggenum HJM. 2009. Boomkikker – Hyla arborea. In: Buggenum HJM, Geraeds RPG, Lenders AJWL, eds. Herpetofauna van Limburg: Verspreiding en Ecologie van Amfibieën en Reptielen in de Periode 1980–2008, 180–191. Stichting Natuurpublicaties Limburg. (in Dutch). [Google Scholar]
- Wickham H. 2016. ggplot2: Elegant graphics for data analysis. Springer‐Verlag. [Google Scholar]
- Wickham H, Averick M, Bryan J, Chang W, McGowan LDA, François R, Grolemund G, Hayes A, Henry L, Hester J, Kuhn M, Pedersen TL, Miller E, Bache SM, Müller K, Ooms J, Robinson D, Seidel DP, Spinu V, Takahaski K, Vaughan D, Wilke C, Woo K, Yutani H. 2019. Welcome to the tidyverse. J Open Source Softw 4: 1686. [CrossRef] [Google Scholar]
- Wickham H, François R, Henry L, Müller K. 2023. dplyr: A grammar of data manipulation (Version 1.1.4) [R package]. https://CRAN.R‐project.org/package=dplyr [Google Scholar]
Cite this article as: van Veenhuisen LS, Lemmers P, Jongejans E, van Kleef HH. 2026. Managing invasive alien crayfish in isolated water bodies: Evaluating control strategies for biodiversity conservation. Knowl. Manag. Aquat. Ecosyst. 427, 10 https://doi.org/10.1051/kmae/2025031.
All Tables
All Figures
|
Fig. 1 Map of the study area (Tilburg, The Netherlands) and the isolated pools which were part of this research. The blue line passing through the area indicates the location of the lowland stream Oude Leij from which the crayfish species colonised the pools. The labelled symbols represent the locations of the pools, and the colour of the dots shows which method was used in which pool. |
| In the text | |
|
Fig. 2 Photograph of each pool, with corresponding pool label and average water surface (m2). Pool labels correspond with those in Figure 1. |
| In the text | |
|
Fig. 3 Catch per unit effort (CPUE; total number of signal and red swamp crayfish captured per year per pool, standardised per 100 trap nights). Note: In 2019, only one round of sampling took place in autumn. Missing lines for a species indicate that the species was not detected in the corresponding pool during the study period. Crayfish captured during draining events not included in this figure. N = nature pool, U = urban pool, T = trapping only, E = trapping + eel treatment, D = trapping + draining treatment. Pool labels correspond with those in Figure 1. |
| In the text | |
|
Fig. 4 The development of length over the years for the red swamp crayfish per treatment applied. Each box represents the interquartile range, which displays the middle 50% of the data. The bottom of the box is the first quartile (Q1), and the top of the box is the third quartile (Q3). The horizontal line within the box represents the median. As no length measurements were taken in 2019, the first available length data originates from the first sampling round following draining and eel release. |
| In the text | |
|
Fig. 5 The Spearman rank correlation coefficients between the numbers of seven encountered amphibian species and numbers of two crayfish species in pools in natural and urban areas. The correlation values range from −1 to 1, where negative values indicate an inverse relationship, positive values indicate a direct relationship, and values close to 0 suggest a minor to no correlation. Asterisks (*) next to the correlation values indicate statistically significant correlations with a p‐value less than 0.05. ‐“N/A” values represent cases where there was insufficient data to calculate the Spearman correlation. The data are visualised as a heatmap, with a colour gradient from red (negative correlations) to green (positive correlations), with white indicating no correlation. |
| In the text | |
Current usage metrics show cumulative count of Article Views (full-text article views including HTML views, PDF and ePub downloads, according to the available data) and Abstracts Views on Vision4Press platform.
Data correspond to usage on the plateform after 2015. The current usage metrics is available 48-96 hours after online publication and is updated daily on week days.
Initial download of the metrics may take a while.