Fig. 5
Download original image
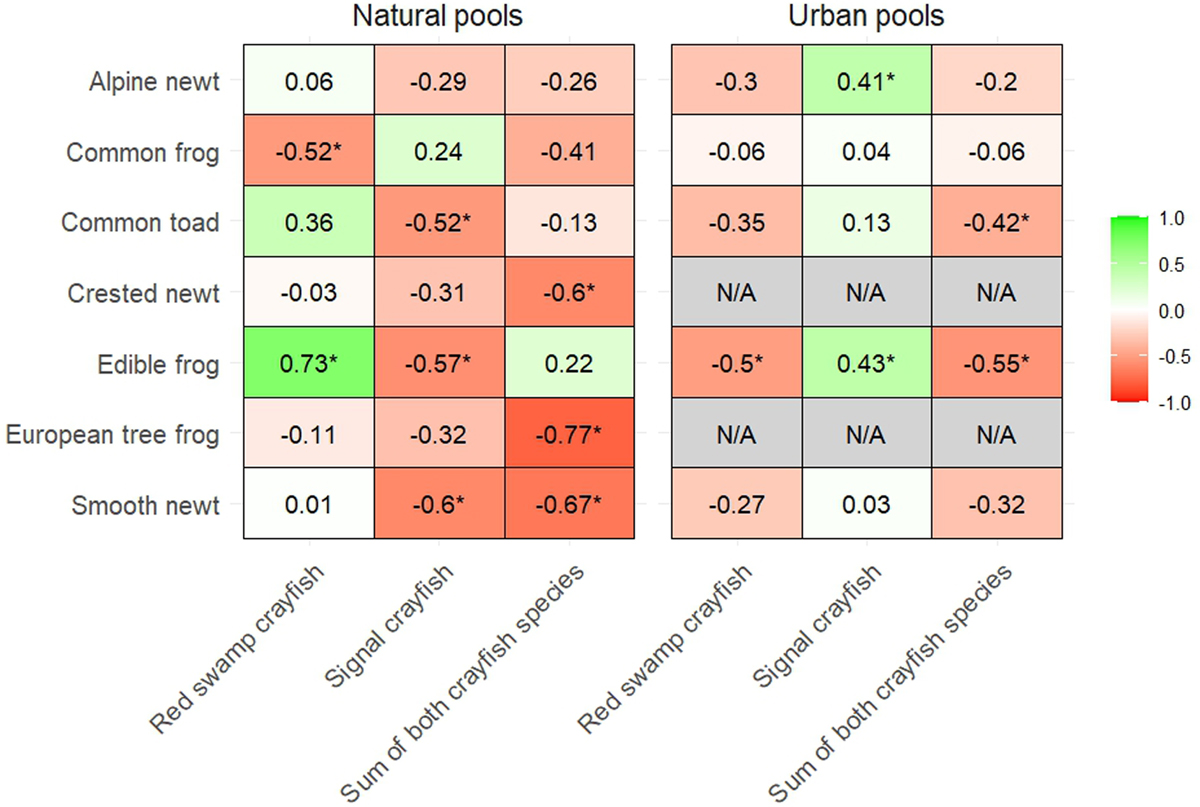
The Spearman rank correlation coefficients between the numbers of seven encountered amphibian species and numbers of two crayfish species in pools in natural and urban areas. The correlation values range from −1 to 1, where negative values indicate an inverse relationship, positive values indicate a direct relationship, and values close to 0 suggest a minor to no correlation. Asterisks (*) next to the correlation values indicate statistically significant correlations with a p‐value less than 0.05. ‐“N/A” values represent cases where there was insufficient data to calculate the Spearman correlation. The data are visualised as a heatmap, with a colour gradient from red (negative correlations) to green (positive correlations), with white indicating no correlation.
Current usage metrics show cumulative count of Article Views (full-text article views including HTML views, PDF and ePub downloads, according to the available data) and Abstracts Views on Vision4Press platform.
Data correspond to usage on the plateform after 2015. The current usage metrics is available 48-96 hours after online publication and is updated daily on week days.
Initial download of the metrics may take a while.