Fig. 1
Download original image
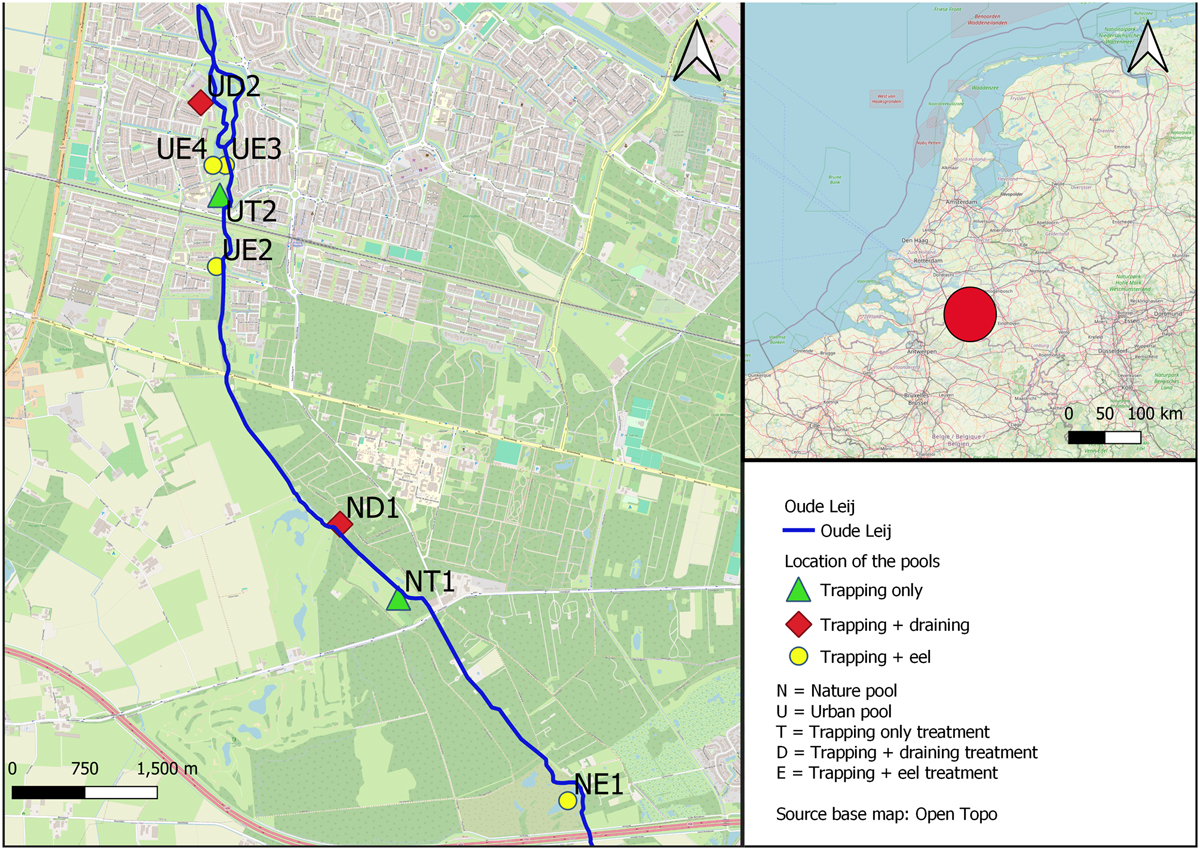
Map of the study area (Tilburg, The Netherlands) and the isolated pools which were part of this research. The blue line passing through the area indicates the location of the lowland stream Oude Leij from which the crayfish species colonised the pools. The labelled symbols represent the locations of the pools, and the colour of the dots shows which method was used in which pool.
Current usage metrics show cumulative count of Article Views (full-text article views including HTML views, PDF and ePub downloads, according to the available data) and Abstracts Views on Vision4Press platform.
Data correspond to usage on the plateform after 2015. The current usage metrics is available 48-96 hours after online publication and is updated daily on week days.
Initial download of the metrics may take a while.