| Issue |
Knowl. Manag. Aquat. Ecosyst.
Number 427, 2026
Conservation genetics
|
|
|---|---|---|
| Article Number | 9 | |
| Number of page(s) | 7 | |
| DOI | https://doi.org/10.1051/kmae/2026004 | |
| Published online | 20 February 2026 | |
Short Communication
Environmental DNA (eDNA) sampling strategies influence estimates of lake fish eDNA concentrations
1
Université Savoie Mont Blanc, INRAE, CARRTEL, OLA 74200 Thonon-les-Bains, France
2
Pole R&D ECLA, France
3
Service EcoAqua, DRAS, OFB, Aix-en-Provence, France
4
Aix Marseille Univ., INRAE, RECOVER, 13 182 Aix-en-Provence, France
5
INRAE, UR-Riverly, Centre de Lyon-Villeurbanne, Villeurbanne Cedex, France
* Corresponding author: This email address is being protected from spambots. You need JavaScript enabled to view it.
Received:
19
November
2025
Accepted:
21
January
2026
Abstract
Environmental DNA (eDNA) is increasingly used to estimate species abundance and biomass, but impacts of sampling strategies are poorly understood. We compared point and spatially integrated sampling, two commonly used sampling strategies, in two lakes using quantitative eDNA analysis. Integrated sampling increases the spatial coverage and the total volume of water sampled relative to point sampling. However, integrated sampling led to lower fish eDNA recovery and underestimated eDNA concentrations compared to point sampling. Although the exact mechanisms underlying this pattern require further investigation, these results underscore the importance of aligning sampling strategies with key study objectives.
Key words: Sampling volume / filtration capsule / eDNA quantification / digital PCR / DNA recovery
Shared first author.
© M. Vautier et al., Published by EDP Sciences, 2026
 This is an Open Access article distributed under the terms of the Creative Commons Attribution License CC-BY-ND (https://creativecommons.org/licenses/by-nd/4.0/), which permits unrestricted use, distribution, and reproduction in any medium, provided the original work is properly cited. If you remix, transform, or build upon the material, you may not distribute the modified material.
Quantifying environmental DNA (eDNA) concentrations is increasingly used as a proxy for species abundance and/or biomass although a number of biotic (e.g., eDNA production rates, metabolism, reproduction, etc.) and abiotic factors (water flow and temperature, eDNA capturing and extraction strategies, etc.) can influence eDNA concentration estimates (Rourke et al., 2021). Individual steps in eDNA sampling protocols can affect eDNA recovery and detection probabilities (Spens et al., 2016; Hinlo et al., 2017) and may even influence the relationship between estimated eDNA concentrations and species abundance/biomass (Eichmiller et al., 2016; Lacoursière-Roussel et al., 2016). Within the current literature, several alternative sampling strategies (i.e., a specific combination eDNA sampling, preservation and extraction protocols) have been proposed but surprisingly few comparative studies have assessed their influence on eDNA recovery and estimates of eDNA concentrations.
In lake ecosystems, two distinct sampling strategies are commonly used for eDNA surveys. Firstly, the collection of spatially separated point samples (i.e., point sampling (PS) strategy) are commonly used in quantitative eDNA surveys and often entails filtering small water volumes (ca. 1–2 L) using low capacity filter capsules (e.g., Takahara et al., 2012; Lacoursière-Roussel et al., 2015; Yates et al., 2023). An alternative strategy consists of collecting spatially and/or temporally integrated samples (i.e., integrated sampling (IS) strategy) which generally uses high capacity filters to filter larger water volumes (ca. 30–45 L). The IS strategy was initially developed for qualitative community surveys (Civade et al., 2016; Hervé et al., 2022) but is increasingly used for quantitative eDNA surveys (Pont et al., 2018; Hervé et al., 2023; Condachou et al., 2024). Comparisons between the two above-mentioned sampling strategies are limited and existing studies have focused solely on the differences in sampling volumes but neglected spatial differences (Peixoto et al., 2021, 2023). Earlier results did show that higher water volumes, from high-capacity filters, collected more total DNA but yielded lower species-specific detection probabilities and eDNA concentrations compared to smaller water volumes collected with low capacity filters (Peixoto et al., 2021, 2023). Consequently, an IS strategies may enhance total DNA recovery but may have reduce taxon-specific eDNA concentration estimates.
The lack of comparative studies between the PS and IS strategies hinders the ability to make informed decisions when designing eDNA sampling campaigns. Here we aim to address this knowledge gap for lentic systems by implementing both strategies in two natural lakes and evaluated the effectiveness of both strategies in terms of eDNA recovery and estimates of eDNA concentrations for five fish species.
Two natural lakes within France were sampled (see Fig. 1). Lake Bourget is a large (ca. 4,397 ha.), deep (ca. 145 m) and oligotrophic lake (Jenny et al., 2024) while Lake Paladru is smaller (ca. 355 ha.), shallower (maximum depth is ca. 36 m), and classified as mesotrophic (STE, 2024). Integrated and point sampling strategies (i.e., IS and PS respectively) were employed in each lake (Fig. 1). Large water volumes (i.e., mean = 24 L, range = 8.5 – 40 L) were collected along continuous littoral transects (i.e., maximum 10 m from the lake shore if navigation is possible) for the IS strategy (Civade et al., 2016; Hervé et al., 2022). Six transects were sampled for Lake Bourget while two transects sufficed to cover the circumference of Lake Paladru (Fig. 1). Material for eDNA sampling was single-use or cleaned using an acid-based wash (Lancer Ultima Series Laboratory Washer) with a hydrogen peroxide treatment to avoid contamination (Vautier and Galiegue, 2024). A two-day sampling campaign (i.e., 4th and 5th of September 2023) was needed for Lake Bourget while sampling Lake Paladru was done in a single day (i.e., 28th of September 2023). Integrated samples were collected by boat at a speed of ca. 5.5 km h−1 while continuously collecting and filtering sub-surface water using a diaphragm pump (Argaly, Sainte-Hélène-du-Lac, France) and high capacity 0.45 μm Waterra capsules (Waterra, Mississauga, ON, Canada) for ca. 30 min. An additional deep-water sample was collected from the deeper northern basin of Lake Bourget by pooling seven 5 L samples collected 5–10 m above the bottom substrate using a Niskin bottle (Fig. 1). Samples were pooled and 29 L of water was filtered using a Waterra capsule. Excess water was removed before adding 40 mL (or 30 mL for one sample) of Longmire buffer for eDNA preservation and samples were stored at −80 °C upon return to the laboratory. Three smaller samples (i.e., 2 L) were collected at the start, middle and end of each littoral transect for the PS strategy as well as three replicate samples for the deep-water sampling point (Fig. 1). Clean 2 L sampling bottles were used and samples were stored cooled before filtering subsamples (i.e., mean = 1.7 L, range = 1.0 – 2.0 L) the same day using 0.45 μm Sterivex filters (Merck KGaA, Darmstadt, Germany) and a vacuum pump at the laboratory (Thonon-les-Bains) (Vautier, 2024). Excess water was removed before adding 2 mL of Longmire buffer and storing samples at −80 °C. A negative field control (NFC) was included per sampling day and consisted of a 2 L bottle with MilliQ water which was opened and closed on site and filtered alongside the point samples.
 |
Fig. 1 Geographic location of the two lakes and a visual representation of the environmental DNA sampling strategies for Lake Bourget (A) and Paladru (B). Sampling consisted of spatially integrated sub-surface samples collected using high capacity Waterra filters (green lines: 6 transects for Lake Bourget, 2 transects for Lake Paladru), a deep-water sample collected using a Waterra filter in Lake Bourget (green square), and sub-surface point samples collected using Sterivex filters (black dots: 3 samples per transect and deep-water sample). |
DNA was extracted from the filters using the NucleoMag DNA/RNA Water Kit (Macherey-Nagel, Düren, Germany) and the MagnetaPure 32 Nucleic Acid Purification System (Dutscher, Bernolsheim, France), with minor modifications to the manufacturer’s protocol. The total volume of the preservation buffer recovered (from 1.7 mL to 2 mL) (Sterivex) or a 25 mL subsample (Waterra) were incubated overnight at 4 °C with 0.8 volumes of 100% isopropanol, 0.2 volumes of 5 M NaCl, and glycogen (≥4.4 μg mL−1 final concentration). A 10 min centrifugation at 6500 g at room temperature was used to pellet the DNA and the supernatant was removed (Edmunds and Burrows, 2020). DNA pellets were resuspended in 550 μL of buffer MWA1 and subsequent extractions followed the protocol of Vautier et al. (2024). DNA was eluted in 120 μL of nuclease-free water, quantified using a NanoDropTM One/Onec spectrophotometer (Thermo Fisher Scientific, Waltham, MA, USA), and stored at −20 °C until further analysis. To control for potential contamination, six extraction blanks (i.e., unutilised Longmire Buffer) were processed alongside eDNA samples.
Fish and species-specific eDNA concentrations were determined using digital droplet PCR (ddPCR) (Bio-Rad QX600 system, Bio-Rad, Hercules, CA, USA). Species targeted have historically been recorded in both lakes and included common roach (Rutilus rutilus Linnaeus, 1758), European catfish (Silurus glanis Linnaeus, 1758), perch (Perca fluviatilis Linnaeus, 1758), pike (Esox lucius Linnaeus, 1758), and whitefish (Coregonus lavaretus Linnaeus, 1758) (Jenny et al., 2024; STE, 2024). Species-specific assays for perch were available (Vautier et al., 2023) while for other species assays were designed and validated using a similar workflow (see Supporting Information 1 (SI-1) and Tab. 1). The cytochrome c oxidase subunit I (COI) gene was targeted with ddPCR reactions containing 1x Bio-Rad ddPCR Supermix for probes (no dUTP) (Bio-Rad), 900 nM of each primer (Eurofins Genomics, Ebersberg, Germany), 250 nM of the internal probe (Eurofins Genomics), 5U AflII restriction enzyme (New England Biolabs, Ipswich, MA, USA), 3 μL template DNA, and nuclease-free water (Eurobio Scientific, Courtaboeuf, France) for a total volume of 22 μL. Duplex ddPCR reactions were performed simultaneously targeting two species with probes containing different fluorescent dyes (i.e., FAM and HEX). Droplets were generated using 20 μL of the PCR reaction mix with the BioRad QX200 Droplet generator (Bio-Rad). Amplification was achieved on a T100 Thermal Cycler (Bio-Rad) using an initial denaturation of 10 min. at 95 °C; 40 cycles of 30 sec. at 94 °C and 60 sec. at 60 °C and 10 min. at 98 °C. Quantification of the total fish eDNA concentrations was done using the generalist MiFish-U primers (Miya et al., 2015) using a similar protocol but using 1x Bio-Rad ddPCR EvaGreen Supermix (Bio-Rad) and adapted thermal cycling conditions (i.e., 5 min. at 95 °C; 40 cycles of 30 sec. at 95 °C and 30 sec. at 65 °C; 5 min. at 4 °C followed by 5 min. at 95 °C). Data analyses were performed using QX Manager software (Bio-Rad), with thresholds determined based on positive (DNA extracts from tissue samples) and negative (no-template extraction and ddPCR) controls and manufacturer’s instructions (Tab. 1). Environmental DNA concentrations were calculated while correcting for proportional volumes of preservation buffers used for DNA extractions.
Details of the primers and probes used to quantify eDNA of the five target fish species.
Statistical analyses and data visualisations were performed using R v4.2.3 (R Development Core Team, 2023) with the packages tidyverse (Wickham et al., 2019), glmmTMB (Brooks et al., 2017) and emmeans (Lenth, 2024). Linear and generalized linear mixed-effect models (i.e., LMM and GLMM respectively) were used for statistical analyses. Additive models including the fixed and random effect terms of interest were first used before assessing if interaction terms and zero-inflation models, when relevant, improved model fit based on conditional Akaike Information Criterium (AICc) values (Akaike, 1974, 1978). Parameter significance (α = 0.05) was evaluated using ANOVA analyses (i.e., type III when interactions were present) and relevant pairwise comparisons through estimated marginal means and Tukey p-value adjustments.
The effects of sampling strategies (i.e., PS vs. IS) on DNA recovery were assessed using the total DNA concentrations in the DNA extracts (ng μl−1), total fish DNA concentrations in the DNA extracts (copies μl−1) and fish DNA copies standardized by total DNA (copies μg−1 of total DNA extracted) as well as the fish DNA copies standardized by the volume of water filtered (copies l−1). For species-specific eDNA quantification only the latter measures (copies l−1) were used to assess the impact of sampling strategies on eDNA concentration estimates. Total DNA concentrations (ng μl−1) were transformed (i.e., Box-Cox transformation) to achieve normality and analysed using a LMM while fish DNA concentrations (copies μl−1, copies μg−1 and copies l−1) were analysed using a GLMM with a Negative-Binomial distribution. Most parsimonious models for total DNA and total fish DNA recovered included the full two-way interactions between sampling strategy and lake as fixed effects and transects nested within lakes as random effects. Effects of sampling strategies on species-specific eDNA quantifications were assessed excluding the results from Lake Paladru (i.e., low sample size) with the most parsimonious model including sampling strategy and species name as fixed effects, sampling transects as a random effect and a full additive zero-inflation model.
One NFC tested positive for total fish DNA (i.e., 1 copy ul−1 of DNA extract), but this sample was negative for all target species. The low DNA concentration observed is likely attributable to off-target amplification of the MiFish-U primers which was confirmed through subsequent metabarcoding analyses (data not shown). The IS strategy yielded significantly higher total DNA concentrations in Lake Bourget compared to all other lake-by-sampling strategies (Fig. 2A). In contrast, in Lake Paladru the IS strategy significantly reduced the total fish DNA obtained compared to all other combinations (Fig. 2B). When standardizing fish DNA copy numbers by total DNA and the water volume filtered, consistently lower fish DNA recovery was observed for the IS relative to the PS strategy with significant differences in 3 out of 4 combinations (Figs. 2C and 2D).
 |
Fig. 2 Effects of sampling strategies (i.e., point sampling (PS) or integrated sampling (IS)) for each lake on total environmental DNA (eDNA) concentrations in the DNA extracts (A), fish eDNA concentrations in the DNA extracts (B), fish eDNA copies standardized by total DNA extracted (C) or litre of filtered water (D), and eDNA concentrations per litre of filtered water for the five-target species in Lake Bourget (E). In panel E, solid points show the mean model estimates with the 50 % (thick lines) and 95 % (thin lines) confidence intervals. |
Species-specific absolute eDNA quantifications were significantly affected by sampling strategy and species (SI-1). Parameter effects of the zero-inflation models also revealed significant effects of sampling strategy and species on the probability of zero detections (SI-1). Species-specific patterns were consistent with those observed for total fish DNA concentrations, with PS strategies yielding significantly higher eDNA concentrations, but simultaneously also increasing the probability for zero detections (i.e., violin plots are generally wider around zero copies l−1 for PS strategies) (Fig. 2E). On average, the PS strategy resulted in species-specific eDNA concentrations that were 1.95 times higher compared to the IS strategy (range: 1.03 – 2.75). While rank abundances based on eDNA concentrations were largely similar between the two strategies, the dominant taxa differed between strategies, with perch eDNA concentrations being highest in the PS strategy, whereas whitefish eDNA concentrations were higher in the IS strategy (Fig. 3).
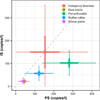 |
Fig. 3 Absolute environmental DNA concentrations for the five target species in Lake Bourget observed with the point sampling (PS, n = 21) (x-axis) and integrated sampling (IS, n = 7) (y-axis) strategies. The grey dashed line showed the ideal 1 to 1 correlation. |
By implementing two alternative eDNA sampling strategies and performing absolute quantification of total fish eDNA and species-specific eDNA concentrations, we assessed the performance of each sampling strategy. We found that an IS strategy increased total DNA recovery but reduced fish eDNA recovery and estimates of fish eDNA concentrations compared to a PS strategy. The prevalence of zero detections was, however, higher for a PS strategy. These finding are partly congruent with previous results, which reported that larger water volumes filtered using high capacity filters reduces DNA recovery and decreases detection probabilities (Peixoto et al., 2021). Spectrophotometric analyses to estimate total DNA concentrations are known to be influenced by various interfering compounds (e.g., presence of RNA’s) so the obtained values will need to be interpreted with caution (Li et al., 2014). As such in the discussion that follows we primarily focus on the results of the ddPCR analyses.
Multiple, not mutually exclusive, explanations may be put forward and will need further investigation to understand the mechanisms at play. Firstly, the spatial coverage of the PS strategy may be insufficient and more point samples may be needed to accurately estimate eDNA concentrations (Yates et al., 2023). Indeed, we found that the variance associated with eDNA concentrations estimated from the PS strategy was higher compared to integrated sampling strategies (Fig. 3). However, increasing sampling effort would not change the observation that total fish eDNA recovery, when standardized, is lower for the integrated sampling strategy. Secondly, filter clogging could reduce eDNA retention. The key factor differing in our study, and which could influence clogging rates, are differences in water volumes filtered. However, when considering the ratio between the mean water volume filtered and filter area (i.e., 10 vs. 600 cm2 for Sterivex and Waterra filters respectively) higher values for Sterivex (0.17) compared to Waterra (0.04) filters suggests that clogging effects would be more pronounced for the PS strategy. Higher DNA degradation rates for the IS relative to the PS strategy may also explain the observations. However, the on-site filtration and preservation used during the IS strategy should result in better eDNA preservation and thus higher eDNA recovery. Point samples were transported before filtration and preservation (ca. 4 h between collection and filtration/preservation) thus allowing for more eDNA degradation. Sampling strategy differences may also simply be due to the different materials used in the filtering capsules. Polyvinylidene fluoride (PVDF) and polyethersulfone (PES) are used in the Sterivex and Waterra filters respectively. DNA recovery has been found to be higher for PVDF filters, although effects may depend on the DNA extraction method used (Djurhuus et al., 2017; Min and Kim, 2024). Furthermore, magnetic bead-based DNA extractions have been shown to have a relative lower extraction efficiency compared to precipitation-based methods and DNA extraction efficiency may also vary depending on the state of eDNA collected (Kirtane et al., 2023; Kirtane and Deiner, 2024). Less effective fish DNA extraction from the Waterra filters could thus explain the results although the total eDNA concentrations observed in the integrated samples (i.e., maximum 124 ng/μL) suggest that a saturation, and subsequent lower DNA recovery, of the beads is unlikely. Filtering larger volumes may increase PCR inhibition thus affecting the ability to accurately quantify eDNA concentrations. However, magnetic bead-based DNA extraction have been reported to effectively remove inhibitors (Kirtane and Deiner, 2024) and inhibitors should not strongly influence DNA quantification through ddPCR (Doi et al., 2015; Capo et al., 2021).
Sampling strategies also affected rank abundances based on eDNA concentrations. The dominance of perch eDNA in the PS strategy is congruent with standard catch per unit effort (CPUE) estimates, while a dominance of whitefish eDNA in the IS strategy is consistent with hydro-acoustic observations, which suggest a dominance of whitefish in Lake Bourget in terms of biomass (Jenny et al., 2024). It is worth noting that whitefish eDNA concentration estimates from both strategies do not vary as much as for other species. Of the species targeted, whitefish have a more pelagic lifestyle and occupy deeper waters while others are more strongly associated with littoral habitats. Differences between rank abundances may thus be related to the fact that PS may capture a more local signal (i.e., higher perch abundance in the littoral zone) while the IS strategy may capture a more integrated signal (i.e., higher whitefish abundance in the lake).
Overall, we can conclude that the collection and filtering of spatially integrated large water volumes, possibly in combination with the DNA extraction methods used here, reduces fish eDNA recovery compared to a PS strategy in freshwater lakes. It remains to be seen if the same holds through for riverine ecosystems and further investigations with appropriate study designs are needed to further disentangle the exact mechanisms leading to these observations. Nonetheless our results show that a careful consideration of the implemented sampling strategy is needed depending on the objectives of the study (e.g., estimating local eDNA concentrations or maximizing species detections).
Acknowledgments
We wish to thank JC Hustache, P. Perney and C. Galiegue for assisting with eDNA collections. C. Galiegue also contributed to the eDNA extractions[CE1] and digital droplet PCR analyses.
Funding
Funding was provided by the Pole R&D ECLA (pôle Recherche et développement Écosystèmes lacustres).
Conflicts of interest
The authors declare no conflicts of interest.
Data availability statement
The complete data and R script for the statistical analyses are available on the figshare data repository https://doi.org/10.6084/m9.figshare.30032209.v2 (Vautier et al., 2025).
Author contribution statement
All co-authors contributed to the study design. MV performed the field and laboratory work with the assistance of JB. JB performed the statistical analyses and, MV and JB led the writing of the manuscript with significant contributions from all co-authors. All authors revised and approved the final manuscript for publication.
Ethics and permit approval
No ethics and permit approval were needed for the work presented in the manuscript.
Supplementary materials
Table S1. Total number of nucleotide differences between the primers/probe sets used in this study and the COI sequence of other fish species present in French peri-alpine lakes. In total, 35 fish species were tested, including the five target species (indicated by *).
Table S2. Summary table of the proportion of positive detections and the eDNA concentration in the DNA extracts (copies µl-1) for the different sample types (i.e. negative extraction control (NEC), negative field control (NFC), negative template control (NTC), Sterivex filter capsules (Sterivex) and Waterra filter capsules (Waterra)) and target species.
Table S3. Anova summary table of the most parsimonious model.
Table S4. Summary table of the pairwise comparisons between lake and sampling strategies (i.e. point sampling (PS) or integrated sampling (IS)).
Table S5. Anova summary table of the most parsimonious model.
Table S6. Summary table of the pairwise comparisons between lake and sampling strategies (i.e. point sampling (PS) or integrated sampling (IS)).
Table S7. Anova summary table of the most parsimonious model.
Table S8. Summary table of the pairwise comparisons between lake and sampling strategies (i.e. point sampling (PS) or integrated sampling (IS)).
Table S9. Anova summary table of the most parsimonious model.
Table S10. Summary table of the pairwise comparisons between lake and sampling strategies (i.e. point sampling (PS) or integrated sampling (IS)).
Table S11. Anova summary table of the conditional part of the most parsimonious model.
Table S12. Anova summary table of the zero-inflation part of the most parsimonious model.
Table S13. Summary table of the pairwise comparisons between sampling strategies (i.e. point sampling (PS) or integrated sampling (IS)) for the conditional model.
Table S14. Summary table of the pairwise comparisons between sampling strategies (i.e. point sampling (PS) or integrated sampling (IS)) for the zero-inflation model.
Access Supplementary MaterialReferences
- Akaike H. 1974. A new look at the statistical model identification. IEEE Trans Autom Control 19: 716–723. [Google Scholar]
- Akaike H. 1978. On the likelihood of a time series model. J R Stat Soc Ser D Stat 27: 217–235. [Google Scholar]
- Brooks ME, Kristensen K, van Benthem KJ, Magnusson A, Berg CW, Nielsen A, Skaug HJ, Mächler M, Bolker BM. 2017. glmmTMB balances speed and flexibility among packages for zero-inflated generalized linear mixed modeling. The R Journal 9: 378–400. [Google Scholar]
- Capo E, Spong G, Koizumi S, Puts I, Olajos F, Königsson H, Karlsson J, Byström P. 2021. Droplet digital PCR applied to environmental DNA, a promising method to estimate fish population abundance from humic-rich aquatic ecosystems. Environ DNA 3: 343–352. [Google Scholar]
- Civade R, Dejean T, Valentini A, Roset N, Raymond JC, Bonin A, Taberlet P, Pont D. 2016. Spatial representativeness of environmental DNA metabarcoding signal for fish biodiversity assessment in a natural freshwater system. PLOS ONE 11: e0157366. [Google Scholar]
- Condachou C, Coutant O, Brosse S, Murienne J. 2024. Evaluating the eDNA spatial signal in natural populations and its application for the monitoring of the threatened Harttiella (Siluriformes, Loricariidae). Limnol Oceanogr: Methods 22: 660–669. [Google Scholar]
- Djurhuus A, Port J, Closek CJ, Yamahara KM, Romero-Maraccini O, Walz KR, Goldsmith DB, Michisaki R, Breitbart M, Boehm AB, Chavez FP. 2017. Evaluation of filtration and DNA extraction methods for environmental DNA biodiversity assessments across multiple trophic levels. Front Mar Sci 4. [Google Scholar]
- Doi H, Takahara T, Minamoto T, Matsuhashi S, Uchii K, Yamanaka H. 2015. Droplet digital Polymerase Chain Reaction (PCR) outperforms Real-Time PCR in the detection of environmental DNA from an invasive fish species. Environ Sci Technol 49: 5601–5608. [Google Scholar]
- Edmunds RC, Burrows D. 2020. Got glycogen?: Development and multispecies validation of the novel preserve, precipitate, lyse, precipitate, purify (PPLPP) workflow for environmental DNA extraction from Longmire’s preserved water samples. J Biomol Tech 31: 125–150. [Google Scholar]
- Eichmiller JJ, Miller LM, Sorensen PW. 2016. Optimizing techniques to capture and extract environmental DNA for detection and quantification of fish. Mol Ecol Resour 16: 56–68. [Google Scholar]
- Hervé A, Domaizon I, Baudoin J-M, Dejean T, Gibert P, Jean P, Peroux T, Raymond J-C, Valentini A, Vautier M, Logez M. 2022. Spatio-temporal variability of eDNA signal and its implication for fish monitoring in lakes. PLOS ONE 17: e0272660. [Google Scholar]
- Hervé A, Domaizon I, Baudoin J-M, Dejean T, Gibert P, Valentini A, Logez M. 2023. Do temperature and population size structure influence the quantity of fish eDNA in water? Front Environ Sci 11: 1193393. [Google Scholar]
- Hinlo R, Gleeson D, Lintermans M, Furlan E. 2017. Methods to maximise recovery of environmental DNA from water samples. PLOS ONE 12: e0179251. [Google Scholar]
- Jenny J-P, Avrillier J-N, Cachera S, Costel C, Crépin L, Iter-Desgué O, Goulon C, Guillard J, Hamelet V, Hustache J-C, Jacquet S, Lainé L, Perney P, Quétin P, Raphy J, Rautureau C, Rimet F, Rasconi S, Khac VT. 2024. Suivi environnemental des eaux du lac du Bourget pour l’année 2023. inrae hal-04682522. [Google Scholar]
- Kirtane A, Deiner K. 2024. Improving the recovery for dissolved eDNA state: A comparative analysis of isopropanol precipitation, magnetic bead extraction, and centrifugal dialysis. Environ DNA 6: e572. [Google Scholar]
- Kirtane A, Kleyer H, Deiner K. 2023. Sorting states of environmental DNA: Effects of isolation method and water matrix on the recovery of membrane-bound, dissolved, and adsorbed states of eDNA. Environ DNA 5: 582–596. [Google Scholar]
- Lacoursière-Roussel A, Côté G, Leclerc V, Bernatchez L. 2015. Quantifying relative fish abundance with eDNA: a promising tool for fisheries management. J Appl Ecol 53: 1148–1157. [Google Scholar]
- Lacoursière-Roussel A, Rosabal M, Bernatchez L. 2016. Estimating fish abundance and biomass from eDNA concentrations: variability among capture methods and environmental conditions. Mol Ecol Resour 16: 1401–1414. [Google Scholar]
- Lenth RV. 2024. emmeans: estimated marginal means, aka least-squares means. R package version 1105. [Google Scholar]
- Li X, Wu Y, Zhang L, Cao Y, Li Y, Li J, Zhu L, Wu G. 2014. Comparison of three common DNA concentration measurement methods. Anal Biochem 451: 18–24. [Google Scholar]
- Min J, Kim KY. 2024. Optimal filter materials for protist quantification via droplet digital PCR. Algae 39: 51–56. [Google Scholar]
- Miya M, Sato Y, Fukunaga T, Sado T, Poulsen JY, Sato K, Minamoto T, Yamamoto S, Yamanaka H, Araki H, Kondoh M, Iwasaki W. 2015. MiFish, a set of universal PCR primers for metabarcoding environmental DNA from fishes: detection of more than 230 subtropical marine species. R Soc Open Sci 2: 150088. [CrossRef] [PubMed] [Google Scholar]
- Peixoto S, Chaves C, Velo-Antón G, Beja P, Egeter B. 2021. Species detection from aquatic eDNA: Assessing the importance of capture methods. Environ DNA 3: 435–448. [Google Scholar]
- Peixoto S, Mota-Ferreira M, Chaves C, Velo-Antón G, Beja P, Egeter B. 2023. Multi‐species occupancy modeling reveals methodological and environmental effects on eDNA detection of amphibians in temporary ponds. Environ DNA 5: 796–811. [Google Scholar]
- Pont D, Rocle M, Valentini A, Civade R, Jean P, Maire A, Roset N, Schabuss M, Zornig H, Dejean T. 2018. Environmental DNA reveals quantitative patterns of fish biodiversity in large rivers despite its downstream transportation. Sci Rep 8: 10361. [Google Scholar]
- R Development Core Team. 2023. R : a language and environment for statistical computing. Vienna: R Foundation for Statistical Computing. [Google Scholar]
- Rourke ML, Fowler AM, Hughes JM, Broadhurst MK, DiBattista JD, Fielder S, Wilkes Walburn J, Furlan EM. 2021. Environmental DNA (eDNA) as a tool for assessing fish biomass: a review of approaches and future considerations for resource surveys. Environ DNA 4: 9–33. [Google Scholar]
- Spens J, Evans AR, Halfmaerten D, Knudsen SW, Sengupta ME, Mak SST, Sigsgaard EE, Hellström M. 2016. Comparison of capture and storage methods for aqueous macrobial eDNA using an optimized extraction protocol: advantage of enclosed filter. Methods Ecol Evol 8: 635–645. [Google Scholar]
- STE. 2024. Rapport n°20-8342 Rapport Paladru 2023. Sciences et Techniques de l’Environnement, Le Bourget du Lac. [Google Scholar]
- Takahara T, Minamoto T, Yamanaka H, Doi H, Kawabata Z. 2012. Estimation of fish biomass using environmental DNA. PLOS ONE 7: e35868. [CrossRef] [PubMed] [Google Scholar]
- Vautier M. 2024. Freshwater mussel eDNA: water sampling and filtration through Sterivex filter unit. protocols.io. [Google Scholar]
- Vautier M, Galiegue C. 2024. Hydrogen peroxide decontamination of eDNA dedicated material. protocols.io. [Google Scholar]
- Vautier M, Chardon C, Goulon C, Guillard J, Domaizon I. 2023. A quantitative eDNA-based approach to monitor fish spawning in lakes: application to European perch and whitefish. Fish Res 264: 106708. [Google Scholar]
- Vautier M, Chardon C, Galiegue C, Domaizon I. 2024. eDNA extraction from water samples filtered through Sterivex filter units (NucleoMag DNA/RNA Water Kit - MACHERY NAGEL). protocols.io. [Google Scholar]
- Vautier M, Bylemans J, Baudoin J-M, Guillard J, Goulon C, Logez M, Domaizon I. 2025. Environmental DNA (eDNA) sampling strategies influence estimates of freshwater fish eDNA concentrations. figshare. Dataset. [Google Scholar]
- Wickham H, Averick M, Bryan J, Chang W, McGowan L, François R, Grolemund G, Hayes A, Henry L, Hester J, Kuhn M, Pedersen T, Miller E, Bache S, Müller K, Ooms J, Robinson D, Seidel D, Spinu V, Takahashi K, Vaughan D, Wilke C, Woo K, Yutani H. 2019. Welcome to the Tidyverse. J Open Source Softw 4: 1686. [CrossRef] [Google Scholar]
- Yates MC, Gaudet-Boulay M, Garcia Machado E, Côté G, Gilbert A, Bernatchez L. 2023. How much is enough? Examining the sampling effort necessary to estimate mean eDNA concentrations in lentic systems. Environ DNA 5: 1527–1540. [Google Scholar]
Cite this article as: Vautier M, Bylemans J, Baudoin J-M, Guillard J, Goulon C, Logez M, Domaizon I. 2026. Environmental DNA (eDNA) sampling strategies influence estimates of lake fish eDNA concentrations. Knowl. Manag. Aquat. Ecosyst., 427, 9. https://doi.org/10.1051/kmae/2026004
All Tables
Details of the primers and probes used to quantify eDNA of the five target fish species.
All Figures
|
Fig. 1 Geographic location of the two lakes and a visual representation of the environmental DNA sampling strategies for Lake Bourget (A) and Paladru (B). Sampling consisted of spatially integrated sub-surface samples collected using high capacity Waterra filters (green lines: 6 transects for Lake Bourget, 2 transects for Lake Paladru), a deep-water sample collected using a Waterra filter in Lake Bourget (green square), and sub-surface point samples collected using Sterivex filters (black dots: 3 samples per transect and deep-water sample). |
| In the text | |
|
Fig. 2 Effects of sampling strategies (i.e., point sampling (PS) or integrated sampling (IS)) for each lake on total environmental DNA (eDNA) concentrations in the DNA extracts (A), fish eDNA concentrations in the DNA extracts (B), fish eDNA copies standardized by total DNA extracted (C) or litre of filtered water (D), and eDNA concentrations per litre of filtered water for the five-target species in Lake Bourget (E). In panel E, solid points show the mean model estimates with the 50 % (thick lines) and 95 % (thin lines) confidence intervals. |
| In the text | |
|
Fig. 3 Absolute environmental DNA concentrations for the five target species in Lake Bourget observed with the point sampling (PS, n = 21) (x-axis) and integrated sampling (IS, n = 7) (y-axis) strategies. The grey dashed line showed the ideal 1 to 1 correlation. |
| In the text | |
Current usage metrics show cumulative count of Article Views (full-text article views including HTML views, PDF and ePub downloads, according to the available data) and Abstracts Views on Vision4Press platform.
Data correspond to usage on the plateform after 2015. The current usage metrics is available 48-96 hours after online publication and is updated daily on week days.
Initial download of the metrics may take a while.