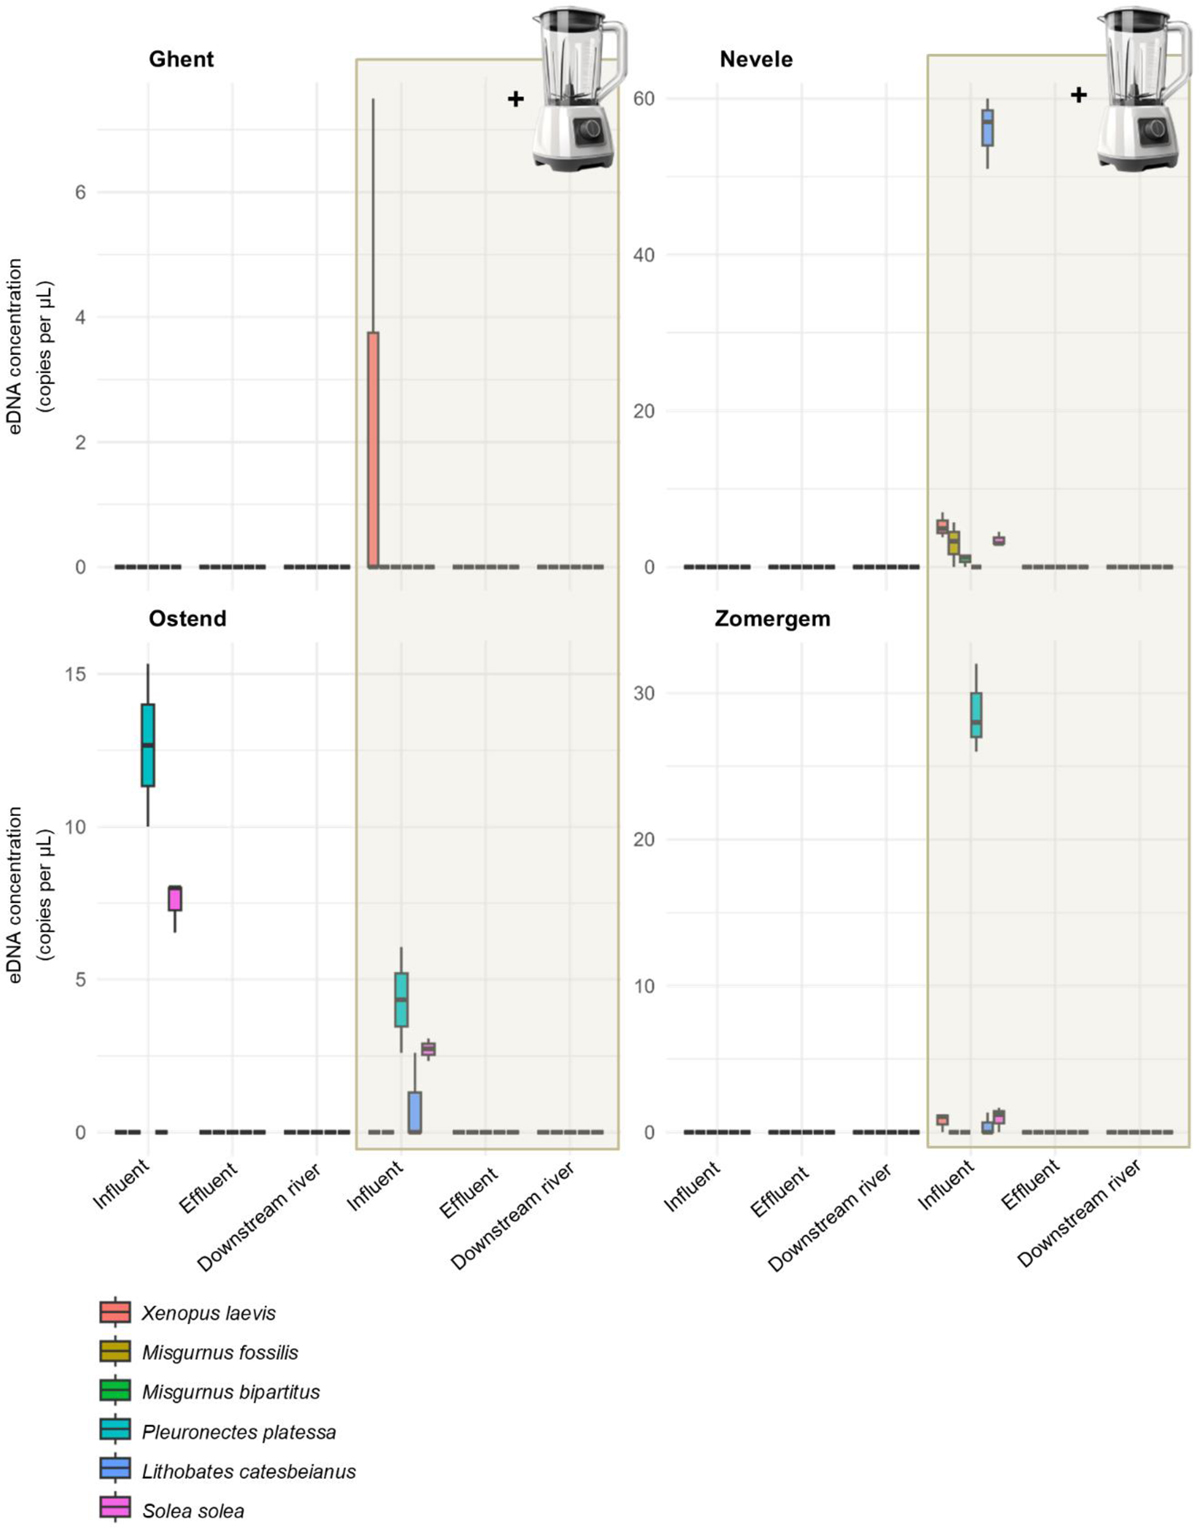
Fig. 4
Download original image
Measured eDNA concentrations (copies per μL) of the six spiked species (i.e., Xenopus laevis, Misgurnus fossilis, Misgurnus bipartitus, Pleuronectes platessa, Lithobates catesbeianus, and Solea solea) across four WWTPs (Ghent, Ostend, Nevele, and Zomergem) at three sampling locations per WWTP: influent (incoming wastewater), effluent (treated water released from the WWTP), and downstream river (100 m from effluent discharge point). The shaded areas with blender icons indicate the introduction of the DNA spike containing six species. Box plots show the distribution of eDNA concentrations for each species across filter replicates. Note that the Y-axis range differs for each panel.
Current usage metrics show cumulative count of Article Views (full-text article views including HTML views, PDF and ePub downloads, according to the available data) and Abstracts Views on Vision4Press platform.
Data correspond to usage on the plateform after 2015. The current usage metrics is available 48-96 hours after online publication and is updated daily on week days.
Initial download of the metrics may take a while.