| Issue |
Knowl. Manag. Aquat. Ecosyst.
Number 426, 2025
Riparian ecology and management
|
|
|---|---|---|
| Article Number | 17 | |
| Number of page(s) | 16 | |
| DOI | https://doi.org/10.1051/kmae/2025009 | |
| Published online | 05 June 2025 | |
Research Paper
Utilizing environmental DNA metabarcoding and local ecological knowledge for fish biodiversity assessment in Rivers of Java, Indonesia
1
Research Center for Conservation of Marine and Inland Water Resources, National Research and Innovation Agency, Cibinong Science Center, Jl. Raya Jakarta − Bogor Km 46, Cibinong, West Java 16915, Indonesia
2
Research Center for Biosystematics and Evolution, National Research and Innovation Agency, Cibinong Science Center, Jl. Raya Jakarta − Bogor Km 46, Cibinong, West Java 16915, Indonesia
3
Yayasan Diversitas Lestari Nusantara, West Java: Pondok Mitra Lestari, Blok C8/3, South Bekasi, West Java 17424, Indonesia Jakarta: Menara Bidakara 2, Annex Building FL 4, Jln. Gatot Subroto, Jakarta Selatan
4
Food and Agriculture Organization (FAO) Representation in Indonesia, Jakarta 10250, Indonesia
5
Gulbali Institute for Agriculture, Water and Environment, Charles Sturt University, PO Box 789, Albury, NSW 2640, Australia
6
School of Agricultural, Environmental and Veterinary Sciences, Charles Sturt University, Albury, NSW 2640, Australia
7
New South Wales Department of Primary Industries, Narrandera Fisheries Centre, Narrandera, NSW 2700, Australia
8
Research Center for Veterinary Science, National Research and Innovation Agency, Cibinong Science Center, Jl. Raya Jakarta − Bogor Km 46, Cibinong, West Java 16915, Indonesia
* Corresponding author: This email address is being protected from spambots. You need JavaScript enabled to view it.
Received:
4
December
2024
Accepted:
15
April
2025
Abstract
Knowledge of fish biodiversity in aquatic ecosystems is critical for sustainable management and conservation of inland waters. Indonesia highlights these issues with its rich natural aquatic biodiversity, which is seriously threatened by human development. To inform restoration goals, we examined the fisheries biodiversity in eight coastal rivers in Java (Indonesia) using environmental DNA (eDNA) and local ecological knowledge (LEK). Three replicate 1L water samples were collected and filtered from each river for environmental DNA metabarcoding, targeting the 12S rRNA gene. LEK surveys were conducted with 50 indigenous residents near the eight focal rivers, including fishers, anglers, traders, and farmers. The combined methodology identified a total of 51 fish species, including 32 through eDNA and 30 through LEK surveys. Both methods detected the same eleven species (22%) in total. The eDNA technique revealed 21 species that fishers had not reported, while fishers reported 18 species that eDNA did not detect. The eDNA approach improves biodiversity identification and monitoring, including the detection of aquatic species that are not recorded by fishermen, especially where historical quantitative data are fragmentary. Meanwhile, LEK can supplement eDNA findings by identifying species that eDNA alone may not detect. We recommend this combined approach where traditional fisheries assessments using capture-based techniques are impractical or cost-prohibitive. Our findings highlight its value in guiding adaptive management strategies in resource-limited regions where traditional fisheries assessments are impractical. Enabling targeted conservation efforts helps protect ecologically significant and culturally important species within priority habitats.
Key words: eDNA / LEK / aquatic assessment / sustainable management / inland waters conservation / Non-native species
© K. Kurniawan et al., Published by EDP Sciences 2025
 This is an Open Access article distributed under the terms of the Creative Commons Attribution License CC-BY-ND (https://creativecommons.org/licenses/by-nd/4.0/), which permits unrestricted use, distribution, and reproduction in any medium, provided the original work is properly cited. If you remix, transform, or build upon the material, you may not distribute the modified material.
1 Introduction
The global decline in freshwater fish diversity represents a serious environmental concern shaped by a range of anthropogenic factors. Since 1970, wildlife populations have had a cumulative drop of 58% (McRae et al., 2017). Populations of freshwater species have decreased by 76%; populations in Central and South America have diminished by 83%; and in the Indo-Pacific, they have fallen by 67% (Moyle and Leidy, 2023). It is not only a global issue but also a matter of urgent concern in regions such as Indonesia, a country of great biodiversity and home to over 1200 species of freshwater fish (Kusuma et al., 2016). Indonesia's freshwater fish exhibit an exceptional level of biodiversity on a global scale (Gustiano et al., 2021; Hubert et al., 2015; Wibowo et al., 2024). Among its islands, Java has remarkably high fish species diversity, boasting a total of 159 distinct species (Dahruddin et al., 2017). The densely populated urban areas in the northern region of Java coincide with higher species richness, diversity, and increased populations of species at risk (Pravitasari et al., 2024; Dahruddin et al., 2017). However, freshwater fishes and their habitats in Java are under pressure from several direct and indirect threats. The direct pressures include anthropogenic activities such as dam construction, urban expansion, agriculture, and resource extraction, which pose significant risks to freshwater fish populations due to habitat degradation, fragmentation, and species loss (Austin et al., 2019; Yuen et al., 2023; Barbarossa et al., 2021). In some regions, fish populations are also directly threatened by overexploitation from substantial harvesting pressures and unsustainable fishing methods (Cooke et al., 2021). Native species face a considerable threat from non-native species, which directly affect them through predation and competition and indirectly through alterations at the ecosystem level (Britton, 2023; Robin et al., 2023; Wibowo et al., 2020). Additionally, restocking activities and raised levels of water pollution represent further indirect threats that can exert detrimental effects on native fish populations, leading to declines in abundance and biodiversity (Arlinghaus et al., 2015; Astuti et al., 2023).
The threat to the inland waters of Java has created an urgent need for a comprehensive assessment of baseline fish biodiversity so that impacts can be evaluated (McIntyre et al., 2016; Reid et al., 2019). Fish biodiversity can be evaluated via direct sampling (e.g., with nets or electrofishing), environmental DNA (eDNA) metabarcoding, and local ecological knowledge surveys (von Ammon et al., 2023). Across large spatial regions, direct sampling techniques are valuable for baselining biodiversity, but they can be expensive and time-intensive (Schoenle et al., 2024; Wibowo et al., 2022). Environmental DNA offers a sustainable solution for long-term monitoring in riverine systems as it minimizes habitat disruption, requires fewer resources, and allows for detecting multiple and rare species from minimal water samples. This approach detects biodiversity in fisheries by collecting water samples, as aquatic animals shed DNA into the environment through substances such as mucus, urine, feces, or decaying tissue (Carraro et al., 2018). eDNA approaches are non-invasive (Bergman et al., 2016), cost-effective (Evans et al., 2017) and often capable of detecting a greater number of species than conventional methods (Civade et al., 2016; Herve et al., 2022). The use of eDNA techniques has been increasingly utilized in Southeast Asia countries to monitor fish biodiversity (Wibowo et al., 2022; Kurniawan et al., 2024), to detect endangered species (Alshari et al., 2024), and to monitor wild stock assessment (Osathanunkul and Madesis, 2022).
Meanwhile, Local Ecological Knowledge (LEK) offers significant benefits in monitoring fish biodiversity, particularly in data-poor contexts (Petriki et al., 2024). Local inhabitants, who have been actively engaged with fisheries on a daily basis over an extended period, possess a rich repository of local ecological knowledge concerning exploited fisheries resources (Runde et al., 2020). They help bridge knowledge gaps regarding fish stocks and often disclose crucial information about resources that researchers may have overlooked (Martins et al., 2018). LEK provides historical and current data on fish species, including changes in species abundance, distribution, and catch composition, which are often unavailable through conventional scientific methods (Castagnino et al., 2023; Leduc et al., 2021).
While eDNA and LEK are valuable, they have limitations. eDNA may produce false positives or negatives due to contamination, degradation, or incomplete reference databases, limiting species identification accuracy (Zaiko et al., 2018). On the other hand, LEK relies on subjective human memory and perceptions, which can introduce biases or inaccuracies (Bessesen and González-Suárez, 2021). It is also limited to species known and observed by the community, potentially overlooking rare or cryptic species. Combining eDNA and LEK helps mitigate these limitations, providing more robust biodiversity assessments (Dlamini et al., 2022; Early et al., 2020).
The utilization of eDNA methods and local ecological knowledge surveys can serve as effective alternatives for assessing fish biodiversity. These methods were combined in eight rivers flowing into the North Coast of West Java and Central Java, where local communities rely on small-scale fisheries for their livelihood (Aziz et al., 2019). These rivers, however, face intense ecological pressure from water pollution due to industrial, domestic, and agricultural waste. Additionally, land conversion and habitat fragmentation from river infrastructure development are increasing rapidly, driven by the high population in West Java and Central Java and the growing need for food and energy. Our objective was to combine environmental metabarcoding and local ecological knowledge surveys to gain a comprehensive understanding of the fish biodiversity in these rivers and to inform managers involved in promoting the sustainability of fisheries resources.
2 Materials and methods
2.1 Environmental DNA survey
2.1.1 Water sample collection
The surveys were conducted in eight rivers across West Java and Central Java provinces, Indonesia (Fig 1). Sampling sites were selected based on the extent of anthropogenic activities that could impact fish population dynamics, the presence of fishers who depend on the river for their livelihoods, and site accessibility. Detailed characteristics of each sampling site, including river length, distance from the river mouth, surrounding land use, and water quality, are presented in Table 1. Rivers in West Java generally originate from volcanic highlands, characterized by short, steep channels with high flow velocities, predominantly forming lotic systems (Djuangsih, 1993). Central Java's rivers also originate from volcanic mountains but flow through more gradual slopes and meander across flatter northern terrain. This results in a greater presence of lentic systems, supporting the formation of wetlands and backwaters (Aida et al., 2022). The survey area included five large rivers, the Cisadane River, Citarum River, Ciliwung River, Cimanuk River, and Cipunagara River and three small rivers, the Kalimalang River, Kalibabadan River and Sragi River (Tab. 1).
The first technique used to investigate fish biodiversity was the collection of environmental DNA samples on one occasion from one sampling site from each of the eight locations conducted in March 2022 (Fig. 1). Three replicate water samples (three samples at the one site at one point in time) from each river were collected at the eight sampling sites in the downstream area. Water samples were obtained from each river using sterile 1-litre bottles, resulting in 3 litres of filtered water per river. To avoid contamination, the bottles were pre-soaked in a bleach solution (sodium hypochlorite) and then rinsed with deionised water. Sterile gloves were used and replaced at each location during sampling, and bottles were capped immediately after filling. Before and after each use, the equipment was cleaned and sterilised. Three replicates, spaced approximately 10 meters apart along the riverbank to inform about spatial variability, were collected from the surface (0–10 cm depth). At each site, temperature, pH, and Dissolved oxygen (DO) were measured using a portable multi-parameter water quality meter (Lutron WA-2017SD, Taiwan) to provide environmental context for water quality. Samples were taken between 8:00 AM and 2:00 PM, and all sampling was performed in the dry season under clear, dry weather to prevent dilution and runoff effects from rainfall. Sampling sites were selected based on the extent of anthropogenic activities that could impact fish population dynamics, the presence of fishers who depend on the river for their livelihoods, and site accessibility. Detailed characteristics of each sampling site, including river length, distance from the river mouth, surrounding land use, and water quality measurements, are presented in Table 1. Water samples were filtered using a 0.45 μm pore size mixed cellulose ester membrane filter (Cat No. 7141-104; Whatman, Japan) in a sterile filter housing connected to a vacuum pump (Coutant et al., 2021). Each filter paper half was placed in a cryotube 2 mL (CT0020, Cryo Tubes, Pre-sterilized, GenFollower, China) containing 2 mL DNA/RNA shield liquid (R1100-250, Zymo Research, USA) and stored in a plastic cryobox (100 well, Biologix, China).
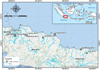 |
Fig. 1 Study location of eDNA and LEK surveys within the eight riverine systems in Java, Indonesia. |
Site characteristics of eight riverine systems in Java, Indonesia, for eDNA and LEK surveys.
2.1.2 Laboratory work
The Qiagen Blood and Tissue DNA Extraction Kit (Qiagen, Hilden, Germany) was used to extract environmental DNA (eDNA) from the filter papers. DNA was isolated from both portions of the amalgamated filter paper according to the manufacturer's instructions. To prevent contamination during DNA extraction, all procedures were performed in a dedicated PCR clean room equipped with HEPA-filtered air, UV sterilization, and positive pressure airflow (Deiner et al., 2015). Pipettes, work surfaces, and equipment were routinely decontaminated using DNA-away solution, and researchers wore full personal protective equipment (PPE), including gloves, lab coats, and face masks. Negative extraction controls, using aqua bidest (double-distilled water), were included at this stage to monitor for potential contamination. Although a positive control water sample was not added to our eDNA workflow, our approach followed established protocols validated in previous studies.
The initial PCR amplification targeted a ∼172 bp region of the 12S rRNA mitochondrial gene using MiFish primer pairs (MiFish-U-F, 5'-GCCGGTAAAACTCGTGCCAGC-3' and MiFish-U-R, 5'-CATAGTAGGGTATCTAATCCTAGTTTG-3'), which are designed to target universal fish sequences (Miya et al., 2015). The PCR reaction mixture included 12 μL of Kapa HotStart HiFi 2 × ReadyMix, 1 μL of each 10 nM primer, 8 μL of ddH2O, and 2 μL of DNA template. To ensure the integrity of the PCR process, two replicates of template controls were included in each run to detect contamination. Additionally, negative PCR controls were included to verify the absence of reagent contamination.
All DNA extractions and PCR setups were performed in a dedicated eDNA facility equipped with a laminar flow hood (fume hood) to minimise airborne contamination. Separate workspaces, lab coats, and pipettes were designated for pre-PCR and post-PCR steps. This area was separated, and all work was done under stringent cleanroom conditions, preventing cross-contamination. All pre-PCR steps were done in a clean area separate from the post-PCR laboratory to minimise contamination. All equipment was decontaminated with 10% bleach and UV-treated before and after use. In addition, disposable gloves were changed frequently, and pipettes were dedicated to pre- and post-PCR workflows.
PCR reactions were conducted on a 96 Universal peqStAR PCR machine (Peqlab Ltd, USA) with thermal cycling conditions of 95 °C for 5 min, followed by 35 cycles of 98 °C for 30 s, 65 °C for 30 s, and 72 °C for 30 s, with a final 72 °C extension for 5 min. A template control with two replicates was included to check for contamination. PCR product quality was checked by electrophoresis on a 2% agarose gel, with a 3 µL aliquot of PCR product and a 100 bp DNA ladder. Electrophoresis was performed at 50 volts for 60 minutes, and results were visualized under UV light using an Alpha Imager Mini Gel Documentation System (Protein Simple Ltd, California, USA).
PCR products that passed electrophoresis quality control underwent a second PCR for indexing. The IDT double index and Illumina sequencing adapter (Illumina Nextera DNA Unique Dual Index, Set A, San Diego, USA) were added to the target amplicon using 12.5 µL of Kapa HotStart HiFi 2 × ReadyMix DNA polymerase and 2 µL of PCR product (Kapa Biosystems Ltd., London, UK). Thermal cycling included 95 °C for 3 min, followed by nine cycles of 95 °C for 30 s, 55 °C for 30 s, and 72 °C for 30 s, with a final extension at 72 °C for 5 min. PCR purification was performed on both PCR products using AMPure XP (Beckman Coulter, Inc.) before proceeding to the next step.
DNA sequencing was performed on an Illumina MiSeq 100 library preparation workflow adapted for short amplicon sequencing (Nakao et al., 2021), following Illumina's recommended protocol for eDNA metabarcoding studies. Amplicon barcode library concentrations were quantified using a Qubit fluorometer, then diluted to 10 nM and pooled. Following Illumina MiSeq library preparation instructions, the pooled library was diluted and denatured. The final mix consisted of 16 μL of the 40 pM amplicon library and 4 μL of the 60 pM PhiX control library. Sequencing was done using the Illumina iSeq v.2 Reagent kit for 2× 150 bp paired-end reads, taking approximately 18 hours and producing a Fastq file. The Illumina-Nextera DNA Unique Dual Index and IDT double index barcodes were not included (following the methods described by Sani et al., 2021).
The Mitochondrial genome database of fish (Mitofish) and the associated MiFish Pipeline was used to analyze all eDNA Fastq files (Sato et al., 2018). All parameters listed below were obtained from the Mitofish platform. The pipeline conducts a series of quality control and analytical steps, including the removal of low-quality reads (quality value < 20), merging of paired-end reads, and elimination of sequences containing ambiguous nucleotides. To ensure that each sequence was only the correct length (∼172 bp), primer sequences were eliminated from these combined reads by trimming 20 bp from the front and 19 bp from the end. Next, the data was filtered to remove sequences with an average QV less than 20 and sequences shorter than 100 bp.
Sequences were de-replicated and clustered into Operational Taxonomic Units (OTUs) using USEARCH (Edgar, 2010). OTUs represented by fewer than 10 reads are excluded to reduce the risk of including sequencing artifacts or low-frequency errors. OTUs were compared against publicly available MiFish reference libraries, available online at http://mitofish.aori.u-tokyo.ac.jp/mifish, and a contamination database. To refine taxonomic assignment, OTUs with high sequence similarity were checked against the NCBI GenBank database. Fish OTUs were identified at ≥97% similarity for a conservative species-level classification. To minimize false positives, we carefully filtered out fish species whose distribution were unlikely to include Indonesian rivers. Any species identified as potential false positives were excluded from our results and not considered in the detected species list.
2.2 Local ecological knowledge survey
The second technique to investigate fish biodiversity was a structured collection of the local ecological knowledge (LEK) using a purposive survey method to capture the fisher's perceptions regarding the status of fish biodiversity in the aquatic habitats where they usually caught fish. The purposive survey method involved deliberately selecting participants or locations based on specific occupations (e.g., fishers, fish traders) or specialized knowledge related to fisheries, ensuring relevance to the research objectives (Bernard, 2017; Etikan et al., 2016). This methodology was used to evaluate whether the LEK of experienced fishers can assess fish status and diversity. The sample size of fishers was selected by implementing the principle of saturation (Newing, 2011), which prioritizes fishers who are still actively fishing. Fishers were chosen based on factors such as age, education, occupation, fishing experience and areas of operation. Participants were fishers who had lived in the area for over five years and relied on river resources for their livelihoods. The interviews were conducted in Indonesian in two sections, each lasting 20 minutes. After all interviews were completed, they were translated into English. To minimize bias, we employed neutral questioning, ensured consistency, addressed misunderstandings, and created a comfortable, non-judgmental environment for participants.
The respondents in the study areas were contacted directly near the sampling sites. We divided the questionnaire into two main sections. The first section aimed to solicit basic information on the demographics and characteristics of the local fishers, including address, gender, age, education, occupation, and fishing experience. The second part of the questionnaire was designed to collect information from the fishers, such as fishing gear, fishing ground, fish biodiversity, factors contributing to the status of the population, and their suggestions for inland fisheries improvement. The questions were open-ended, indicating that the guidelines comprised solely a list of enquiries for unrestricted responses, contingent upon the answers given by the respondents. In this part, respondents could summarize their answers in the questionnaires. To aid in morphological identification, fishers were provided with names and pictures of all possible local fish species, including images of the types of fish identified through the eDNA approach. The total number of respondents from the eight survey locations was 50 fishers. Population status was determined using the method outlined by Gray et al. (2017), with slight modifications to incorporate the local perspectives of fishers. The status categories are as follows: 1) declining: consistent reductions in catch rates, shrinking fish sizes, and the disappearance of species over time; 2) fluctuating: irregular catch patterns, often linked to environmental variability (e.g., floods, droughts) or seasonal changes; 3) stable: consistent catch rates and species composition reported over decades, often tied to effective management or low exploitation; 4) increasing: reports of recovering stocks, larger fish sizes, or reintroduced species, often following management interventions.
2.3 Combining eDNA and LEK
Species occurrence data collected from Local Ecological Knowledge (LEK) surveys were used to cross-check the taxa identified via eDNA sequencing to validate the eDNA results. LEK data was obtained from interviews with local fishers that recorded the species that fishers have historically and currently observed. We compared both datasets and identified species present and differences between the data. Species detected in LEK data but not in eDNA data were inspected to determine if this result was considered a false-negative due to excessive environmental-product interference, sampling bias, or limitations to the primers. This integrative approach was used to evaluate the effectiveness of eDNA in resolving species diversity while addressing the limitations associated both with eDNA sampling and with traditional sampling methods.
Species identities of ambiguous taxonomic groupings were flagged for further review and checked against alternative reference databases (GenBank and BOLD). In cases when multiple closely related species had high sequence similarity, higher taxonomic-level assignments (i.e. genus-level) were used instead of species-level classification. To increase confidence in taxa assignments, each assignment was reported with an associated similarity percentage, and cases with conflicting taxonomic assignments were conservatively labelled at the least confident taxonomic level.
2.4 Data analyses
The eDNA metabarcoding and LEK survey fish taxonomic identification data were organized by phylum, class, order, family, genus, and species. The distribution of taxa number identified from eDNA read-based fish families was visualized to a heatmap based on Jaccard-Distances using TaxonTableTools v1.3.0. The percentage of eDNA reads of identified genera across all sampling sites was shown with a bar plot. The taxonomy and read table file were converted to the TaXonTableTools format using a custom Python script (https://github.com/TillMacher/xml2toTTT) (Macher et al., 2021). The distribution and relative abundance of all identified species were illustrated through the Sankey diagram using TaxonTableTools (TTT) v1.3.0 (https://github.com/TillMacher/TaxonTableTools) and the Python package index (https://pypi.org/project/taxontabletools/) (Macher et al., 2021). Venn diagrams were created using an online tool (http://bioinformatics.psb.ugent.be/webtools/Venn/) to display the number of fish species detected through eDNA surveys and LEK results. Data of local ecological knowledge were visualized using bar charts.
3 Results
3.1 Environmental DNA survey
A total of 82,085 raw reads were generated by sequencing the amplicons from 8 water samples, which were subsequently filtered down to 9056 reads. As a result, 73,029 reads (88.97%) were excluded from further analysis following quality control (SP 1). No taxa were detected in the negative controls. Sequencing depth per sample, species accumulation curve, and rarefaction curve were presented in Figure 2. The confidence level in identification using eDNA is 98.75%. The eDNA read-based family, Ambassidae, was the most commonly detected across nearly all locations and exhibited a high percentage in each river, except for the Cimanuk and Kalibabadan Rivers (SP 2). The eDNA read percentages for each of the 28 fish genera indicate that Ambassis is the most frequently detected genus, followed by Barbonymus (SP 3). A total of 32 fish species were detected based on eDNA reads, with the highest number observed in the Cimanuk River, which hosted 18 species, followed by the Citarum River, with 13 species (Fig. 3).
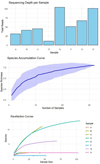 |
Fig. 2 Sequencing depth per sample, species accumulation curve, and rarefaction curve. |
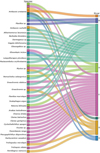 |
Fig. 3 A Sankey diagram illustrates the distribution of eDNA reads for specific species detected across different rivers (A = Cisadane River, B = Kalimalang River, C = Citarum River, D = Ciliwung River, E = Cimanuk River, F = Cipunagara River, G = Kalibabadan River, H = Sragi River). |
3.2 Local ecological knowledge survey
The study respondents comprised angling, subsistence fishers, fish farmers, and fish traders with experience in the eight study rivers (SP 4a). The lowest experience level was represented by fishers with less than 5 years of experience (14%) (SP 4b). All 50 participants were male for equal proportion from eight different river. The highest percentage of respondents in the LEK survey were those with a high school education (38%) and those using fishing rods as their primary gear (58%). Conversely, the lowest percentages were found in the categories of respondents with no formal education (2%) and those using drift nets (4%) (SP 4c-d). From the LEK survey, the majority (56%) of fishers believed that fish populations were declining, followed by those who perceived it as fluctuating (34%), stable (8%) and 2% who thought the fish stock was increasing (Fig. 4a). Habitat destruction (32%) and water pollution (31%) were believed as the major factors for these declines followed by overfishing (14%), invasive species (7%), and habitat fragmentation due to dam/weir construction (7%) (Fig. 4b). The respondents suggested various remediations for potentially mitigating declining fish stocks, including: restocking fish (34%), sustainable management (25%), severe penalties for people who break the regulations (13%) and other factors such as habitat improvement, aquaculture, water management, collaboration, and friendly fishing gear (Fig. 4c).
Based on the LEK survey, a total of 30 fish species were identified in the eight focal rivers (Tab. 2). Six species were found across all eight rivers: C. striata, O. niloticus, O. mossambicus, C. gariepinus, O. vittatus, and N. notopterus. In addition, the fishers identified several other common species, including Oreochromis niloticus, O. mossambicus, C. gariepinus, C. carpio, Pterygoplichthys sp., C. seheli, O. goramy, T. pectoralis, and P. hypophthalmus. With the exception of O.goramy and C. seheli, these species were mainly introduced for aquaculture and the ornamental fish trade.
Fishers qualitatively reported declines in catches for 21 fish species. The most detailed information was provided by fishers from the Cipunagara River, who identified 21 local species. This was followed by fishers from the Citarum River, who identified 19 species, and the Sragi River, with 17 species. In contrast, fishers from the Kalimalang River and the Cimanuk River provided information on only eight species each.
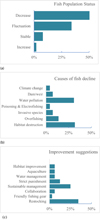 |
Fig. 4 Local ecological knowledge survey provided valuable qualitative insights into fish population status including: (a) the trajectory of the fishery, (b) potential cause of fishery declines based on fishers suggestions and (c) suggestions for improving fisheries resources. |
Checklist of freshwater fish based on eDNA and local ecological knowledge surveys and fishers' perceptions concerning population status in eight rivers.
3.3 Integrated findings
A combined total of 51 fish species were identified, including 32 via eDNA and 30 via LEK surveys (Tab. 2). The comparison of eDNA (A) and LEK (B) across eight rivers reveals distinct detection patterns. In this study, eDNA detected a slightly higher number of species and genera compared to LEK (Fig. 5). However, when examining species counts for each river, LEK revealed more species than eDNA in most cases, except in the Cimanuk River (E), where eDNA detected a greater number of species (Fig. 6). LEK complemented eDNA by confirming the presence of widespread species, including Channa striata (striped snakehead) and Oreochromis spp. (non-native tilapia), which hold economic significance. Discrepancies were observed in rivers like Cipunagara River, where LEK-detected species, such as Carassius botrachus, were absent in eDNA, potentially due to habitat-specific degradation or sampling bias. Conversely, eDNA-detected species, such as Pangasianodon hypophthalmus (striped catfish) in Kalimalang River, were overlooked by LEK. Together, these methods enhance biodiversity assessments, particularly for conservation prioritization in data-poor ecosystems.
Eleven species (22%) were detected by both methods, including Barbodes binotatus, A. testudineus, C. gariepinus, R. argyrotaenia, P. disjunctivus, O. niloticus, Mystus sp, H. nemurus, C. striata, B. gonionotus, and Mastacembelus erythrotaenia (Fig. 7a). The eDNA result revealed an additional 21 species (potentially present) not reported by fishers. Meanwhile, fishers reported 18 species that were not detected by eDNA. Among the 18 undetected fish species, seven are absent from the MiFish database: Barbonymus balleroides, Crenimugil seheli, Macrognathus sp., Nemacheilus fasciatus, Ompok myostoma, Osteochilus vittatus, and Tor sp. Overall, 39 fish species (78%) were native, while the remaining 13 species (25%) were non-native. The majority (90%), or 46 species, had an IUCN conservation status classification of Least Concern. The remainder were categorized as either Data Deficient, Not Evaluated, Vulnerable, Endangered, or Extinct, with one species in each category. Fish species that are in decline, based on fishers' perspectives and eDNA detection, are shown in Figure 7b.
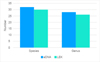 |
Fig. 5 Taxonomic richness of eDNA and LEK identified fish taxon from all eight sampling river sites. |
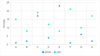 |
Fig. 6 Species richness based on eDNA identified species among all sampling sites (A = Cisadane River, B = Kalimalang River, C = Citarum River, D = Ciliwung River, E = Cimanuk River, F = Cipunagara River, G = Kalibabadan River, H = Sragi River) in Java. |
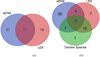 |
Fig. 7 (a) The number of fish species identified from both eDNA and LEK surveys, (b) The number of fish species decline detected from eDNA and LEK Survey. (eDNA=environmental DNA, LEK=Local Ecological Knowledge). |
4 Discussion
Tropical freshwater ecosystems, such as those in Java, are biodiversity hotspots that remain understudied due to challenges in species detection. This study demonstrates that combining eDNA and LEK offers a novel approach to overcoming these limitations. Conventional biodiversity surveys often fail to capture the full range of species, especially in ecosystems with limited historical data. By applying both eDNA and LEK methods, we detected 51 fish species, highlighting the complementary strengths of these approaches. A comparison of eDNA data was conducted to complement traditional surveys to produce a complete species list (Aditya et al., 2020).
The overlap detection of 22% between eDNA and traditional methods is consistent with overlaps reported in other studies (14–64%), which vary based on context (Zou et al., 2020; He et al., 2023 Kurniawan et al., 2024; Wang et al., 2024). This low overlap can be attributed to each method's different biases and detection abilities. eDNA offers the benefit of identifying rare or elusive species that traditional methods may overlook or local knowledge, especially those present in low abundance or hard-to-reach areas.
Conversely, LEK and traditional methods tend to focus on more conspicuous, large-bodied species that are easily caught or recognized by fishers. These methods also tend to reflect long-term patterns that may not be captured by eDNA due to temporal or environmental variations. Therefore, the low overlap illustrates how these methods, while different, provide complementary data.
In our study, several of the rivers had prior fish biodiversity research (Hadiaty, 2011; Herawati et al., 2020; Kartamihardja, 2019), while the Cipunagara, Sragi, Kalibabadan, and Kalimalang Rivers had no previous studies on their fish biodiversity. Previous research conducted by Hadiaty (2011) revealed that in the Ciliwung River, 20 fish species from 13 families were identified. In the Cisadane River, 38 fish species from 24 families were recorded in 2009. Currently, the number of fish species in these two rivers has decreased to 11 in the Ciliwung River and 17 in the Cisadane River. A similar trend is observed in the Cimanuk River, where 40 species from 20 families were reported by Syafei et al. (2001), decreasing to 26 species from 19 families as noted by Herawati et al. (2020), and further decreasing to 16 species at present. In contrast, research on the Citarum River shows a different pattern: the number of species initially decreased from 32 to 18 (Kartamihardja, 2008) but has recently increased to 27. For other rivers, such as the Kalimalang River, Cipunagara River, Kalibabadan River, and Sragi River, studies on fish biodiversity remain limited, making it difficult to ascertain whether there has been a decline or increase in the number of fish species. Therefore, this present study contributes to the valuable updates to the fish biodiversity records in these river systems.
The relatively low number of species detected using LEK and eDNA in some rivers likely reflects a combination of factors, such as temporal and spatial sampling limitations, environmental degradation of extractions of DNA, incomplete reference libraries, and biases in fishers' knowledge toward certain more visible or economically significant fish (Bohmann et al., 2014; Tsuji et al., 2017; Sato et al., 2018; Hind, 2015). Nonetheless, even with all these limitations, the integration of LEK and eDNA remains a valuable tool for preliminary biodiversity assessments and large-scale monitoring for data deficient systems, with an expectation of further accuracy improvements as reference databases and protocols continue to develop (Jerde, 2021; Ruppert et al., 2019; Collins et al., 2019). One of the most critical aspects is developing a comprehensive reference database. If a species is absent from the eDNA reference database (such as MiFish), it cannot be identified even if its DNA is detected. In this study, for example, 7 out of 18 fish species undetected by eDNA were not listed in the MiFish database.
Integrating eDNA and LEK enhances the biodiversity assessment by addressing the gaps each method leaves behind. For example, in the Cisadane and Ciliwung rivers, traditional methods identified 19 additional species, while rapid techniques revealed 21 new species, many of which were also detected by eDNA. This combination proved particularly valuable in uncovering species not previously recorded or overlooked by traditional surveys.
Although eDNA is scalable and cost-effective for large-scale assessments, its high upfront costs and need for specialized equipment remain limitations (Buchner et al., 2024; Martinelli Marín et al., 2024). Although LEK surveys require significant time for interviews and analysis, they are a low-cost alternative that relies on community expertise (Anadón et al., 2009; Shahi et al., 2024; Sheppard et al., 2024). Traditional sampling, though comprehensive, incurs the highest costs in terms of labour, equipment, and time, especially in remote regions (Gehri et al., 2021; Morris et al., 2024). By combining eDNA and LEK, we minimize the reliance on traditional sampling while broadening the scope of species detection.
The use of both methods has allowed us to reconstruct past and present fish fauna and identify biogeographical patterns of non-indigenous species. However, challenges remain in using rapid techniques like eDNA for reliable biodiversity assessments, especially in diverse tropical ecosystems. For example, species detection can be influenced by factors such as water quality, temperature, pH, and microbial activity, which can degrade eDNA (Tsuji et al., 2017; Barnes and Turner, 2016). Additionally, the limitations of the Indonesian public database hinder species identification at the species level, highlighting the need for better reference libraries (Sato et al., 2018).
Despite these challenges, the combined use of eDNA and LEK offers a powerful tool for biodiversity monitoring, revealing insights into species composition and the growing presence of non-native species. Non-native species, such as Oreochromis niloticus and Pterygoplichthys disjunctivus, are likely spreading due to human activities like aquaculture and the ornamental fish trade. The increased presence of invasive species, particularly in degraded habitats, highlights the need for more effective conservation strategies (Syafei et al., 2001; Dewantoro and Rachmatika, 2016).
In the future, integrating eDNA with local knowledge is crucial for adaptive fishery management. While eDNA cannot be applied to estimate fish density or age/size structure, it provides a useful tool for species identification often overlooked in traditional surveys. Improving communication with local fishers will ensure local ecological knowledge complements scientific evidence, enabling more effective management of declining fishery. This study contributes to the understanding of freshwater biodiversity in Java and emphasizes the necessity of combining modern technology with local knowledge for more accurate and comprehensive biodiversity estimation. The increasing richness of non-native species calls for ongoing monitoring and adaptive management to minimize ecological impacts and preserve native fish stocks.
Future research in this area should focus on bolstering local eDNA reference libraries to enhance taxonomic resolution, for instance, by including higher proportions of tropical freshwater taxa where they are underrepresented. Following up, the use of multi-marker metabarcoding approaches (e.g. the integration of 12S coupled with Cytb and CO1) would enhance species detection & coverage. Improving the sampling design, such as collecting a greater volume of water, increasing spatial replicates, and applying occupancy models, can reduce false negatives and enhance confidence in detection. Standardisation of laboratory and field protocols unique to tropical ecosystems will also be required to offset challenges posed by rapid DNA degradation. In addition, false positive detections in eDNA monitoring can occur when DNA from one or more species is detected despite their actual absence in the water samples (Burian et al., 2021). This can result from contamination, sequencing errors, or misidentification in bioinformatics pipelines (Sahu et al., 2023; Li et al., 2019). To address this issue, it is crucial to enhance laboratory protocols to prevent contamination, refine bioinformatics filtering, and validate results using fishing methods and local databases (Wang et al., 2021; Rupert et al., 2019).
Further investigation would also be required to assess the ecological impacts of exotic species invasion and how habitat degradation structures fish community structure. Long-term monitoring protocols integrating eDNA, LEK, and traditional surveys will facilitate adaptive, inexpensive time-series tracking of biodiversity. Enhancing participatory approaches and local monitoring, particularly through the engagement of local fishers, will enhance data richness, increase local relevance, and allow for more inclusive conservation. Finally, translating biodiversity information into policy actions like habitat restoration, restocking, seasonal closure, or regulation of aquaculture activities will be essential to conserving indigenous fish stocks and allowing sustainable management of tropical freshwater fisheries.
5 Conclusion
Combining environmental DNA (eDNA) with Local Ecological Knowledge (LEK) surveys can be a valuable approach to assessing the status and trends of fish biodiversity and baselining fisheries' biodiversity. In this study of eight Indonesian rivers, our integrated approach recorded a total of 51 fish species, where 32 were identified through eDNA, and 30 were found through LEK surveys. Both methods identified a total of eleven unique species (22%). eDNA detected 21 species not reported by fishers, and fishers detected 18 species not detected through eDNA. This demonstrates a 59.4% increase in species detection using an integrated eDNA and LEK approach. Using eDNA, researchers were able to identify cryptic or elusive species that traditional sampling and LEK may have overlooked. At the same time, LEK provided archaeologists with valuable insights about species of cultural or historical importance, which were not captured through the available eDNA data. Furthermore, this combined approach is more cost-effective, scalable, and less invasive than conventional approaches like netting or electrofishing. By integrating these complementary methodologies, our study provides critical insights for enhancing biodiversity monitoring and fisheries conservation efforts. These insights highlight the crucial need for multi-method approaches to enhance fisheries resource management and sustainability, especially in biodiverse and resource-limited regions like Indonesia.
Acknowledgments
The authors extend their gratitude to the FAO Indonesia (IFish) and the Australian Centre for International Agricultural Research (ACIAR) teams for this wonderful opportunity and collaboration. We also acknowledge the Research Center for Fisheries, The Ministry of Marine Affairs and Fisheries, Indonesia. Additionally, we thank the inland fishermen and fisheries extension officers in West Java and Central Java, Indonesia, who significantly contributed to the fieldwork.
Funding
This study was supported by the Food and Agriculture Organization and the Global Environment Facility through the project “Inland Fisheries Practices in Freshwater Ecosystems of High Conservation Value (IFish)” (FAO project code: GCP/INS/303/GFF, GEF ID: 5759). Additional funding was provided by the Australian Centre for International Agricultural Research under Project No. FIS/2018/153.
Conflicts of interest
The authors declare that they have no competing interests.
Data availability statement
The data used in this manuscript will be available online at BRIN Repository: https://data.brin.go.id/dataverse/RestorasiEkosistemPerairan
Supplementary Material
SP 1. DNA concentration, raw reads, filtered reads, OTU and PC success rate.
SP 2. Heatmap the percentage of eDNA read-based fish families detected among all eight river sampling sites in Java (A = Cisadane River, B = Kalimalang River, C = Citarum River, D = Ciliwung River, E = Cimanuk River, F = Cipunagara River, G = Kalibabadan River, H = Sragi River). The top-down color change in right side vertical axis indicates the percentage of dominant fish families.
SP 3. The percentage of eDNA read-based fish genera detected among all eight river sampling sites in Java (A = Cisadane River, B = Kalimalang River, C = Citarum River, D = Ciliwung River, E = Cimanuk River, F = Cipunagara River, G = Kalibabadan River, H = Sragi River).
SP 4. Barplot showing the relative abundance of eDNA reads each of 28 genus among all sampling sites. (A = Cisadane River, B = Kalimalang River, C = Citarum River, D = Ciliwung River, E = Cimanuk River, F = Cipunagara River, G = Kalibabadan River, H = Sragi River).
SP 4. Characteristics of local ecological knowledge respondents based on occupation (a), education level (b), fishing experience (c), and fishing gears used in the riverine systems (d).
Access Supplementary MaterialReferences
- Aditya T. et al. 2020. Aquatic invasions in Indonesia: current knowledge and management. J Environ Manag. [Google Scholar]
- Aida SN, Utomo AD, Anggraeni DP, Ditya YC, Wulandari TNM, Ali M, Caipiang CMA, Suharman I. 2022. Distribution of fish species in relation to water quality condition in Bengawan Solo river, Central Java, Indonesia. Polish J Environ Stud 31: 5549–5561. [CrossRef] [Google Scholar]
- Alshari NFMAH, Adnan MHI, Zainal Abidin DH. et al. 2024. Tracking the tropical aquatic dragon: environmental DNA (eDNA) detection for monitoring the endangered Asian arowana, Scleropages formosus (Müller and Schlegel, 1840). Hydrobiologia. https://doi.org/10.1007/s10750-024-05776-z [Google Scholar]
- Anadón JD, Giménez A, Ballestar R, Pérez I. 2009. Evaluation of local ecological knowledge as a method for collecting extensive data on animal abundance. Conserv Biol 23: 617–625. [CrossRef] [PubMed] [Google Scholar]
- Arlinghaus R, Lorenzen K, Johnson BM, Cooke SJ, Cowx IG. 2015. Management of freshwater fisheries: addressing habitat, people and fishes. Freshw Fish Ecol: 557–579. [Google Scholar]
- Astuti SS, Hariati AM, Kusuma WE, Yuniarti A, Kurniawan NIA, Wiadnya DGR. 2023. Anthropogenic introduction of the Spotted Barb, Barbodes binotatus, across the Wallace Line in western Sulawesi, Indonesia. Biodiversitas J Biolog Divers 24: 1916–1925. [Google Scholar]
- Austin KG, Schwantes A, Gu Y, Kasibhatla PS. 2019. What causes deforestation in Indonesia?. Environ Res Lett 14: 024007. [CrossRef] [Google Scholar]
- Aziz A, Shodikin A, Rana M. 2019. Java coastal community empowerment model. SSRN (3333949), 1–14. [Google Scholar]
- Barbarossa V, Bosmans J, Wanders N, King H, Marc FP, Bienkens Huijbergs MAJ, Schipper AM. 2021. Threats of global warming to the world's freshwater fishes. Nat Commun 12: 1702. [CrossRef] [PubMed] [Google Scholar]
- Bergman PS, Schumer G, Blankenship S, Campbell E. 2016. Detection of adult green sturgeon using environmental DNA analysis. PLoS One 11: e0153500. [CrossRef] [Google Scholar]
- Bernard HR. 2017. Research Methods in Anthropology: Qualitative and Quantitative Approaches (6th ed.). Rowman & Littlefield. [Google Scholar]
- Barnes MA, Turner CR. 2016. The ecology of environmental DNA and implications for conservation genetics. Heredity 117: 214–223. [Google Scholar]
- Bessesen BL, González-Suárez M. 2021. The value and limitations of local ecological knowledge: Longitudinal and retrospective assessment of flagship species in Golfo Dulce, Costa Rica. People Nat 3: 627–638. [CrossRef] [Google Scholar]
- Bohmann K, Evans A, Gilbert MT, Carvalho GR, Creer S, Knapp M, Yu DW, de Bruyn M. 2014. Environmental DNA for wildlife biology and biodiversity monitoring. Trends Ecol Evol 29: 358–367. [CrossRef] [PubMed] [Google Scholar]
- Britton JR. 2023. Contemporary perspectives on the ecological impacts of invasive freshwater fishes. J Fish Biol 103: 752–764. [CrossRef] [PubMed] [Google Scholar]
- Buchner D, Sinclair JS, Ayasse M, Beermann AJ, Buse J, Dziock F, Leese F. 2024. Upscaling biodiversity monitoring: metabarcoding estimates 31,846 insect species from Malaise traps across Germany. Mol Ecol Resour 25: e14023. [Google Scholar]
- Burian A, Mauvisseau Q, Bulling M, Domisch S, Qian S, Sweet M. 2021. Improving the reliability of eDNA data interpretation. Mol Ecol Resour 21: 1422–1433. [CrossRef] [PubMed] [Google Scholar]
- Carraro L, Hartikainen H, Jokela J, Bertuzzo E, Rinaldo A. 2018. Estimating species distribution and abundance in river networks using environmental DNA. Proc Natl Acad Sci 115: 11724–11729. [CrossRef] [PubMed] [Google Scholar]
- Castagnino F, Estévez RA, Caillaux M, Velez-Zuazo X, Gelcich S. 2023. Local ecological knowledge (LEK) suggests overfishing and sequential depletion of Peruvian coastal groundfish. Mar Coast Fish: Dyn Manag Ecosyst Sci 15: e10272. [Google Scholar]
- Civade R, Dejean T, Valentini A, Roset N, Raymond JC, Bonin A, Taberlet P, Pont D. 2016. Spatial representativeness of environmental DNA metabarcoding signal for fish biodiversity assessment in a natural freshwater system. PLoS ONE 11: e0157366. [CrossRef] [PubMed] [Google Scholar]
- Collins RA, Bakker J, Wangensteen OS, Soto AZ, Corrigan L, Sims DW, Genner MJ, Mariani S. 2019. Non‐specific amplification compromises environmental DNA metabarcoding with COI. Methods Ecol Evol 10: 1985–2001. [CrossRef] [Google Scholar]
- Cooke SJ, Nyboer E, Bennett A, Lynch AJ, Infante DM, Cowx IG, Beard TD, Bartley D, Paukert CP, Reid AJ, Funge-Smith S, Gondwe E, Kaunda E, Koehn JD, Souter NJ, Stokes GL, Castello L, Leonard NJ, Skov C, Berg S, Taylor WW. 2021. The ten steps to responsible Inland fisheries in practice: reflections from diverse regional case studies around the globe. Rev Fish Biol Fisher 31: 843–877. [CrossRef] [Google Scholar]
- Coutant O, et al. 2021. Assessing the efficiency of environmental DNA sampling for rare fish detection in large rivers. Environ DNA 3: 157–169. [Google Scholar]
- Dahruddin H, Hutama A, Busson F, Sauri S, Hanner R, Keith P, Hadiaty R, Hubert N. 2017. Revisiting the ichthyodiversity of Java and Bali through DNA barcodes: taxonomic coverage, identification accuracy, cryptic diversity and identification of exotic species. Mol Ecol Resour 17: 288–299. [CrossRef] [PubMed] [Google Scholar]
- Deiner K, et al. 2015. Choice of capture and extraction methods affect detection of freshwater biodiversity from environmental DNA. Biol Conserv 183: 53–63. [CrossRef] [Google Scholar]
- Dewantoro GW, Rachmatika I. 2016. The introduction and Invasive fishes in Indonesia. LIPI PRESS, Jakarta [In Indonesian]. [Google Scholar]
- Djuangsih N. 1993. Understanding the state of river basin management from an environmental toxicology perspective: an example from water pollution at Citarum river basin, West Java, Indonesia. Sci Total Environ 134: 283–292. [CrossRef] [Google Scholar]
- Dlamini V, Samson M, Curtis C, O'Brien G. 2022. Co-opting small-scale fishers' knowledge with scientific data to improve understanding of fish community structures in the Lower Komati River, South Africa. Mar Freshw Res 74: 111–124. [CrossRef] [Google Scholar]
- Early-Capistrán MM, Solana-Arellano E, Abreu-Grobois FA, Narchi NE, Garibay-Melo G, Seminoff JA, .., Saenz-Arroyo A. 2020. Quantifying local ecological knowledge to model historical abundance of long-lived, heavily-exploited fauna. PeerJ 8: e9494. [CrossRef] [PubMed] [Google Scholar]
- Edgar RC. 2010. Search and clustering orders of magnitude faster than BLAST. Bioinformatics 26: 2460–2461. [CrossRef] [PubMed] [Google Scholar]
- Etikan I, Musa SA, Alkassim RS. 2016. Comparison of convenience sampling and purposive sampling. Am J Theor Appl Stat 5: 1–4. [CrossRef] [Google Scholar]
- Evans NT, Shirey PD, Wieringa JG, Mahon AR, Lamberti GA. 2017. Comparative cost and effort of fish distribution detection via environmental DNA analysis and electrofishing. Fisheries 42: 90–99. [CrossRef] [Google Scholar]
- Gehri RR, Larson WA, Gruenthal K, Sard NM, Shi Y. 2021. eDNA metabarcoding outperforms traditional fisheries sampling and reveals fine-scale heterogeneity in a temperate freshwater lake. Environ DNA 3: 912–929. [CrossRef] [Google Scholar]
- Gray TNE, Phommachak A, Vannachomchan K, Guegan F. 2017. Using local ecological knowledge to monitor threatened Mekong megafauna in Lao PDR. PLOS ONE 12: e0183247. [CrossRef] [PubMed] [Google Scholar]
- Gustiano R, Kurniawan K, Haryono H. 2021. Optimizing the utilization of genetic resources of indonesian native freshwater fish. Asian J Conserv Biol 10: 189–196. [CrossRef] [Google Scholar]
- Hadiaty RK. 2011. Diversity and fish species loss in ciliwung and cisadane rivers. Berita Biologi 10: 491–504. [Google Scholar]
- Herawati T, Sidik RAR, Sahidin A, Herawati H. 2020. Struktur Komunitas Ikan di Hilir Sungai Cimanuk Provinsi Jawa Barat pada Musim Penghujan. Jurnal Perikanan Universitas Gadjah Mada 22 (2): 113–122. [CrossRef] [Google Scholar]
- Herve A, Domaizon I, Baudoin JM, Dejean T, Gibert P, Jean P, Peroux T, Raymond JC, Valentini A, Vautier M, Logez, M. 2022. Spatio-temporal variability of eDNA signal and its implication for fish monitoring in lakes. PLoS One 17: e0272660. [CrossRef] [PubMed] [Google Scholar]
- He X, Jeffery NW, Stanley RRE, Hamilton LC, Rubidge EM, Abbott CL. 2023. eDNA metabarcoding enriches traditional trawl survey data for monitoring biodiversity in the marine environment, ICES J Mar Sci 80: 1529–1538. [CrossRef] [Google Scholar]
- Hind EJ. 2015. A review of the past, the present, and the future of fishers' knowledge research: a challenge to established fisheries science. ICES J Mar Sci 72: 341–358. [CrossRef] [Google Scholar]
- Hubert N, Kadarusman Wibowo A, Busson F, Caruso D, Sulandari S, Nafiqoh N, Pouyaud L, Rüber L, Avarre JC, Herder F, Hanner R, Keith P, Hadiaty RK. 2015. DNA Barcoding Indonesian freshwater fishes: challenges and prospects. DNA Barcodes. https://doi.org/10.1515/dna-2015-0018 [Google Scholar]
- Jerde CL. 2021. Can we manage fisheries with the inherent uncertainty from eDNA? J Fish Biol 98: 341–353. [CrossRef] [PubMed] [Google Scholar]
- Kartamihardja ES. 2019. Degradation of native fish diversity in Citarum River, West Java. WARTA IKTIOLOGI 3: 1–8. [Google Scholar]
- Kartamihardja ES. 2008. Change of fish community composition and the influencing important factors during fourty years of the Djuanda reservoir impounded. Journal Iktiologi Indonesia 8: 67–78. [Google Scholar]
- Kurniawan K, Wibowo A, Prakoso VA, Rochman F, Irawan D, Atminarso D, Prasetyo AP, Deniansen T, Ginanjar R, Zamroni M, Iswantari A, Andriyono S, Surbani IL, Rosadi I, Jaya YYP, Sudarsono S, Nagai S, Rourke M, Hubert N, Stuart I, Baumgartner L. 2024. Integrating direct experimental fishing and environmental DNA metabarcoding to assess fish biodiversity in the Cibareno River, Indonesia, to support fishway design. Aquat Conserv: 34 e4250. [CrossRef] [Google Scholar]
- Kusuma WE, Ratmuangkhwang S, Kumazawa Y. 2016. Molecular phylogeny and historical biogeography of the Indonesian freshwater fish Rasbora lateristriata species complex (Actinopterygii: Cyprinidae): Cryptic species and west-to-east divergences. Molec Phylogen Evol 105: 212–223. [CrossRef] [Google Scholar]
- Leduc AOHC, De Carvalho FHD, Hussey NE, Reis-Filho JA, Longo GO, Lopes PFM. 2021. Local ecological knowledge to assist conservation status assessments in data poor contexts: a case study with the threatened sharks of the Brazilian Northeast. Biodivers Conserv 30: 819–845. [CrossRef] [Google Scholar]
- Li J, Lawson Handley LJ, Harper LR, Brys R, Watson HV, Di Muri C, Zhang X, Hänfling B. 2019. Limited dispersion and quick degradation of environmental DNA in fish ponds inferred by metabarcoding. Environmental DNA 1: 238–250 [CrossRef] [Google Scholar]
- Macher TH, Beermann AJ, Leese F. 2021. TaxonTableTools: a comprehensive, platform-independent graphical user interface software to explore and visualise DNA metabarcoding data. Mol Ecol Resour 21: 1705–1714. [CrossRef] [PubMed] [Google Scholar]
- Martinelli Marín D, Lasso CA, Caballero Gaitan SJ. 2024. eDNA metabarcoding: an effective tool for vertebrate diversity studies in the Colombian Amazon and Orinoco basins. Front Ecol Evol 12: 1409296. [CrossRef] [Google Scholar]
- Martins IM, Medeiros RP, Di Domenico M, Hanazaki N. 2018. What fishers' local ecological knowledge can reveal about the changes in exploited fish catches. Fish Res 198: 109–116. [CrossRef] [Google Scholar]
- McIntyre PB, Reidy Liermann CA, Revenga C. 2016. Linking freshwater fishery management to global food security and biodiversity conservation. Proc Natl Acad Sci USA 113: 12880–12885. [CrossRef] [PubMed] [Google Scholar]
- McRae L, Deinet S, Freeman R. 2017. The diversity-weighted living planet index: controlling for taxonomic bias in a global biodiversity indicator. PloS One: 12 e0169156. [CrossRef] [PubMed] [Google Scholar]
- Miya M, Sato Y, Fukunaga T, Sado T, Poulsen JY, Sato K, Minamoto T, Yamamoto S, Yamanaka H, Araki H, Kondoh M. 2015. MiFish, a set of universal PCR primers for metabarcoding environmental DNA from fishes: detection of more than 230 subtropical marine species. Royal Soc Open Sci 2: 150088. [CrossRef] [Google Scholar]
- Morris L, Beesley LS, Stevens ER, Gwinn DC, Hyde J, Thompson S, Douglas MM. 2024. Active eDNA is more cost-effective than fyke nets or passive eDNA collection when monitoring the invasion of an alien freshwater fish. Environ DNA 6: e70010. [CrossRef] [MathSciNet] [Google Scholar]
- Moyle PB, Leidy RA. 2023. Freshwater Fishes: Threatened Species and Threatened Waters on a Global Scale. In N. Maclean (Ed.), The Living Planet: The State of the World's Wildlife. Cambridge University Press, pp. 177–205. [Google Scholar]
- Nakao R, Inui R, Akamatsu Y, Goto M, Doi H, Matsuoka S. 2021. Illumina iSeq 100 and MiSeq exhibit similar performance in freshwater fish environmental DNA metabarcoding. Sci Rep 11: 15763. [CrossRef] [PubMed] [Google Scholar]
- Newing H. 2011. Conducting Research in Conservation: Social Science Methods and Practice (1st ed.) Routledge. https://doi.org/10.4324/9780203846452 [Google Scholar]
- Osathanunkul M, Madesis P. 2022. Environmental DNA detection of giant snakehead in Thailand's major rivers for wild stock assessment. PLoS ONE 17: e0267667. [CrossRef] [PubMed] [Google Scholar]
- Petriki O, Kouletsos A, Ntislidou C, Bobori DC. 2024. Local ecological knowledge (LEK) can guide decision-making in Inland fisheries management. Appl Sci 14: 8819. [CrossRef] [Google Scholar]
- Pravitasari AE, Indraprahasta GS, Rustiadi E, Rosandi VB, Stanny YA, Wulandari S, Priatama RA, Murtadho A. 2024. Dynamics and predictions of urban expansion in Java, Indonesia: continuity and change in mega-urbanization. ISPRS Int J Geo-Inform 13: 102. [CrossRef] [Google Scholar]
- Reid A, Carlson A, Creed I, Eliason E. 2019. Emerging threats and persistent conservation challenges for freshwater biodiversity. Biol Rev Camb Philos Soc 94: 849–873. [CrossRef] [PubMed] [Google Scholar]
- Robin Valen F, Nomleni A, Turnip G, Luhulima M, Insani L. 2023. Presence of non-native freshwater fish in Indonesia: a review − risk and ecological impacts. Aquac Aquar Conserv Legisl Bioflux 16: 66–79. [Google Scholar]
- Runde A, Hallwass G, Silvano RAM. 2020. Fishers' knowledge indicates extensive socioecological impacts downstream of proposed Dams in a Tropical River. One Earth 2: 255–268. [CrossRef] [Google Scholar]
- Ruppert KM, Kline RJ, Rahman MS. 2019. Past, present, and future perspectives of environmental DNA (eDNA) metabarcoding: A systematic review in methods, monitoring, and applications of global eDNA. Glob Ecol Conserv 17. [Google Scholar]
- Sahu A, Kumar N, Pal Singh C, Singh M. 2023. Environmental DNA (eDNA): Powerful technique for biodiversity conservation. J Nat Conserv 71: 126325. [CrossRef] [Google Scholar]
- Sani LMI, Benyamin A, Husna AK, Arafat D, Subhan B, Sunuddin A, Cakasana N, Lestari DF, Madduppa H. 2021. A contrast pattern of reef fish species diversity and distribution using environmental DNA (eDNA) metabarcoding in longitudinal distance from Jakarta Bay. Jurnal Ilmu dan Teknologi Kelautan Tropis 13: 467–482. [Google Scholar]
- Sato Y, Miya M, Fukunaga T, Sado T, Iwasaki W. 2018. MitoFish and MiFish pipeline: a mitochondrial genome database of fish with an analysis pipeline for environmental DNA metabarcoding. Mol Biol Evol 35: 1553–1555. [CrossRef] [PubMed] [Google Scholar]
- Schoenle A, Scepanski D, Floss A, Buchel P, Koblitz AK, Scherwass A, Arndt H, Waldvogel AM. 2024. The dilemma of underestimating freshwater biodiversity: morphological and molecular approaches. BMC Ecol Evol 24: 69. [CrossRef] [PubMed] [Google Scholar]
- Shahi N, Singh B, Mohamad A, Mallik SK. 2024. Environmental DNA and Its Application in Microbial Biodiversity Assessment. In Handbook of Aquatic Microbiology (pp. 239–250). CRC Press [CrossRef] [Google Scholar]
- Sheppard DJ, Stark DJ, Muturi SW, Munene PH. 2024. Benefits of traditional and local ecological knowledge for species recovery when scientific inference is limited. Front Conserv Sci 5: 1383611. [CrossRef] [Google Scholar]
- Syafei DS, Wirjoatmodjo S, Rahardjo MF, Susilo SB. 2001. Fish fauna of Cimanuk River, West Java. Journal Iktiologi Indonesia 1: 1–6. [Google Scholar]
- Tsuji S, Yamanaka H, Minamoto T. 2017. Effects of water pH and proteinase K treatment on the yield of environmental DNA from water samples. Limnology 18: 1–7. [CrossRef] [Google Scholar]
- von Ammon U, Casanovas P, Pochon X, Zirngibl M, Leonard K, Smith A, Chetham J, Milner D, Zaiko A. 2023. Harnessing environmental DNA to reveal biogeographical patterns of non-indigenous species for improved co-governance of the marine environment in Aotearoa New Zealand. Sci Rep 13: 17061. [CrossRef] [PubMed] [Google Scholar]
- Wang B, Jiao L, Ni L, Wang M You P. 2024. Bridging the gap: the integration of eDNA techniques and traditional sampling in fish diversity analysis. Front Mar Sci 11: 1289589. [CrossRef] [Google Scholar]
- Wang S, Yan Z, Hanfling B, Zheng X, Wang P, Fan J, Li J. 2021. Methodology of fish eDNA and its applications in ecology and environment. Sci Total Environ 755: 142622. [CrossRef] [PubMed] [Google Scholar]
- Wang X, Wang J, Lin L, Huang L, Liu K, Dai G, Cai Q, Li J, Feng S, Wang G, Hui Y, Qiu L, Ji F. 2024. Comparison of environmental DNA metabarcoding and a traditional survey method for assessing fish diversity and distribution along salinity gradient in an Urban Brackish Reservoir, China. Biology 13: 930. [CrossRef] [PubMed] [Google Scholar]
- Wibowo A, Atminarso D, Baumgartner L, Vasemagi A. 2020. High prevalence of non-native fish species in a remote region of the Mamberamo River, Indonesia. Pacific Conserv Biol 26: 293–300. [CrossRef] [Google Scholar]
- Wibowo A, Haryono H, Kurniawan K, Prakoso VA, Dahruddin H, Surbani IL, Muslimin B, Jaya YYP, Sudarsono S, Stuart IG, Ahnelt H, Funge-Smith S, Vasemägi A, Hubert N. 2024. Genetic and morphological evidence of a single species of bronze featherback (Notopterus notopterus) in Sundaland. Glob Ecol Conserv 49. https://doi.org/10.1016/j.gecco.2023.e02786 [Google Scholar]
- Wibowo A, Kurniawan K, Atminarso D, Prihadi TH, Baumgartner LJ, Rourke ML, Nagai S, Hubert N, Vasemagi A. 2022. Assessing freshwater fish biodiversity of Kumbe River, Papua (Indonesia) through environmental DNA metabarcoding. Pacific Conserv Biol 29: 340–350. [CrossRef] [Google Scholar]
- Yuen KW, Park E, Hazrina M, Taufik M, Santikayasa P, Latrubesse E, Le JSH. 2023. A comprehensive database of Indonesian dams and its spatial distribution. Remote Sens 15. https://doi.org/10.3390/genes1030413 [Google Scholar]
- Zaiko A, Pochon X, Garcia-Vazquez E, Olenin S, Wood SA. 2018. Advantages and limitations of environmental DNA/RNA tools for marine biosecurity: management and surveillance of non-indigenous species. Front Mar Sci 5. [Google Scholar]
- Zou K, Chen J, Ruan H, Li Z. 2020. eDNA metabarcoding as a promising conservation tool for monitoring fish diversity in a coastal wetland of the Pearl River Estuary compared to bottom trawling. Sci Total Environ 702: 134704. [CrossRef] [PubMed] [Google Scholar]
Cite this article as: Kurniawan K, Wibowo A, Prakoso VA, Chadijah A, Astuti SS, Pratama BB, Nafiqoh N, Haryono H, Dahruddin H, Surbani IL, Jaya YYP, Sudarsono S, Rourke M, Baumgartner LJ, Stuart IG. 2025. Utilizing environmental DNA metabarcoding and local ecological knowledge for fish biodiversity assessment in Rivers of Java, Indonesia. Knowl. Manag. Aquat. Ecosyst., 426. 17. https://doi.org/10.1051/kmae/2025009
All Tables
Site characteristics of eight riverine systems in Java, Indonesia, for eDNA and LEK surveys.
Checklist of freshwater fish based on eDNA and local ecological knowledge surveys and fishers' perceptions concerning population status in eight rivers.
All Figures
|
Fig. 1 Study location of eDNA and LEK surveys within the eight riverine systems in Java, Indonesia. |
| In the text | |
|
Fig. 2 Sequencing depth per sample, species accumulation curve, and rarefaction curve. |
| In the text | |
|
Fig. 3 A Sankey diagram illustrates the distribution of eDNA reads for specific species detected across different rivers (A = Cisadane River, B = Kalimalang River, C = Citarum River, D = Ciliwung River, E = Cimanuk River, F = Cipunagara River, G = Kalibabadan River, H = Sragi River). |
| In the text | |
|
Fig. 4 Local ecological knowledge survey provided valuable qualitative insights into fish population status including: (a) the trajectory of the fishery, (b) potential cause of fishery declines based on fishers suggestions and (c) suggestions for improving fisheries resources. |
| In the text | |
|
Fig. 5 Taxonomic richness of eDNA and LEK identified fish taxon from all eight sampling river sites. |
| In the text | |
|
Fig. 6 Species richness based on eDNA identified species among all sampling sites (A = Cisadane River, B = Kalimalang River, C = Citarum River, D = Ciliwung River, E = Cimanuk River, F = Cipunagara River, G = Kalibabadan River, H = Sragi River) in Java. |
| In the text | |
|
Fig. 7 (a) The number of fish species identified from both eDNA and LEK surveys, (b) The number of fish species decline detected from eDNA and LEK Survey. (eDNA=environmental DNA, LEK=Local Ecological Knowledge). |
| In the text | |
Current usage metrics show cumulative count of Article Views (full-text article views including HTML views, PDF and ePub downloads, according to the available data) and Abstracts Views on Vision4Press platform.
Data correspond to usage on the plateform after 2015. The current usage metrics is available 48-96 hours after online publication and is updated daily on week days.
Initial download of the metrics may take a while.