| Issue |
Knowl. Manag. Aquat. Ecosyst.
Number 425, 2024
Conservation genetics
|
|
|---|---|---|
| Article Number | 24 | |
| Number of page(s) | 7 | |
| DOI | https://doi.org/10.1051/kmae/2024020 | |
| Published online | 24 December 2024 | |
Research Paper
Development of a duplex ddPCR assay for detection of the endangered European eels in the diet of the invasive European catfish
1
CNRS/UPS/IRD/INP, CRBE, UMR5300, Bâtiment 4R1, 118 Rte de Narbonne, 31062 cedex 9 Toulouse, France
2
UMR DECOD (Ecosystem Dynamics and Sustainability), Institut Agro, IFREMER, INRAE, Rennes, France
3
MIAME - Pôle OFB-INRAE-Institut Agro-UPPA pour la gestion des migrateurs amphihalins dans leur environnement, France
4
CNRS, Station d’Écologie Théorique et Expérimentale du CNRS, UAR-2029, 2 route du CNRS, 09200 Moulis, France
* Corresponding author: This email address is being protected from spambots. You need JavaScript enabled to view it.
Received:
5
July
2024
Accepted:
23
October
2024
Abstract
Digital droplet PCR (ddPCR) is an emerging and affordable method already applied to different fields and can now be used to enhance the detection of new species using DNA samples. It could be particularly useful for detecting prey DNA in stomach content or faeces of predators, which is often challenging using traditional methods. Here, we develop a ddPCR assay to detect predation events of a native endangered fish species, the European eel (Anguilla anguilla) from stomach content of an invasive predator, the catfish (Silurus glanis). We demonstrated that this technique presents a very high sensitivity (limit of detection of eel DNA in vitro: 1.5 * 10−3 ng/μL), a good linearity and reproducibility. Then, ddPCR allowed us to identify the presence of eel DNA in the stomach contents of 7 catfish out of the 32 catfish specimens we analyzed, whereas the traditional morphological identification approach detected only one predation event. This method could contribute to a more precise understanding of trophic interactions between prey and predators.
Key words: ddPCR / prey detection / invasive species / trophic interactions / endangered species
© P. Castagné et al., Published by EDP Sciences 2024
 This is an Open Access article distributed under the terms of the Creative Commons Attribution License CC-BY-ND (https://creativecommons.org/licenses/by-nd/4.0/), which permits unrestricted use, distribution, and reproduction in any medium, provided the original work is properly cited. If you remix, transform, or build upon the material, you may not distribute the modified material.
1 Introduction
Introduced predators often have a significant impact on native ecosystems, as they can disrupt natural food chains (Strayer, 2010) and cause declines in populations of native species (Dueñas et al., 2021; Oberdorff, 2022). In many cases, these predators have been introduced to an ecosystem where they have no natural predators or competitors, allowing them to thrive and consume native species at alarming rates. For example, the European catfish preys on Sea lamprey (Petromyzon marinus) in South-West France (Boulêtreau et al., 2020), or the Burmese python (Python molurus bivittatus) poses a threat to several mammal species in the Everglades (Dorcas et al., 2012). This can lead to declines in populations of native species, which may already be under the pressure of other factors such as habitat loss, disease, or climate change (Sala et al., 2000; Harley, 2011; Simberloff et al., 2013; Bellard et al., 2016; Lenzner et al., 2019). Overall, measuring the predation rate of invasive species on native species is a challenging but essential task, and the development of efficient tools to aid in this effort is crucial for effective conservation management.
Traditional methods of monitoring predator-prey interactions, such as analysis of stomach contents has been largely used for identifying prey in the diet of predators. However, this method has limitations (Petta et al., 2020) as it relies on morphological identification of prey remains, which can be prone to errors. Another useful tool is the use of camera traps, which can capture videos of predators in action and provide data on their behavior and interactions with prey species (Wagnon and Serfass 2017; Boulêtreau et al., 2018; Windell et al., 2019). However, it can be difficult to observe and record all instances of predation, as predators often hunt under cover of darkness or in remote locations. Radio telemetry can be also used to track the movements of predators and their prey (Berejikian et al., 2016; Boulêtreau et al., 2020), but it is time-consuming and requires a great deal of effort to obtain meaningful data. Therefore, it is important to explore alternative methods and new technologies to improve the efficiency of measuring predator-prey interactions in natural systems.
Recent advances in molecular techniques have allowed for the detection of prey species in the diets of predators (Symondson, 2002; Blanchet, 2012). These methods rely on the extraction of DNA from predator gut contents followed by PCR amplification. One such technique is metabarcoding, which uses high-throughput sequencing of DNA fragments to simultaneously identify multiple prey species within a single gut sample. This method has proven to be highly efficient and effective in detecting diverse prey communities (Corse et al., 2019; de Sousa et al., 2019). Another emerging method is droplet digital PCR (ddPCR), which allows for the absolute quantification of target DNA sequences in a sample, making it ideal for detecting rare or low abundance prey species in the diet of a predator (Pinheiro et al., 2012). Moreover, this method is cost-efficient, accessible, fast and with a straightforward implementation (Hou et al., 2023). Unlike stomach content analysis, ddPCR relies on the detection of DNA from prey items in predator faecal samples, which can provide a more accurate measure of prey consumption as it allows the detection of prey items that may be partially digested or not visible in stomach contents.
The European eel (Anguilla anguilla) plays a significant ecological and economic role in many aquatic ecosystems, but its populations have declined significantly in recent decades due to a range of factors, including overfishing, habitat loss, pollution (Bevacqua et al., 2011), illegal international trade (Stein et al., 2016), climate change, as well as predation by large invasive fish. One of the main predators of eels is the invasive European catfish (Silurus glanis) (Guillerault et al., 2017), which could potentially have an impact on juvenile eel populations in areas where they coexist (Bevacqua et al., 2011), as catfish may profit from intense period of eel migration to specifically target this resource. To monitor the extent of eel predation by catfish, the use of a duplex ddPCR assay may improve the detection of eel DNA in the diet of catfish with a high degree of sensitivity, even in small and partially digested amounts.
In this study, we performed a duplex ddPCR assay to identify and quantify eel in the digestive tract of catfish and validated the sensitivity, linearity, and reproducibility of this method. Then, we compared its performance with the traditional morphological analysis of the predator’s stomach contents. By using this technique, we will gain a more comprehensive understanding of the ecological dynamics between these two species and this will help to develop targeted management strategies for the conservation of eels.
2 Methods
2.1 ddPCR assay
2.1.1 DNA extraction from fecal samples
We extracted DNA from each catfish fecal sample using the DNeasy mericon food kit (QIAGEN) following manufacturer’s instructions. After isolation, the DNA was stored at −20 °C. Every DNA sample was analyzed by a spectrophotometer (NanoDrop™ One, Thermo Scientific) after isolation to examine purity and by a fluoremeter (Invitrogen™ Qubit™ 4) to quantify DNA concentration. We performed the DNA extraction in a separate room from the PCR amplification. We also performed DNA extraction control on pure water and PCR negative controls.
2.1.2 Amplification with ddPCR
We amplified a 106 bp sequence from the mitochondrial COI gene of A. anguilla using specific primers as described by Jensen et al. (2018) and a 117 bp sequence from the mitochondrial COI gene of S. glanis using specific primers as described by Roy et al. (2018) (refer to Tab. 1 for details). A. anguilla COI mitochondrial DNA was co-amplified together with S. glanis COI mitochondrial DNA to account for the quantity of fecal and gut content used for extraction. A. anguilla DNA was thus expressed as the ratio between the number of A. anguilla DNA copies detected and the number of S. glanis DNA copies detected in the sample (per 10,000 copies of catfish DNA). Following PCR, each droplet is analyzed to determine the fraction of PCR-positive droplets in the original sample. These data are then analyzed by the software using Poisson statistics to determine the target DNA template concentration (number of expected copies) in the original sample.
We run ddPCRs with a BioRad QX200 Droplet Digital PCR system™ (Bio-Rad, Temse, Belgium). Each 22 µl ddPCR reaction mixture, prepared according to the manufacturer’s instructions, consisted of 11 µl of 1× Bio-Rad ddPCR supermix for probes (no dUTP), 1.9 µL each primer (10 µM), 0.5 µL probe (10 µM) and 2.4 µl template. ddPCR reaction was placed in a QX200 Droplet Generator to generate approximately 20,000 droplets in which independent PCR reactions occur. PCR was performed with the following thermal conditions: 95 °C for 10 min followed by 40 cycles of 95 °C for 30 s and 60 °C for 1 min; and 98 °C for 10 min and 4 °C for 30 min. Optimal annealing temperature (60 °C) was determined based on an initial thermal gradient experiment testing temperatures from 54 to 64 °C. Droplets were then read on a QX200 droplet reader (Bio-Rad). Each run included a positive control with S. glanis and A. anguilla DNA and a negative control with water instead of DNA. Each sample was tested in triplicate (N=3). QuantaSoft software was used to count the PCR-positive and PCR-negative droplets and to provide absolute quantification of target DNA. The baseline threshold for separating positive and negative droplets was manually chosen per run, based on the distribution of the negative droplets from the negative control wells. The quantification measurements of each target were expressed as the copies number per 1 microliter of reaction. We considered a sample positive when all three replicates were positive (i.e., when there was at least one drop for each three replicates). We calculated the average number of DNA copies per replicate, which provides a more reliable estimate of the number of DNA copies in each sample.
Specific ddPCR primers (F and R) and probe (P) used for Anguilla anguilla and Silurus glanis detection. Probes are 5′-end modified with a fluorescent dye, and equipped with a quencher-modification at the 3′-end. Names, sequences (5'-> 3') and target fragment length (bp) are indicated.
2.1.3 Detection limit of ddPCR (LOD) − Linearity − Reproducibility
We performed 6-fold serial dilutions of a pure eel DNA sample whose concentration is known. Starting with a concentration of 1.5 ng/µL, sequential dilutions were performed obtaining the following concentrations: 0.15, 1.5*10−2, 1.5*10−3, 1.5*10−4, 1.5*10−5 and 1.5*10−6 ng/µL. To test for potential cross-reactions among primers, probe sets and the targeted DNA (eel and catfish) in duplex ddPCR assay, we performed ddPCR on the serial dilution of Anguilla DNA under three different conditions (i) “Singleplex ddPCR” with only DNA and primers of A. anguilla (ii) “Singleplex-Duplex ddPCR” with only A. anguilla primers/probe, but both A. anguilla and S. glanis templates added (A. anguilla DNA dilution were performed using S. glanis DNA solution (10 ng/µL) as diluent instead of water) and (iii) “Duplex ddPCR” with both A. anguilla and S. glanis primers/probe and both A. anguilla and S. glanis templates added (A. anguilla DNA dilution were performed using S. glanis DNA solution (10 ng/µL) as diluent instead of water). The goal of these tests is to simulate the coexistence of target DNA (eel) and non-target DNA (catfish) in the gut content of the catfish, and to test whether DNA coexistence can alter the performance and robustness of the assay. Each ddPCR was performed in triplicate for each dilution and condition.
The limit of detection (LOD) is the lowest concentration dilution of DNA at which all three replicates were positive (Hougs et al., 2017). Linearity is indicated by the coefficient of determination (r2
) of the linear regression between the log10 of known DNA amounts and the log10 of the number of DNA copies µL−1 quantified by ddPCR. To evaluate the reproducibility of the ddPCR assays, we performed triplicate experiments and we measured the intra-assay coefficient of variation ( ).
).
2.2 Catfish sampling and stomach content analysis
Catfishes came from two localities: 24 from the Garonne River (Southern France) and 8 from the Sélune River (Western France). Individuals from the Garonne River were sampled by professional anglers in Pauillac (GPS coordinates: 45.2, −0.75) in January of 2020. The ones from the Sélune river (approximate GPS coordinates: 48.58, −1.09) were sampled in October of 2019 during an inventory angling realized in the frame of the Sélune river ecological restoration program. All of the catfish individuals were directly frozen after their death. The size of individuals ranged between 86 and 1236 cm. Guts were extracted from defrozen catfishes and the fecal material from the guts were scraped into individual 1.5 mL Eppendorf tubes using sterilized instruments. The fecal contents were then stored at −20 °C. Binocular magnifiers were used for the morphological identification-based eels presence in the guts contents of the catfish.
3 Results
3.1 Detection limit of ddPCR (LOD) − Linearity − Reproducibility
When performing ddPCR in Singleplex condition, the LOD is improved as compared to ddPCR performed with only the set of eel primers but two DNA templates (eel and catfish) (Singleplex-Duplex condition) and to ddPCR performed with both sets of primers and both DNA templates (Duplex condition) (Tab. 2). Singleplex ddPCR conditions can detect quantities that are ten times lower (1.5*10−4 ng/μL) than those detected by the two other conditions (Singleplex-Duplex and Duplex, 1.5*10−3 ng/μL for both conditions) (Tab. 2). Moreover, the concentration of eel DNA estimated by ddPCR is consistently higher in the Singleplex than in the two others conditions (Tab. 2).
A linear regression model was used to compare log10 of known DNA amounts against log10 of the number of DNA copies µL−1 quantified. Droplets were saturating in samples containing 15 ng of target DNA, making the Poisson algorithm invalid and causing a loss of linearity. The Singleplex ddPCR showed good linearity with r2 values of 0.996 (p < 0.001) in the range of 1.5 ng to 0.15 pg, the Singleplex-Duplex ddPPCR also maintained good linearity with r2 values of 0.998 (p < 0.001) in the range of 1.5 ng to 1.5 pg and the Duplex ddPCR showed lower but also good linearity with r2 values of 0.971 (p < 0.001) in the range of 1.5 ng to 0.15 pg (Fig. 1).
The reproducibility of the Duplex ddPCR, measured by the coefficient of variation (CV), showed a decreasing trend with lower target concentrations, as indicated by higher coefficients of variation (CV). The intra-assay CV (coefficient of variation) was included in the range of 4.10–11.2 for DNA templates of eels in the Singleplex ddPCR, while included in the range of 1.91–49.5 for the Singleplex-Duplex ddPCR and in the range of 3.06–44.41 for the Duplex ddPCR (Tab. 2).
Detection limit of A. anguilla (LOD) of droplet digital PCR (ddPCR) using 6 serial dilution for three different conditions a) Singleplex ddPCR (eel's primers and eel's template) (ii) Singleplex − Duplex ddPCR (eel's primers and both A. anguilla and S. glanis templates) (iii) Duplex ddPCR (eel's and catfish's primers and both A. anguilla and S. glanis templates). The LOD is indicated in bold for each condition. Mean copies/μl (n = 3) and CV% between the three replicates  are given for each dilution and each condition.
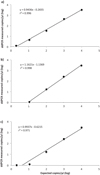 |
Fig. 1 Linear regression of ddPCR measured copies/μl vs. expected copies/μl of Anguilla anguilla DNA (a) for the Singleplex ddPCR condition (b) the Singleplex-Duplex ddPCR condition and (c) the Duplex ddPCR condition. |
3.2 Comparison with the morphological stomach content identification
Among 32 samples, more samples (7) were detected as positive by ddPCR than by stomach content identification (1) (Tab. 3). Among the positive samples, 2 showed high levels of detection (S8 and SEL1A) and 5 low levels of detection (S7, S18; S20, S26 and S28) (Tab. 3).
Results of ddPCR analyses for the positive samples of catfish gut content (a sample was considered positive when all three replicate measurements were positive). Eel and catfish DNA concentration were calculated as the mean number of DNA copies per replicate (mean number of copies/μL). The ratio of eel DNA concentration was expressed as the mean number of eel DNA copies divided by the mean number of catfish DNA copies (scaled to 10,000 copies of catfish DNA).
4 Discussion
In this study, we aimed to detect and quantify eel DNA in the gut contents of invasive European catfish. To achieve this, we developed a specific droplet digital PCR (ddPCR) assay. We demonstrated that this technique presents a very high sensitivity (from 1.5*10−4 ng/μL to 1.5*10−3 ng/μL of DNA detected according to the condition), a good linearity and reproducibility. We also successfully detected eel DNA in the gut contents of 7 juvenile catfish and found that this technique was more efficient compared to traditional methods (eel DNA detected in only one catfish individual).
We conducted sensitivity, linearity, and reproducibility tests under three different conditions: (i) eel DNA with eel-specific primers (Singleplex), (ii) eel DNA with eel-specific primers combined with catfish DNA (Singleplex-Duplex), and (iii) both DNAs with their respective primers (Duplex). These experiments aimed to evaluate the performance and robustness of the assay across various scenarios, simulating the coexistence of target and non-target DNA in the gut contents of the catfish. We demonstrated that the concentration of eel DNA estimated by ddPCR is consistently lower when catfish DNA is added to the reaction. Moreover, when adding catfish DNA, the LOD performance is reduced (from 1.5*10−4 ng/μL to 1.5*10−3 ng/μL). This observation highlights the potential dilution effect caused by the presence of catfish DNA in a PCR reaction sample, thereby making it more challenging for primers to specifically bind to the target DNA, especially when it is present in very small quantities. Also, the coexistence of two different DNA templates can introduce interference between them (Kanagawa, 2003), and the addition of catfish primers and probes in ddPCR may lead to resource competition (nucleotides, enzymes…). Consequently, detecting and quantifying eel DNA in the gut contents of catfish, where catfish DNA is inevitably present in high quantities, can diminish the efficiency of amplification. This, in turn, leads to a decrease in the overall sensitivity of ddPCR for detecting low quantities of eel DNA. Nevertheless, despite this reduction, the detection sensitivity remains very high. Furthermore, the linearity of the ddPCR assay exhibited a strong correlation between the input DNA concentration and the quantification results, regardless of the three conditions, providing a reliable measure of eel DNA abundance (r2 values always > 0.971).
The reproducibility of the ddPCR assay (measured by CV) decreased with the low DNA concentrations, suggesting a reduced precision of the absolute quantification at the lower limit of the range. The CV remains below the acceptable level of precision (>30%) for the Singleplex condition (Baker et al., 2020). However, the CV for the other two conditions (Singleplex-duplex and Duplex) exceeds the acceptable limit (respectively 44.41% and 49.5%) for low DNA concentrations (1.5*10−3 ng/μL). This observation highlights the need for careful interpretation of eel DNA abundance results in catfish’s diet when observed at very low concentrations. In routine practice, we suggest adding more replicates to samples with low DNA concentrations to reduce the impact of random variations and improve the precision of the absolute quantification results. Despite this limitation, the overall performance of the ddPCR assay remained robust, providing valuable insights into the presence of eel DNA in the diet of invasive European catfish.
Afterwards, we evaluated the performance of eel detection in the gut contents of catfish using ddPCR compared to traditional morphological identification methods. Our results clearly demonstrated that ddPCR outperformed conventional morphological identification methods, providing a reliable and efficient tool for studying the dietary habits of these predatory fish species. Indeed, ddPCR enabled the detection and quantification of DNA at a minimal concentration of 1.5*10−3 ng/μL, providing a level of precision that surpasses traditional methods, which are limited to detecting the presence or absence of DNA. In addition, when applying ddPCR on catfish guts contents, we detected 7 positive samples, even when the levels of DNA were low. This method was much more precise in detecting the presence of eels in catfish feces compared to the morphological method, which detected only 1 positive individual. This can be easily explained by the nature of the material being detected and by the temporal aspect of the predation. When eel remains, such as bones, were digested or became unidentifiable, the DNA remained intact, serving as a more reliable indicator of eel presence.
The European eel is currently facing numerous threats, and our findings shed light on the potential impact of predation by European catfish as an additional contributing factor. Our study successfully confirmed the presence of eel DNA in catfish feces, corroborating similar observations made in other studies (Guillerault et al., 2017). This study is the first one showing that ddPCR protocols allow reliable detection of trophic interactions, specifically the interactions between preys and their predators. By utilizing ddPCR, we were able to assess the impact of catfish predation on European eels at a larger scale. When considering absolute quantification, we also identified that this method is less precise for very low concentrations of DNA, issue that could be overcame by multiplying replicates. This innovative approach provides valuable insights into the dynamics of predator-prey relationships and contributes to our understanding of ecological interactions in aquatic ecosystems. Finally, ddPCR could be used in routine practise over a high number of samples and is cost effective (Hou et al., 2023).
Acknowledgements
We are grateful to all anglers that provide us catfish samples we used in this study. We also thank Emeline Lhuillier and Frederic Martins from the Genotoul Get-Santé laboratory for their help with ddPCR.
References
- Baker P, Platton S, Gibson C, et al. 2020. Guidelines on the laboratory aspects of assays used in haemostasis and thrombosis. Br J Haematol 191: 347–362. [CrossRef] [PubMed] [Google Scholar]
- Bellard C, Cassey P, Blackburn TM. 2016. Alien species as a driver of recent extinctions. Biol Lett 12: 20150623. [CrossRef] [PubMed] [Google Scholar]
- Berejikian BA, Moore ME, Jeffries SJ. 2016. Predator-prey interactions between harbor seals and migrating steelhead trout smolts revealed by acoustic telemetry. Mar Ecol Progr Ser 543: 21–35. [CrossRef] [Google Scholar]
- Bevacqua D, Andrello M, Melià P, et al. 2011. Density-dependent and inter-specific interactions affecting European eel settlement in freshwater habitats. Hydrobiologia 671: 259–265. [CrossRef] [Google Scholar]
- Blanchet S. 2012. The use of molecular tools in invasion biology: an emphasis on freshwater ecosystems. Fish Manag Ecol 19: 120–132. [CrossRef] [Google Scholar]
- Boulêtreau S, Carry L, Meyer E, et al. 2020. High predation of native sea lamprey during spawning migration. Sci Rep 10: 6122. [CrossRef] [PubMed] [Google Scholar]
- Boulêtreau S, Gaillagot A, Carry L, et al. 2018. Adult Atlantic salmon have a new freshwater predator. PLoS ONE 13: undefined-undefined. [Google Scholar]
- Corse E, Tougard C, Archambaud-Suard G, et al. 2019. One-locus-several-primers: a strategy to improve the taxonomic and haplotypic coverage in diet metabarcoding studies. Ecol Evolut 9: 4603–4620. [CrossRef] [Google Scholar]
- De Sousa LL, Silva SM, Xavier R. 2019. DNA metabarcoding in diet studies: Unveiling ecological aspects in aquatic and terrestrial ecosystems. Environ DNA 1: 199–214. [CrossRef] [Google Scholar]
- Dorcas ME, Willson JD, Reed RN, et al. 2012. Severe mammal declines coincide with proliferation of invasive Burmese pythons in Everglades National Park. Proc Natl Acad Sci 109: 2418–2422. [CrossRef] [PubMed] [Google Scholar]
- Dueñas M-A, Hemming DJ, Roberts A, Diaz-Soltero H. 2021. The threat of invasive species to IUCN-listed critically endangered species: a systematic review. Glob Ecol Conserv 26:e 01476. [Google Scholar]
- Guillerault N, Bouletreau S, Iribar A, et al. 2017. Application of DNA metabarcoding on faeces to identify European catfish Silurus glanis diet. J Fish Biol 90: 2214–2219. [CrossRef] [PubMed] [Google Scholar]
- Harley CDG. 2011. Climate change, keystone predation, and biodiversity loss. Science 334: 1124–1127. [CrossRef] [PubMed] [Google Scholar]
- Hou Y, Chen S, Zheng Y, et al. 2023. Droplet-based digital PCR (ddPCR) and its applications. TrAC Trends Anal Chem 158: 116897. [CrossRef] [Google Scholar]
- Hougs L, Gatto F, Goerlich O, et al. 2017. Verification of analytical methods for GMO testing when implementing interlaboratory validated methods: version 2: Publication Office of the European Union, Luxembourg. https://doi.org/10.2760/64511 [Google Scholar]
- Jensen MR, Knudsen SW, Munk P, et al. 2018. Tracing European eel in the diet of mesopelagic fishes from the Sargasso Sea using DNA from fish stomachs. Mar Biol 165: 130. [CrossRef] [Google Scholar]
- Kanagawa T. 2003. Bias and artifacts in multitemplate polymerase chain reactions (PCR). J Biosci Bioeng 96: 317–323. [CrossRef] [PubMed] [Google Scholar]
- Lenzner B, Leclère D, Franklin O, et al. 2019. A framework for global twenty-first century scenarios and models of biological invasions. BioScience 69: 697–710. [CrossRef] [PubMed] [Google Scholar]
- Oberdorff T. 2022. Time for decisive actions to protect freshwater ecosystems from global changes. Knowl Manag Aquat Ecosyst 19. https://doi.org/10.1051/kmae/2022017 [Google Scholar]
- Petta JC, Shipley ON, Wintner SP, et al. 2020. Are you really what you eat? Stomach content analysis and stable isotope ratios do not uniformly estimate dietary niche characteristics in three marine predators. Oecologia 192: 1111–1126. [Google Scholar]
- Pinheiro LB, Coleman VA, Hindson CM, et al. 2012. Evaluation of a Droplet digital polymerase chain reaction format for DNA copy number quantification. Anal Chem 84: 1003–1011. [CrossRef] [PubMed] [Google Scholar]
- Roy M, Belliveau V, Mandrak NE, Gagné N. 2018. Development of environmental DNA (eDNA) methods for detecting high-risk freshwater fishes in live trade in Canada. Biol Invasions 20: 299–314. [CrossRef] [Google Scholar]
- Sala OE, Chapin FS, Iii, et al. 2000. Global biodiversity scenarios for the year 2100. Science 287: 1770–1774. [CrossRef] [PubMed] [Google Scholar]
- Simberloff D, Martin J-L, Genovesi P, et al. 2013. Impacts of biological invasions: what’s what and the way forward. Trends Ecol Evol 28: 58–66. [CrossRef] [PubMed] [Google Scholar]
- Stein FM, Wong JCY, Sheng V, et al. 2016. First genetic evidence of illegal trade in endangered European eel (Anguilla anguilla) from Europe to Asia. Conservation Genet Resour 8: 533–537. [CrossRef] [Google Scholar]
- Strayer DL. 2010. Alien species in fresh waters: ecological effects, interactions with other stressors, and prospects for the future. Freshw Biol 55: 152–174. [Google Scholar]
- Symondson WOC. 2002. Molecular identification of prey in predator diets. Mol Ecol 11: 627–641. [CrossRef] [PubMed] [Google Scholar]
- Wagnon CJ, Serfass TL. 2017. Use of Camera traps provides insight into the feeding ecology of red foxes (Vulpes vulpes). Can Field-Natural 131: 19–22. [CrossRef] [Google Scholar]
- Windell RM, Lewis JS, Gramza AR, Crooks KR. 2019. Carnivore carrying behavior as documented with wildlife camera traps. wnan 79: 471–480. [Google Scholar]
Cite this article as: Castagné P, Martignac F, Santoul F, Blanchet S, Loot G. 2024. Development of a duplex ddPCR assay for detection of the endangered European eels in the diet of the invasive European catfish. Knowl. Manag. Aquat. Ecosyst., 425, 24.
All Tables
Specific ddPCR primers (F and R) and probe (P) used for Anguilla anguilla and Silurus glanis detection. Probes are 5′-end modified with a fluorescent dye, and equipped with a quencher-modification at the 3′-end. Names, sequences (5'-> 3') and target fragment length (bp) are indicated.
Detection limit of A. anguilla (LOD) of droplet digital PCR (ddPCR) using 6 serial dilution for three different conditions a) Singleplex ddPCR (eel's primers and eel's template) (ii) Singleplex − Duplex ddPCR (eel's primers and both A. anguilla and S. glanis templates) (iii) Duplex ddPCR (eel's and catfish's primers and both A. anguilla and S. glanis templates). The LOD is indicated in bold for each condition. Mean copies/μl (n = 3) and CV% between the three replicates are given for each dilution and each condition.
Results of ddPCR analyses for the positive samples of catfish gut content (a sample was considered positive when all three replicate measurements were positive). Eel and catfish DNA concentration were calculated as the mean number of DNA copies per replicate (mean number of copies/μL). The ratio of eel DNA concentration was expressed as the mean number of eel DNA copies divided by the mean number of catfish DNA copies (scaled to 10,000 copies of catfish DNA).
All Figures
|
Fig. 1 Linear regression of ddPCR measured copies/μl vs. expected copies/μl of Anguilla anguilla DNA (a) for the Singleplex ddPCR condition (b) the Singleplex-Duplex ddPCR condition and (c) the Duplex ddPCR condition. |
| In the text | |
Current usage metrics show cumulative count of Article Views (full-text article views including HTML views, PDF and ePub downloads, according to the available data) and Abstracts Views on Vision4Press platform.
Data correspond to usage on the plateform after 2015. The current usage metrics is available 48-96 hours after online publication and is updated daily on week days.
Initial download of the metrics may take a while.