Fig. 3
Download original image
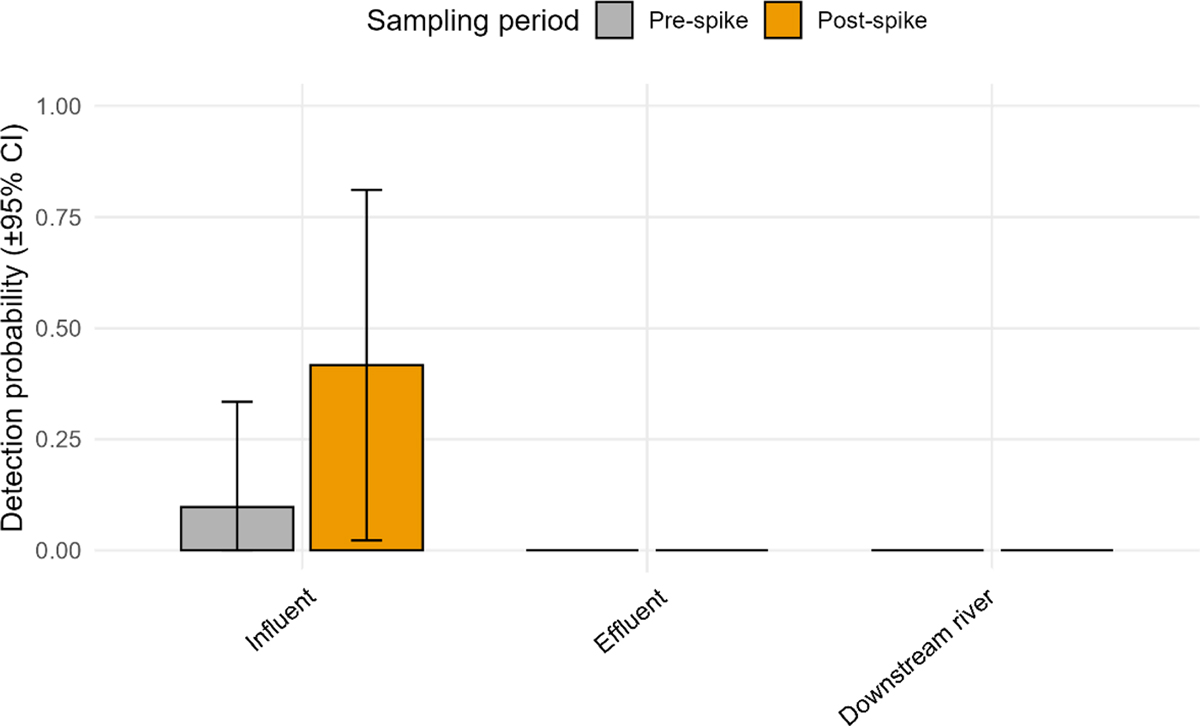
Overall treatment barrier effect: Mean eDNA detection probability (±95% CI) of the six spiked species across WWTPs, based on the proportion of positive ddPCR detections before (pre-spike) and after (post-spike) the controlled introduction of the homogenized tissue mixture at the influent. Bars show mean detection probabilities aggregated across all taxa and facilities. The X-axis represents the sampling locations per WWTP, i.e., the influent (incoming untreated wastewater), the effluent (treated discharge water), and the downstream river site (100 m from the effluent outflow).
Current usage metrics show cumulative count of Article Views (full-text article views including HTML views, PDF and ePub downloads, according to the available data) and Abstracts Views on Vision4Press platform.
Data correspond to usage on the plateform after 2015. The current usage metrics is available 48-96 hours after online publication and is updated daily on week days.
Initial download of the metrics may take a while.