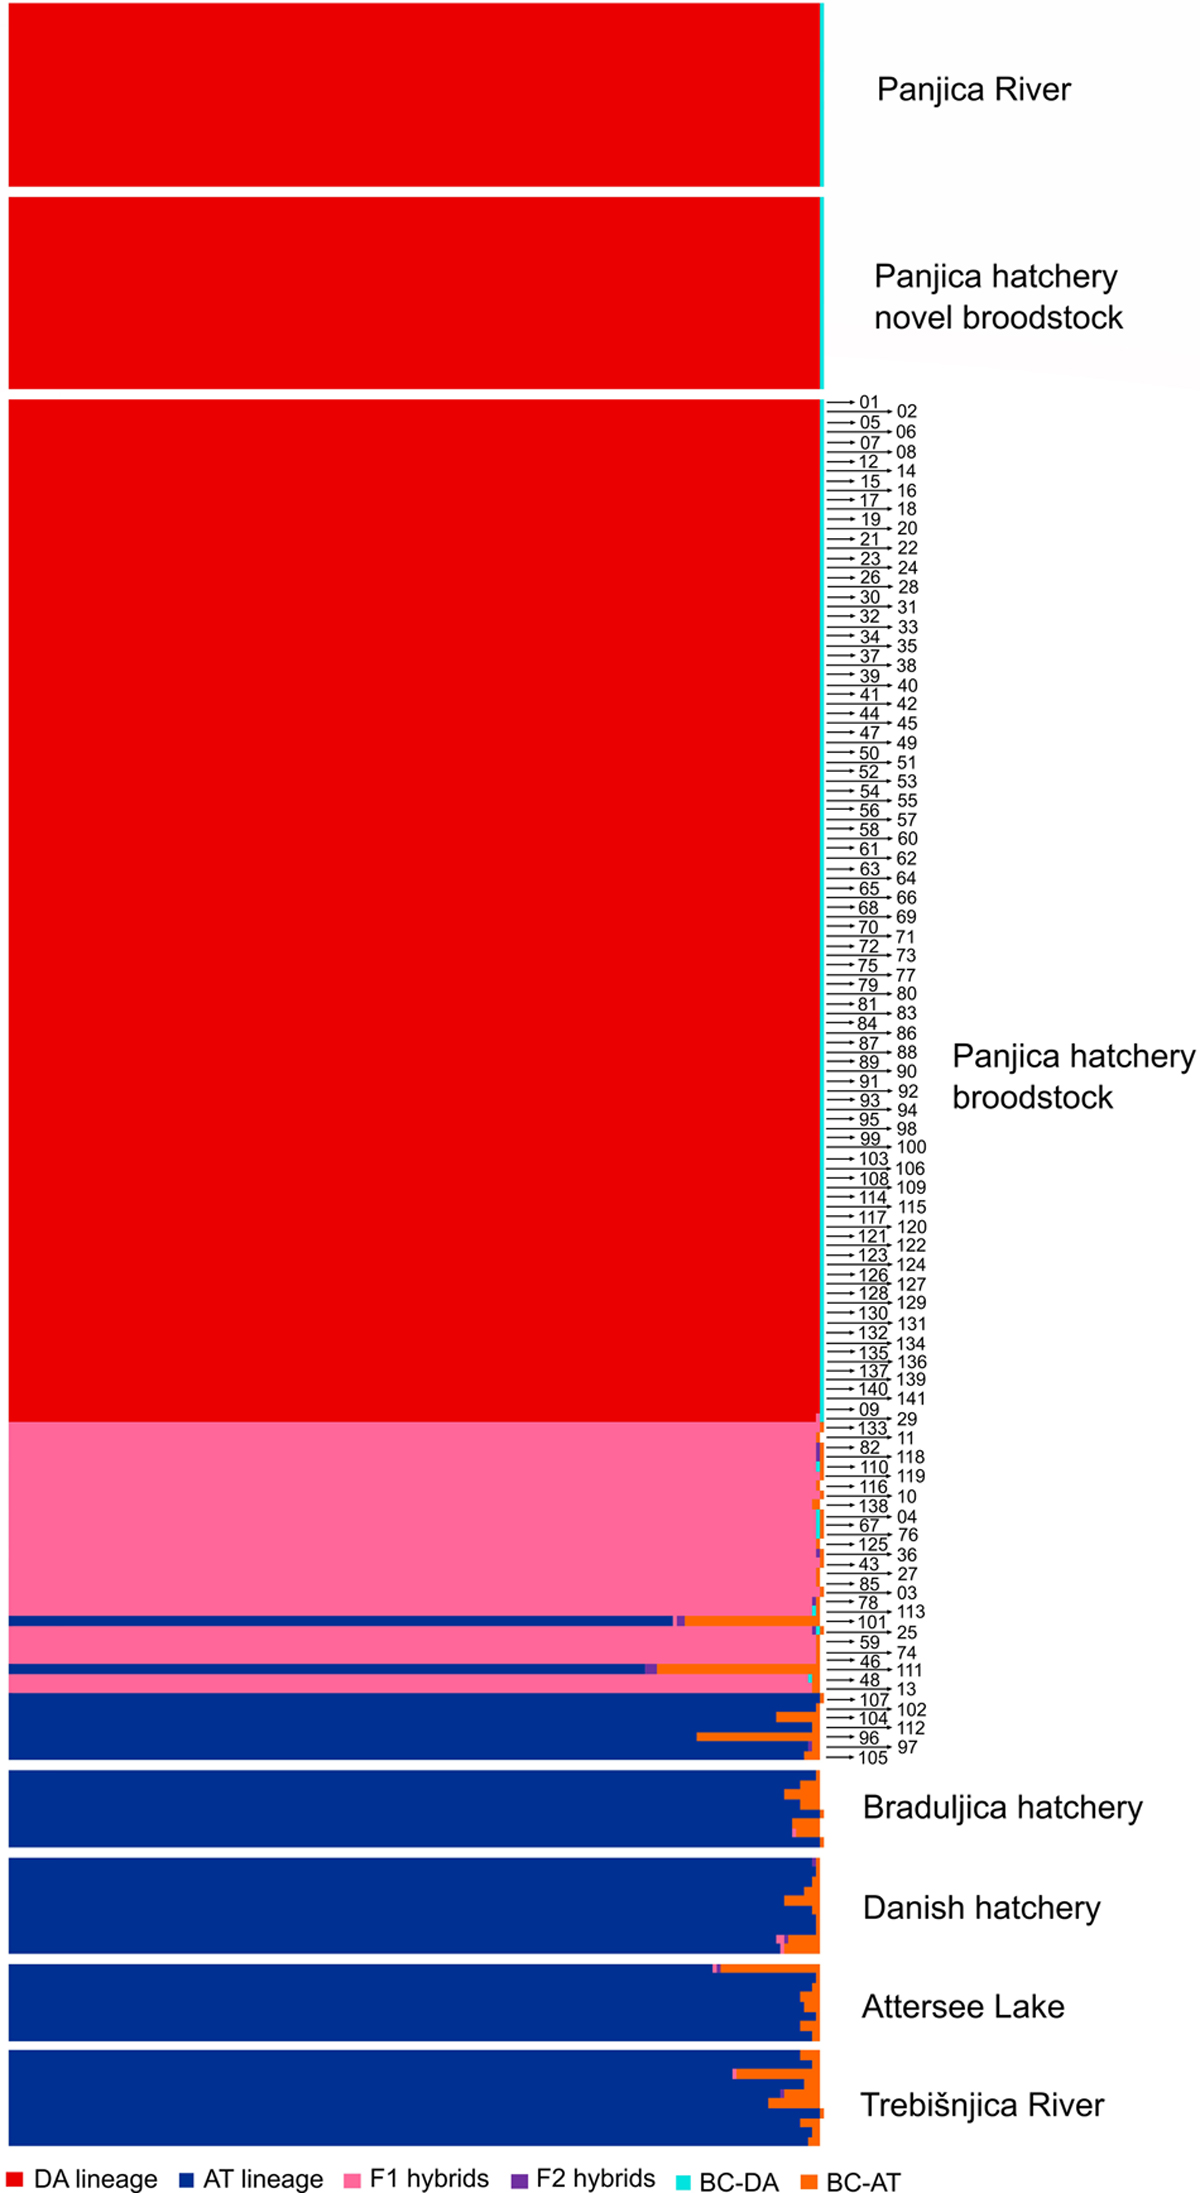
Fig. 4
Download original image
NewHybrids analyses using uniform priors based on microsatellite data. The color illustrates the estimated posterior probabilities that an individual belongs to one genotype frequency categories: DA lineage (red), AT lineage (blue), F1 hybrids (pink), F2 hybrids (violet), backcrosses with DA (turquoise), and crosses with AT (orange).
Current usage metrics show cumulative count of Article Views (full-text article views including HTML views, PDF and ePub downloads, according to the available data) and Abstracts Views on Vision4Press platform.
Data correspond to usage on the plateform after 2015. The current usage metrics is available 48-96 hours after online publication and is updated daily on week days.
Initial download of the metrics may take a while.