Fig. 1
Download original image
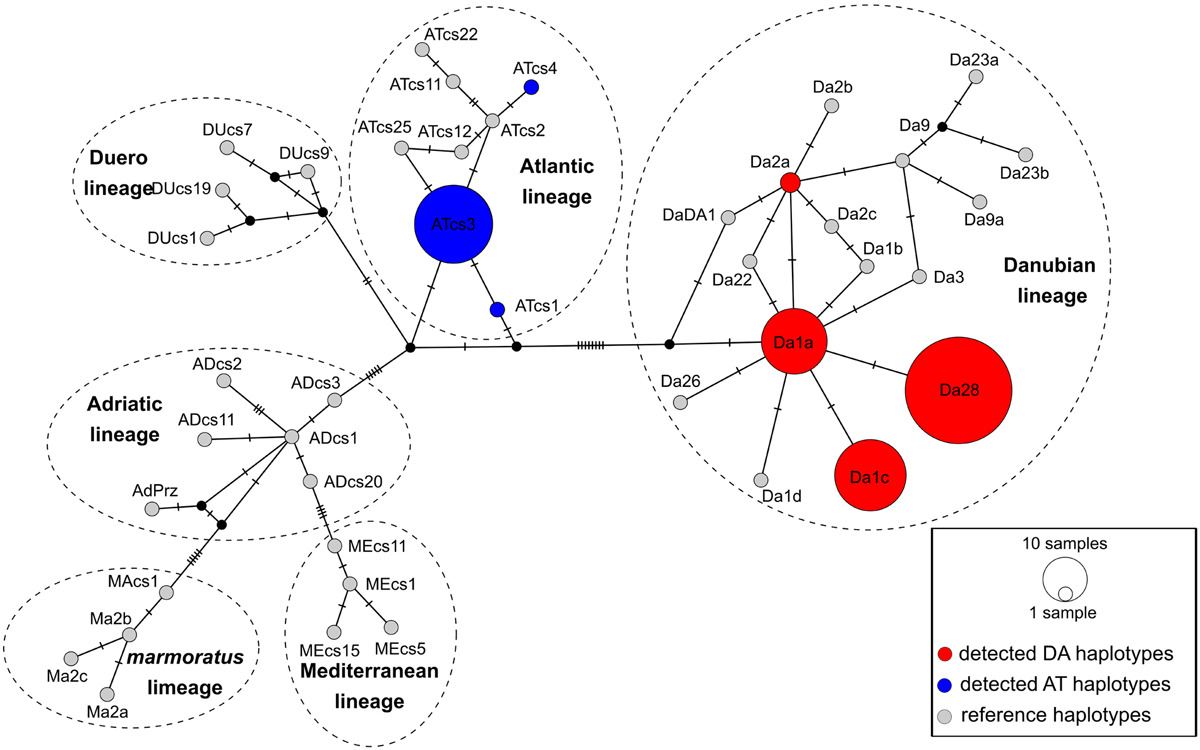
Median-joining network of brown trout mtDNA CR haplotypes. Previously described haplotypes that were not detected in this study are represented by grey circles of the same size. For haplotypes detected in the Panjica hatchery broodstock, the size of the cirlces reflects the frequency of each haplotype, and they are color coded (red – DA, blue – AT lineage). Mutations are represented by slashes crossed with the network branches. The black circle indicates an extinct, ancestral or unsampled haplotype.
Current usage metrics show cumulative count of Article Views (full-text article views including HTML views, PDF and ePub downloads, according to the available data) and Abstracts Views on Vision4Press platform.
Data correspond to usage on the plateform after 2015. The current usage metrics is available 48-96 hours after online publication and is updated daily on week days.
Initial download of the metrics may take a while.