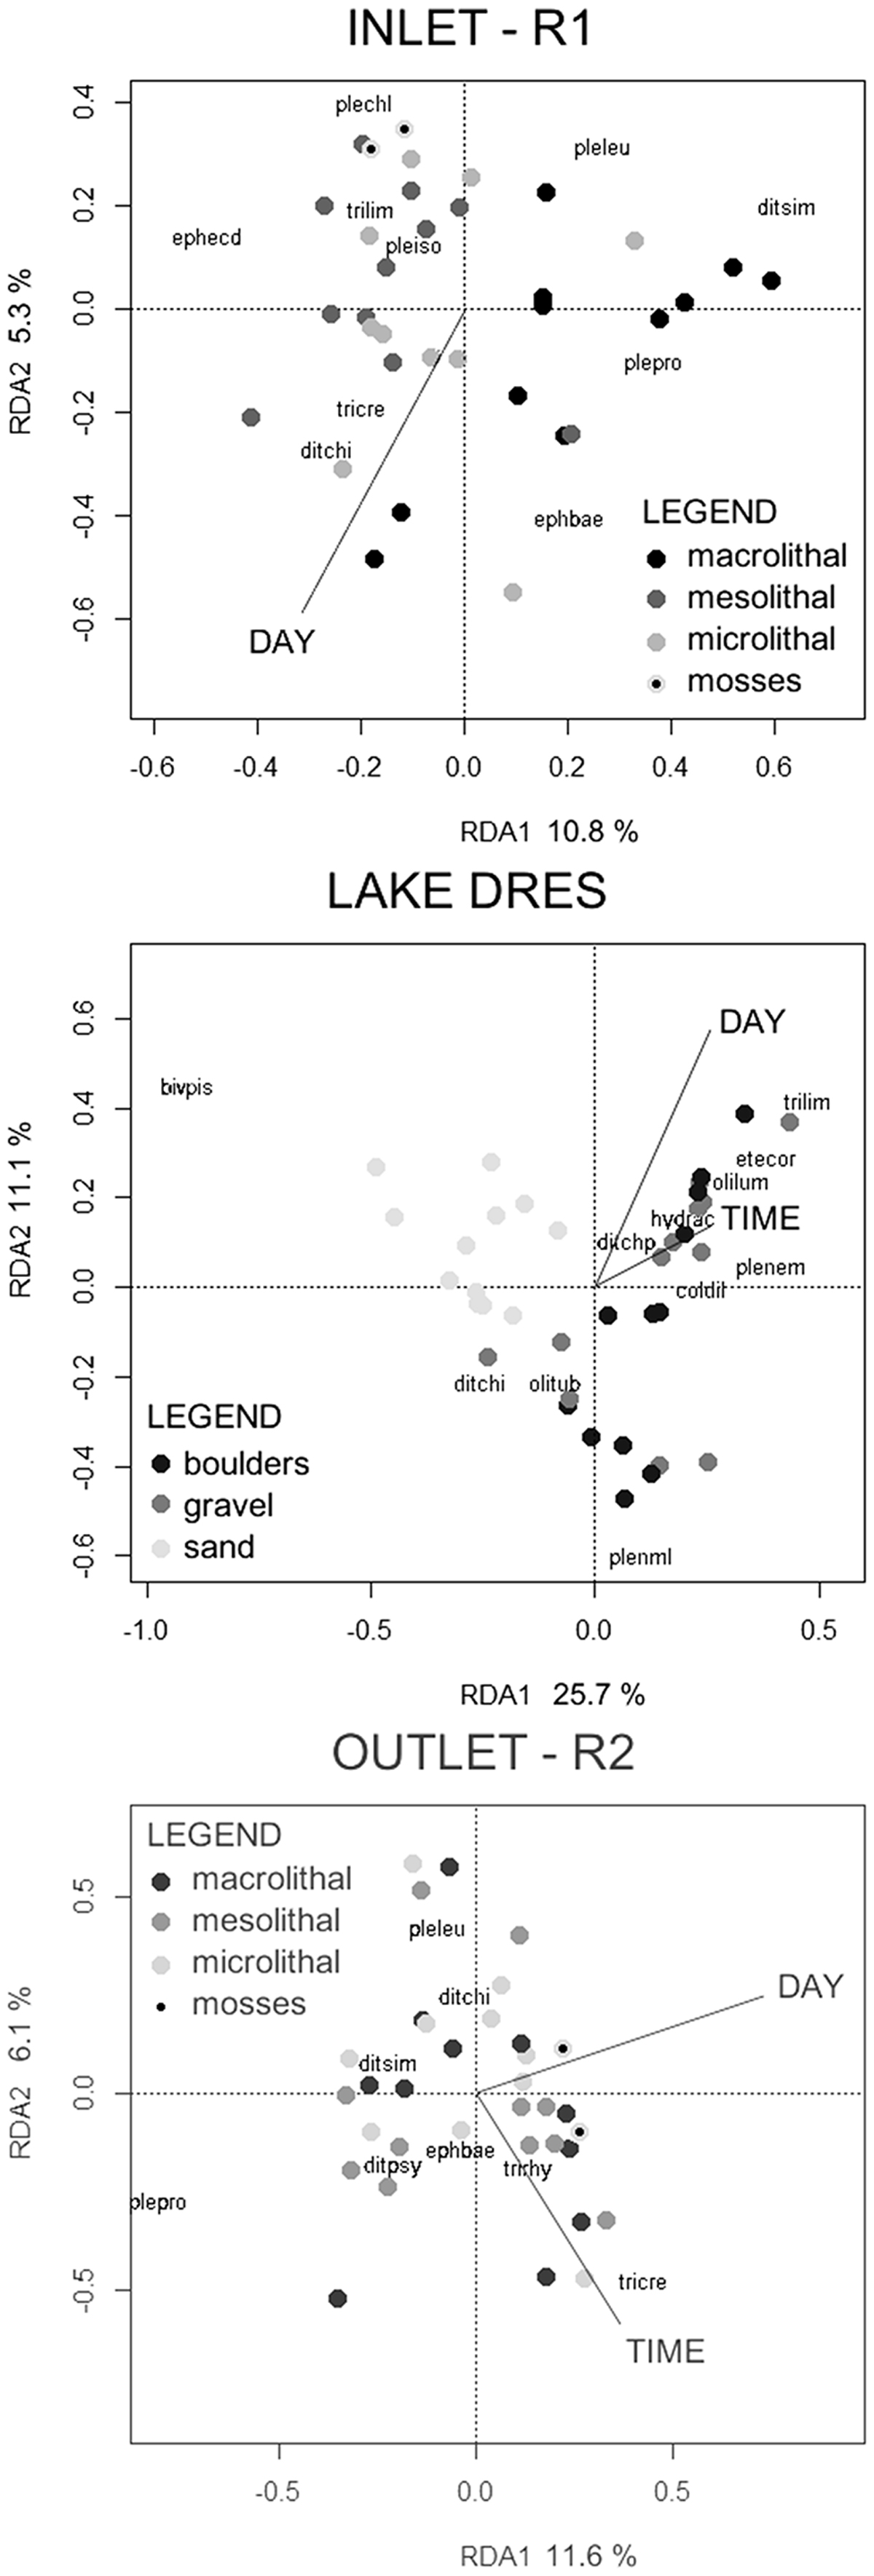
Fig. 2
Download original image
RDA triplots ordinating the macroinvertebrate samples from Lake Dres, its inlet (R1) and its outlet (R2). Percent values reported along with the RDA axes 1 and 2 indicate the explained proportion of total variance. Black vectors indicate significant explanatory variables retained by the backward selection in each sampling site; most representative macroinvertebrate groups are reported in the diagram with their abbreviated name (abbreviations listed in Tab. 1).
Current usage metrics show cumulative count of Article Views (full-text article views including HTML views, PDF and ePub downloads, according to the available data) and Abstracts Views on Vision4Press platform.
Data correspond to usage on the plateform after 2015. The current usage metrics is available 48-96 hours after online publication and is updated daily on week days.
Initial download of the metrics may take a while.