| Issue |
Knowl. Manag. Aquat. Ecosyst.
Number 424, 2023
Anthropogenic impact on freshwater habitats, communities and ecosystem functioning
|
|
|---|---|---|
| Article Number | 27 | |
| Number of page(s) | 12 | |
| DOI | https://doi.org/10.1051/kmae/2023023 | |
| Published online | 11 December 2023 | |
Research Paper
An alarming picture of larval fish assemblages entrained into the cooling system of the Kozienice Power Plant (Poland) revealed by DNA metabarcoding
1
Mazanów Fish Farm, Mazanów 8A, 24-340 Józefów nad Wisłą, Poland
2
Ichthyological Research and Expertise Laboratory PEBI Ltd., ul. Lea 236/9, 30-133 Kraków, Poland
3
Institute of Nature Conservation, Polish Academy of Sciences, Al. Mickiewicza 33, 31-120 Kraków, Poland
4
Biobank Lab, Department of Oncobiology and Epigenetics, Faculty of Biology and Environmental Protection, University of Lodz, ul. Pomorska 139, 90-235 Lodz, Poland
5
Society for the Earth, ul. Leszczyńskiej 7, 32-100 Oświęcim, Poland
* Corresponding author: This email address is being protected from spambots. You need JavaScript enabled to view it.
Received:
29
June
2023
Accepted:
10
November
2023
Abstract
The annual entrainment of early life history stages of fishes (ELH) into the cooling system of the largest power plant in the Vistula River basin was assessed using passive capture techniques and DNA metabarcoding. Hydrological and thermal conditions during the 2022 breeding season were also analyzed. A total of 5,011 ELH individuals identified to four families and 23 species were recorded. ELH densities upstream of the power plant were an order of magnitude higher than they were downstream. Along with the phenology of occurrence and species composition of drift, this indicated very high (probably close to 100%) ELH mortality during passage through the cooling system. Taking into account low water discharge at constantly high water intake during the season, the absolute estimate of ELH individuals entrained into the cooling system was > 103 × 106. The power plant entrains a notable proportion of one-quarter to one-half of the total ELH drifting by, especially during low-flow periods. Together with the very high abundance of two invasive Ponto-Caspian gobies, the magnitude of the entrainment of ELH into the Kozienice Power Plant presents a truly alarming picture.
Key words: Early life history / fish mortality / large rivers / once-through cooling system / Vistula River
© M. Nowak et al., Published by EDP Sciences 2023
 This is an Open Access article distributed under the terms of the Creative Commons Attribution License CC-BY-ND (https://creativecommons.org/licenses/by-nd/4.0/), which permits unrestricted use, distribution, and reproduction in any medium, provided the original work is properly cited. If you remix, transform, or build upon the material, you may not distribute the modified material.
1 Introduction
Early life history stages of fishes (ELH) are the most vulnerable to any disruptions in aquatic ecosystems, and the highest mortality occurs in this period (Kamler, 1992). ELH usually disperse by drifting with river currents. This phenomenon ensures they find suitable nursery habitats that include the availability of a proper-sized food items, current speeds, and water temperature and avoid overcrowding, competition, and predation in spawning grounds (Pavlov, 1994; Schiemer et al., 2003; Nunn et al., 2012; Lechner et al., 2016). Drift facilitates recolonization and gene flow among subpopulations (Lechner et al., 2016; Nagel et al., 2021). Passive participation in drift makes ELH particularly vulnerable to a number of anthropogenic pressures, including alterations in riverbed morphology resulting in the loss of shallow inshore habitats (Pander et al., 2017), the disruption of longitudinal connectivity (Pavlov et al., 2020), and siltation of coarse bottom substrates from restricted water velocities stemming from damming (Nagel et al., 2020). Anthropogenic pressure also includes entrainment into various water-intake structures, e.g., flow-through cooling systems of power plants (Ehrler et al., 2002; Newbold and Iovanna, 2007; for discussion see Barnthouse, 2013) resulting in considerable loses of drifting newly hatched larvae and fry.
Numerous studies on fish entrainment into power plant cooling systems have been conducted for several decades, mainly in the US where the problem has received the most attention (Sierra Club, 2011; Union of Concerned Scientist, 2011). Figures from the US indicate that thermal power plants in that country draw approximately 378 × 109 m3 of water annually for cooling purposes (Riverkeeper, 2022). On the Mississippi, Missouri, Ohio, and Hudson rivers there are as many as 83 power plants (Sierra Club, 2011). The problem has also been recognized in European countries such as the UK, Sweden, and Germany (Carter and Reader, 2000; Turnpenny and Taylor, 2000; Greenwood, 2007; Thielen et al., 2007; Bryhn et al., 2013). The most notable examples of the problem are: the Calvert Cliffs Nuclear Power Plant located on the Chesapeake Bay that draws approximately 75 m3 s−1 of water and entrains about 6 × 10⁹ ELH individuals per year (EA Engineering, 2008); the Darlington Nuclear Power Plant that draws about 45 m3 s−1 of water from Lake Ontario (Canada) resulting in the entrainment of 105 × 106 individuals per year (Patrick et al., 2021); the Muddy Run Power Plant on the Susquehanna River kills about 56 × 106 ELH per year (Snyder, 1975); and the Quad Cities Power Plant on the Mississippi River that entrains 10 to 14 × 106 ELH per year (Truchan, 1975). A study of the impact of a power plant on the Wabash River (US) found that it entrained 132 × 106 ELH individuals per year, which was estimated to be 23% of the river's total resources (Lewis and Seegert, 2000). Barnthouse (2013) and Mikolajczyk et al. (2022) provide more detailed reviews of the problem. Preliminary studies conducted in Poland (Mikołajczyk et al., 2020) estimated the entrainment of 64–234 × 106 ELH individuals (depending on the year) at the Kozienice Power Plant (KPP) situated on the Vistula River. Similar losses were recorded at two other power plants (Połaniec and Ostrołęka) located on the Vistula and Narew rivers, respectively (Mikołajczyk et al., 2022).
The present study is a continuation of research that has been conducted since 2018 on the impact three thermal power plants (Kozienice, Połaniec, and Ostrołęka) equipped with once-through cooling systems had on the Vistula and Narew river ecosystems (Mikołajczyk et al., 2020, 2022; Cebula et al., 2021). Our previous studies were preliminary, and ELH sampling was less frequent (fortnightly or even longer intervals), and the organisms were not identified to the species but quantified en masse, which is why in 2022 we sampled drifting ELH more frequently and identified them using molecular methods.
The aim of this research was to: (i) estimate the number of ELH entrained into the cooling systems of the Kozienice Power Plant during the 2022 reproductive season, (ii) assess the proportion of entrained ELH to the total number of ELH drifting past the power plant, and (iii) determine their species composition precisely using the DNA metabarcoding approach.
2 Material and methods
2.1 Study area
The Kozienice Power Plant (KPP) is the second largest power plant in Poland and has been in operation since 1972. It is capable of producing 4,016 MW (approximately 10% of the total power of Polish power plants). It is hard-coal-fueled and ten of the 11 blocks are cooled with a flow-through system (one unit works on a recirculating system). The water intake is located at Vistula river km 515 (measured from the river mouth to the Baltic Sea). According to its integrated permit (IPPC), KPP is authorized to take up to 100 m3 s−1. The mean annual discharge at the closest gauging stations are: 507 m3 s−1 in Dęblin (32 km upstream) and 561 m3 s−1 in Gusin located 37 km downstream of the power plant (Fig. 1). The Vistula River drainage area down to the Dęblin and Gusin stations covers 68,234 km2 and 81,786 km2, respectively (of a total of 194,494 km2). The KPP water intake is equipped with a set of grate screens that filter large debris and drum filters preventing smaller particles from entraining into the cooling system.
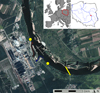 |
Fig. 1 Study area: circles represent points where stationary bank samples were taken, transverse line denotes transect of the tethered car ferry, gray arrow indicates river flow direction, and blue and red arrows point to the inlet and outlet of the power plant, respectively. |
2.2 Hydrological and thermal conditions
We used daily discharge and water temperature values measured at two stations closest to the study site (Dęblin and Gusin). The data are publicly available from the Polish Institute of Meteorology and Water Management − National Research Institute (http://danepubliczne.imgw.pl). Surface water temperatures upstream and downstream of the power plant were also measured at each sampling occasion using a portable multimeter HI 98129 (Hanna Instruments, Inc.). Data on daily water intake was obtained from the operator of the KPP.
2.3 ELH sampling
Sampling was performed ten times from late April to mid-July 2022, which covered the breeding and rearing season of most freshwater fishes of the Vistula River drainage area. Drifting ELH were caught using two stationary rectangular drift nets (0.50 × 0.25 m) with 2.2-m-long conical nylon nets (mesh size of 507 µm). Two nets were set perpendicularly to the river bank approximately 30 m apart and operated for 15 to 20 min, depending on number of debris suspended in the water (Tab. 1). On each occasion samples were taken 1 h and 3 h after dusk since both the literature (Jurajda, 1998; Reichard, 2002; Zitek et al., 2004) and our preliminary research conducted in 2018–2021 revealed that vast majority of drift takes place at nighttime with negligible daytime numbers of drifting ELH. Two nets were placed 1.5–2.5 m from the bank as the very steep slope of the rip-rap bank prevented their installation any farther. Samples were taken approximately 300 m upstream of the water intake (51°39′53.66′′N, 21°28′25.28′′E) and at the mouth of the 400-m-long outlet channel to the Vistula River (51°40′12.09′′N, 21°27′57.72′′E) (Fig. 1). In the field each sample containing both ELH and large number of debris was preserved in 95% ethanol. In the laboratory ELH were separated from the samples and stored in 95% ethanol at 4 °C. At every sampling occasion water velocity was measured with a flowmeter (model 2030R, General Oceanics, Inc.) placed at the center of each drift net.
In addition to the inshore samples, on the night of 3–4 July 2022, a series of samples covering the whole width of the Vistula River was taken. Drift nets (the same as used near the riverbank) were set from a small tethered car ferry operating 700 m upstream of the inshore sampling station. During sampling, the river width was approximately 185 m (corresponding to extremely low discharge at the Dęblin station: 178 m3 s−1; the lowest discharge observed ever at that gauging station was 114 m3 s−1 recorded in 1981), and ELH were collected from 11 points distributed 15 m apart. At points with water depth < 1.5 m only one drift net was deployed in the middle of the water column. If water depth exceeded 1.5 m one drift net was set at the bottom and the other just below the surface. Samples were processed in the same way as described above. Every sample was accompanied with a corresponding water velocity measurement. Concurrently with sampling from a ferry, regular bank samples were taken. Analogous sampling from the ferry took place in June and July 2021 during our preliminary research. Results of that sampling were used as a comparison for the present study (Mikołajczyk et al., 2022).
Sampling site characteristics and input data used to estimate entrainment.
2.4 Molecular analyses
Preserved ELH were separated from samples under a stereomicroscope, counted, and stored in 95% ethanol. They were classified into size-classes and only smaller pieces of the individuals longer than the rest of the fish were cut and processed further. This permitted the whole samples to be homogenous regarding the size of the individuals. Then, whole ELH samples (including all the specimens altogether) were placed in lysis buffer, homogenized, and DNA was extracted using DNeasy PowerSoil Pro Kit (Qiagen). After quality checks, the samples were normalized according to the DNA concentration and the number of specimens in a given sample. A total of 27 samples were prepared for new generation sequencing (NGS). For each sample and 196: ‘16S’ rRNA amplicon libraries were prepared and human 16s rRNA blocker was added. Positive control contained known concentrations of 38 fish species known to occur in the study area (obtained from tissue samples from the reference collection of M.N. and T.M.). The correctness of the libraries was assessed with electrophoresis, and their molarity was checked with qPCR. The libraries were sequenced with Illumina MiSeq (paired readings 2 × 250 bp).
Raw base call (BCL) files from an Illumina MiSeq device were demultiplexed with bcl2fastq v2.19.0.316 with default settings. Data quality control was performed using FastQC v0.11.9. Trim Galore v0.6.7 with a paired option that removed the adapters sequences. To remove low quality reads, the data was denoised using the DADA2 algorithm (Callahan et al., 2016) included in QIIME2 software v2022.2 (Bolyen et al., 2019).The DADA2 algorithm merged paired sequences and removed chimeric or deficient sequencing data. Sequences were taxonomically assigned using the built-in QIIME2 VSEARCH algorithm (Rognes et al., 2016) where a custom database was used as the reference. The custom database was constructed with reference sequences from NCBI (downloading mitochondrial genome sequences or at least 1400 bp sequences if mitochondrial genome sequences were unavailable) and sequences obtained by Sanger sequencing (reference collection of M.N. and T.M.). The ASVs were assembled based on 97% sequence similarity. All QIIME2 analyses were performed with a custom Python library. The abundance of a given species was determined by multiplying the proportion of respective sequences by the total number of individuals in the sample.
2.5 Data analyses and entrainment estimation
ELH density (ind. m−3) was calculated for each sample. ELH density in the river cross-section was estimated based on the local polynomial interpolation (LPI) algorithm. Computations were performed in an ArcGis environment with the LPI tool from the Geostatystical Analyst package. This method interpolates values from given data points by fitting many polynomials, each within specified overlapping neighborhoods (Schaum, 2008). LPI permitted the estimation of the mean density of ELH in the flux derived by the power plant. Then, to estimate representativeness of the bank sample (z), mean ELH density in the inlet flux was divided by the ELH density from the bank sample (z = nflux / nbank).
To assess ELH entrainment, we assumed that each of our sampling dates represented drift for a particular week. Daily data on water intake by the power plant were averaged over consecutive weeks (Tab. 1). Our preliminary research conducted in 2018 and 2020 revealed that the intensity of drift remained relatively constant throughout the night and was notably higher than during the daytime. For this reason, we assumed that entrainment occurred throughout the night, and we omitted daytime drift. The total number of ELH of a ith species entrained into the cooling system in a jth month was estimated as:

where: ni,p − density (ind. m−3) of given ELH, Qint,p − mean water intake by the power plant (m3 s−1), tn,p − mean duration of the night (s), nn,p − number of nights, and zp − representativeness of the stationary bank sample in relation to river discharge in a sampling period (week) p.
This estimation depends upon a number of assumptions. First of all, we averaged water intake by the power plant over consecutive weeks (Tab. 1). Secondly, as shown by our investigations on the lateral distribution of ELH, stationary bank samples represented the average density of ELH in diverted influx to various degrees, most probably related to river discharge. In order to deal partially with these uncertainties, we estimated minimum and maximum ELH entrainment according to different levels of zp as informed by the lateral distribution samplings performed in 2021 and 2022. Based upon these data, zp was regressed against QDęblin, and a simple point estimator of ELH entrainment was calculated with zp varying proportionally to the river discharge.
3 Results
3.1 Hydrological and thermal conditions
During the course of our study the discharge gradually decreased from 503 m3 s−1 at the end of April to 178 m3 s−1 at the beginning of July (Fig. 2). Meanwhile, KPP intake varied from 35.0 to 88.2 m3 s−1 (mean ± S.D. = 61.1 ± 11.1 m3 s−1) and averaged from 51.6 up to 72.5 m3 s−1 over consecutive weeks (Tab. 1; values calculated with daily intakes reported by the power plant). KPP diverted 8.5–51.7% (on average 23.6% ± 9.6%) of the river discharge recorded at the nearby Dęblin gauging station. The inundation floodplain was flooded for the last time on 20 April and from then until the end of the reproduction season the water level did not break the banks (Fig. 2). Starting from mid-May discharge was very low, at least 200 m3 s−1 lower than the 1981–2021 average (Fig. 2). Water temperature in front of the power plant gradually increased from 12.3 °C in late-April up to 26.7 °C at the end of June and slightly decreased afterward. In June and July, the temperature was approximately 1–5 °C higher than the 1981–2021 average (Fig. 3). Downstream of the power plant (at the confluence of the cooling water outlet channel with the river) the water temperature was 5.1–8.3 °C higher than upstream, reaching a maximum of 31.8 °C at the end of June (Fig. 3).
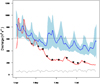 |
Fig. 2 Hydrological conditions at the Dęblin station during the 2022 season (red line) in comparison to the 1981–2021 period (mean ± 95% C.I.; blue) and water intake by the Kozienice Power Plant (gray line). Sampling occasions are marked with asterisks. Dashed horizontal line denotes discharge at which the flooding of the inundation floodplain begins. |
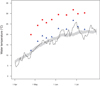 |
Fig. 3 Water temperature upstream (blue) and downstream of the Kozienice Power Plant. (red; direct measurements at sampling dates) and at the Dęblin gauging station in 2022 (black) compared to the 1981–2021 period (mean ± 95% C.I.; gray). |
3.2 ELH assemblage composition
A total of 5,011 ELH individuals were sampled, including 4,832 individuals collected upstream of the inlet, 40 individuals below the outlet from the power plant, and 139 individuals caught from the tethered ferry (single night of 3–4 July). The quality of the readings of the samples after demultiplexing was found to be sufficient. Therefore, further analyses were undertaken using QIIME2 software. All but one sample had a high number of readings after DADA2 analysis. Sequencing 27 libraries generated 926,756 reads on the Illumina MiSeq platform. After trimming, merging, and quality filtering (Q > 30), a total of 721,148 (78.32%) paired-end reads remained in the analysis (Appendix 1), which clustered into 275 amplicon sequence variants (ASVs). Altogether 721,101 reads (99.9%) and 264 ASVs (94.5%) were assigned to the species level. The ELH collected belonged to four families and 23 species (Tab. 2). Two invasive Ponto-Caspian gobies, Proterorhinus semilunaris and Neogobius fluviatilis, were the most dominant species overall (67.28% and 22.95% of all ELH, respectively), upstream of the power plant intake (69.11% and 21.03%), and at the heated outlet (39.67% and 54.97%). In the heated water only four other species were recorded: Abramis brama (3.95%), Gobio gobio (0.97%), Alburnus alburnus (0.38%), and Sander lucioperca (0.06%). Upstream of the power plant intake 16 species other than gobies were caught; Leuciscus aspius (3.49%) and Rhodeus amarus (3.03%) were the most abundant. During the sampling undertaken from the tethered ferry, seven species were recorded apart from P. semilunaris and N. fluviatilis. The most abundant was R. amarus (5.38%) (Tab. 2).
Estimates of ELH densities drifting in the Vistula River upstream and downstream of the Kozienice Power Plant and total numbers of ELH entrained into its cooling system in spring and summer 2022 (minimum, maximum, and mean estimates based upon various representativeness of stationary bank samples).
3.3 Phenology
In the natural thermal regime upstream of the power plant the overall density of ELH was lowest at the end of April (0.023 ind. m−3), increased gradually toward early June (peak value > 11 ind. m−3), and decreased until mid-July (0.690 ind. m−3). Leuciscus aspius was the earliest spawner as its ELH were recorded as early as at the end of April at a water temperature of 12.3 °C. Its ELH were recorded continuously for one month (26 May at 18.8 °C) with peak abundance at the beginning of May at 16.7 °C (0.671 ind. m−3). Neogobius fluviatilis was recorded for the first time on 12 May with very low density (< 0.0001 ind. m−3), then again two weeks later (< 0.001 ind. m−3). From that date, N. fluviatilis was continuously present in samples until the last expedition with peak abundance on June 27 at 26.7 °C (2.348 ind. m−3). The second Ponto-Caspian goby, P. semilunaris, started to occur in mid-May at 18.3 °C and ended on 4 July at 23.7 °C. Its abundance was highest in early June (9.415 ind. m−3). The latest spawner tended to be Scardinius erythrophthalmus, which was recorded for the first time as late as 4 July. Three species were present until the last sampling (July 14): Alburnus alburnus, N. fluviatilis, and R. amarus. The lowest species richness was recorded on April 25 (only two species), whereas the highest were on 18 May and 17 June (in both cases ten species) (Fig. 4).
In the heated water below the power plant only six species (1–3 species per sample) were recorded. Both neogobiids were present in the samples from late April (water temperature 19.9 °C, which was 7.6 °C higher than in the natural regime upstream of the power plant). Proterorhinus semilunaris appeared for the last time in the early June (29.5 °C), whereas N. fluviatilis occurred in the samples until the end of June (31.8 °C). No ELH were recorded in the heated water in July. Sander lucioperca (0.0003 ind. m−3) was recorded only on 5 May. Abramis brama appeared in mid-May and mid-June (0.053 and 0.020 ind. m−3, respectively). Gobio gobio was recorded only on 5 June (0.018 ind. m−3) and A. alburnus only on 27 June (0.004 ind. m−3) (Fig. 4).
 |
Fig. 4 ELH densities (ind. m−3) upstream and downstream of the Kozienice Power Plant. Note different scales for two neogobiid and all other species. |
3.4 Lateral distribution of ELH and entrainment rate
In summer 2022, ELH density was quite homogenous across the riverbed (Fig. 5). The highest values were recorded 31 m from the right bank (0.451 ind. m−3) and the lowest 60 m from that bank (0.074 ind. m−3). Samples were taken from the mid-water column because of the low water depth at both points (Fig. 5). Average ELH density in the whole cross-section was 0.424 ind. m−3, which was an order of magnitude lower than in the samples taken simultaneously from the bank (3.089 ind. m−3). The latter sample was included in the local polynomial interpolation (LPI), which resulted in an average density of ELH in the part of the discharge taken by the power plant estimation of 0.594 ind. m−3. Taking into account the high intake (69 m3 s−1) in relation to low discharge (178 m3 s−1), approximately 47.6% of the total number of ELH drifting by the power plant was entrained. Analogous samplings undertaken in June and July 2021 at much higher discharge indicated a lower entrainment rate (24.6 and 33.8% at 392 and 279 m3 s−1, respectively) that clearly suggested an inverse relationship between these two variables.
 |
Fig. 5 Local polynomial interpolation of lateral ELH densities distribution (ind. m−3) upstream of the Kozienice Power Plant at night on 3–4 July 2022. Dashed area represents estimated part of the discharge taken by the power plant. River discharge at Dęblin gauging station was 178 m3 s−1, and the power plant derived 69 m3 s−1. |
3.5 Entrainment estimation
Based on the lateral distribution of ELH in the cross-section, it was found that ELH densities sampled corresponded to approximately 19.2–37.8% of the average ELH density in the intake flux. This variation was most probably related to differences in discharge, which was twofold higher during the 2021 sampling events), as higher discharge resulted in the more even lateral distribution of ELH. The quantity of ELH entrained into the cooling system of the KPP in spring and summer 2022 ranged from 76.6 × 10⁶ to 150.8 × 10⁶ individuals depending on the selected representativeness of the stationary bank sample (19.2% or 37.8%, respectively). If the representativeness was modeled in relation to the river discharge, an entrainment of 102.3 × 10⁶ ELH ind. was estimated (Tab. 2). The most abundant species were P. semilunaris (50.–98.9 × 10⁶ ind.), N. fluviatilis (17.6–34.6 × 10⁶ ind.), R. amarus (3.2–6.3 × 10⁶ ind.), and L. aspius (2.9–5.7 × 10⁶ ind.). Other species were entrained at much lower numbers (Tab. 2).
4 Discussion
The phrase “alarming picture” in the title of this paper refers to three main problems indicated by our study. First, the estimated absolute (> 102 × 106) and relative numbers of entrained ELH (> 47% of the total drift) seemed to be very high. This could have been mainly from (i) the extremely low river discharge in June and July 2022 (194–265 m3 s−1 in June, 178–198 m3 s−1 in July vs. the 1981–2021 average of 568 and 422 m3 s−1, respectively) that resulted in very high ELH densities and (ii) the relatively high water intake by the power plant (up to 51.7% in the early July). Obviously, our estimates depended on a number of assumptions described in preceding sections of this article, but we consider them to be rather conservative. For example, the daytime portion of drift was omitted in the present estimates; however, our studies performed in 2018–2019 indicated that diurnal drift constituted 0–13%, but in certain instances it was as much as 72% of nocturnal ELH densities (Mikołajczyk et al., 2020). Moreover, our sampling ended in mid-July when ELH were still drifting. Most probably their drift continued until the end of July or even early August, and the entrainment of this part of total ELH drift was omitted in our estimates. Further, we do not know how KPP water intake varied over 24-h periods. If the diverted discharge was notably lower at night than during the day, the estimated number of entrained ELH would be proportionally lower.
Taking into account the very low densities, species composition, and timing of the appearance of ELH in the heated water vs. in natural conditions upstream of the power plant, we assumed complete (or close to 100%) mortality of ELH entrained into the cooling system. Unfortunately, we did not have access to the intake or outlet channels, so we were restricted to sampling the Vistula River as close as possible to the cooling system inlet of the power plant. The ELH densities downstream of the outlet were an order of magnitude lower than upstream of the power plant, and only six out of 23 species were recorded there. Moreover, particular species drifted earlier downstream than upstream of the power plant, which clearly indicated a mismatch between their presence/absence on both sites. This was not surprising assuming that these ELH were not survivors of the cooling system, but rather they had hatched in the outlet channel. The elevated thermal regime in the outlet, where the water temperature measured at its confluence with the Vistula River was several degrees higher, resulted in a shift in the phenology of reproduction, which is a well-documented phenomenon (e.g., Van der Kraak and Pankhrust, 1996; Pauly and Liang, 2022). Various levels of mortality from entrainment, from very low (< 10%) up to 100% are reported in the literature (EPRI, 2010 and citations therein). Survival rates depend heavily upon the technical aspects of cooling systems, including the temperature of the discharge water, the type of the mechanical filters, and the presence or absence of pumping (EPRI, 2010 and citations therein).
The second aspect of the alarming picture in the title refers to the high abundance of the invasive Ponto-Caspian gobies P. semilunaris and N. fluviatilis found during the course of this study. The vast majority of the entrained drift was of these two species (88.3 of 102 × 106 ind.). These two species, along with their relative Neogobius gymnotrachelus (not recorded in the present study), have colonized the middle Vistula River relatively recently (1990s and early 2000s) and are spreading both upstream and downstream (Grabowska et al., 2010). In our opinion, however, such a prevalence of Ponto-Caspian gobies in drift should not be considered typical of the middle Vistula River and most probably resulted from a combination of unusual circumstances. Hydrological conditions recorded in 2022 were favorable for Ponto-Caspian gobies, which are speleophils that do not require any special breeding substrate. Long periods of low discharge with flow concentrated in the riverbed restricted the reproduction of phytophilous or phyto-litophilous species, which included most of the native cyprinids that dominated adult fish assemblages (Supplement 2). It remains an open question whether such a high abundance of neogobiids will become common considering anticipated climate change that will result in rising water temperatures and prolonged droughts. Only a long-term sampling project can provide enough data to answer this question definitively. Nonetheless, neogobiid species are among the most successful invasive species in Central and Western Europe, and drift appears to be one of the key features permitting them to disperse and colonize new territories (Janáč et al., 2013).
The third alarm was the elevated water temperature downstream of the power plant. During the course of our study, water temperature was measured only a few meters downstream of the confluence of outlet channel and the Vistula River. The values recorded were surprisingly high (peaking at 31.8 °C). The thermal pollution the KPP caused was investigated in detail in 2019 (Cebula et al., 2021). At a distance of 2 km from the outlet, the water temperature was elevated by 2.9–3.2 °C, while at a distance of 5.3 km it was still 2.7–2.8 °C higher than upstream of the power plant. The width of the heated flux ranged from approximately 30 to 80% of the river width, depending on the riverbed configuration (e.g., presence of point bars) (Cebula et al., 2021). Additionally, over the past 40 yr the mean annual water temperature in the Vistula River has been rising at a rate of 0.007–0.043 °C year−1 according to Cebula et al. (2021) and 0.011–0.060 °C year−1 as estimated by Ptak et al. (2022). This problem will become more acute in coming decades, as projected climate change further increases the mean annual water temperature by 0.7–1.0 °C (under scenario RCP 4.5) or 1.9–2.2 °C (RCP 8.5) by the end of this century (M.N. and Ł.M., unpublished data). A serious concern arises that the additional heating of the Vistula's waters by power plants (of which KPP plays the leading role) could cause the upper thermal limits of some native species to be exceeded thus creating unfavorable conditions for them. The thermal pollution of rivers worldwide is receiving growing attention (Raptis et al., 2016; Liu et al., 2020).
There are two primary causes of fish mortality in power plant cooling systems. The first is the entrainment of drifting eggs, larvae, and fry, which, because of their size, are unable to actively resist river currents (therefore the are known collectively as ichthyoplankton). This problem is the subject of this paper. The second, equally serious problem is the impingement of larger fish on the grids or screens that filter the river water from all sorts of larger debris (e.g., leaves, branches, garbage). This process occurs throughout the year. Losses in ichthyofauna caused by the impingement of fish are counted in tens to hundreds of tons annually as exemplified by the case of a single power plant in the UK (2,400 MW) that caused the death of 56 × 106 fishes weighing 258 tons (Greenwood, 2007), while another plant was responsible for the loss of 66 tons of fishes (Turnpenny and Taylor, 2000). Similar alarming data is reported from the US where, according to Kelso and Milburn (1979), in the Great Lakes basin, 100 × 106 fishes of a total weight of 7,500 tons were killed annually at the intake filter screens of the 89 power plants that were studied. This represented 25% of the weight of all commercially harvested fishes from these basins. Unfortunately, for financial and technical reasons, the problem of the impingement of larger fishes in the KPP has not yet been studied.
Because of the obvious shortcomings of our study, we refrained from hypothesizing possible population-level effects of the entrainment of the estimated amounts of ELH. We also avoided using traditional measures such as adult equivalent loss or fecundity hindcasting (Steinbeck et al., 2007), since White et al. (2010) clearly showed their inadequacy. As recommended by the latter authors, modeling demographic effects on particular population(s) is needed to adequately assess the consequences of ELH entrainment. An extensive review by Barnthouse (2013) concluded that the impact of the entrainment of ELH into cooling systems of power plants is of minor concern in comparison to other anthropogenic pressures, namely overfishing, habitat degradation, and water pollution. However, Boreman and Goodyear (1988) estimated that as much as 79% of total recruitment could be killed in the cooling systems of five power plants on the Hudson River (US). The main line of argument was that, owing to the great natural mortality of ELH, the vast majority of individuals killed in the cooling systems would have died anyway (Barnthouse 2013). Recently, Foley et al. (2015) proposed a novel approach for assessing the condition of ELH using the RNA:DNA ratio, which could possibly permit estimating the probability of their survival if they were not entrained by water intake. However, to the best of our knowledge, no study yet has tested this method in natural conditions. The impact of mortality from entrainment is the highest for populations already extirpated by other factors and the lowest for species/populations in which there is a strong density-dependent mortality of ELH (White et al., 2010). It is often considered that increased mortality (e.g., from entrainment) at ELH stages could result in the higher survival of the remaining part of the population by relaxing predatory pressure or intrapopulation competition for food (Rose et al., 2001). However, laboratory studies showed that easing resource limitation (by proportionally excessive feeding) led mainly to increased individual body growth, while it only affects mortality rates to a lesser extent (Hazlerigg et al., 2012). In this regard it is important to note at what point in the life history excessive mortality occurs (White et al., 2010). For example, because of their endogenous feeding on yolk sacs, early larvae might exhibit less density-dependent compensation than do postlarvae and early juveniles that feed exogenously and thus face resource limitation (Cowan et al., 2000). In an analysis with a general model that considered density-dependent mortality, Newbold and Iovanna (2007) concluded that ten of 15 populations studied decreased by less than 1% because of entrainment, two suffered an impact of 1–3%, and three declined by 20–80%. Langangen et al. (2022) simulated numerous scenarios including various levels of natural mortality and additional mass mortality events (50% and 99%) at early life and concluded that such random kills could lead to notable decreases in adult populations. Moreover, even smaller but persistent changes in mortality rates could result in large differences in the numbers of adults (Houde, 1989).
It should not be overlooked that artificially induced high ELH mortality results in the interruption or severe depletion of the natural trophic chain, which does not occur in the case of natural mortality. The disruption of the trophic chain is compounded by the entrainment of a large number of invertebrates drifting along with ELH (massive drift of invertebrates was observed but not quantified during this study). Predation is the most important source of ELH mortality in natural systems (Bailey and Houde, 1989; Paradis et al., 1996; Gjøsæter et al., 2016). Disruption of the food web seems to be an unavoidable consequence of the disintegration of a considerable number of individuals in the cooling systems of power plants. However, estimating this effect was not within the scope of the present study.
In our view only a long-term study could answer most of the questions raised in this paper. Nonetheless, the possible entrainment of one-fourth to one-half of all the ELH drifting by the power plant for over a 50 yr period is indeed alarming. Taking into account climate factors, there is no doubt that hard-coal-fueled power plants should be replaced with more ecologically friendly power sources. Nevertheless, the entrainment and impingement problems are not related to the energy source but to the cooling technology of power plants. Thus, the main aim should be to replace once-through cooling systems with recirculating systems, which require 100 times less water. We are aware, however, that such power plant conversions require time and considerable financial outlays. Meanwhile, the only way to immediately reduce losses of ichthyofauna is to reduce power production at night during the fish breeding season (May–July), and thus reduce the intake of cooling water and the number of entrained ELH. To the best of our knowledge there are no other efficient measures preventing losses in drifting ELH from entrainment.
Supplementary material
Appendix 1. Analysis of Illumina MiSeq reads.
Appendix 2. Number of fish collected (ni) in the Middle Vistula River in the vicinity of the Kozienice Power Plant as revealed by electrofishing and beach seine surveys 2018–2021. RG – reproductive guild (Balon, 1975), HD – Habitat Directive Annex II or V, RL – national red list (Witkowski et al., 2009), and NP – national protection.
Access Supplementary MaterialAcknowledgments
This research was financed by European Climate Foundation. We would like to thank the crew of the tethered car ferry in Świerże Górne for loaning us the vessel and their invaluable assistance during the field work.
References
- Bailey KM, Houde ED. 1989. Predation on eggs and larvae of marine fishes and the recruitment problem. Adv Mar Biol 25: 1–83. [CrossRef] [Google Scholar]
- Balon EK. 1975. Reproductive guilds of fishes: A proposal and definition. J Fish Res Board Can 32: 821–864. [CrossRef] [Google Scholar]
- Barnthouse LW. 2013. Impacts of entrainment and impingement on fish populations: A review of the scientific evidence. Environ Sci Policy 31: 149–156. [CrossRef] [Google Scholar]
- Bolyen E, et al. 2019. Reproducible, interactive, scalable and extensible microbiome data science using QIIME 2. Nat Biotechnol 37: 852–857. [CrossRef] [PubMed] [Google Scholar]
- Boreman J, Goodyear CP 1988. Estimates of entrainment mortality for striped bass and other fish species inhabiting the Hudson River Estuary. Amer Fish Soc Mon 4: 152–160. [Google Scholar]
- Bryhn AC, Bergenius MAJ, Dimberg PH, Adill A. 2013. Biomass and number of fish impinged at a nuclear power plant by the Baltic Sea. Environ Monit Assess 185: 10073–10084. [CrossRef] [PubMed] [Google Scholar]
- Callahan BJ, McMurdie PJ, Rosen MJ, Han AW, Johnson AJ, Holmes SP. 2016. DAD A2: High-resolution sample inference from Illumina amplicon data. Nat Methods 13: 581–583. [CrossRef] [PubMed] [Google Scholar]
- Carter LK, Reader PJ. 2000. Patterns of drift and power station entrainment of 0+ fish in the River Trent, England. Fish Manag Ecol 7: 447–464. [CrossRef] [Google Scholar]
- Cebula M, Ciężak K, Mikołajczyk Ł, Mikołajczyk T, Nowak M, Skowronek D, Wawręty R, Żurek R. 2021. Wybrane aspekty środowiskowych skutków zrzutu wód pochłodniczych przez elektrownie termiczne z otwartym systemem chłodzenia Raport z badań terenowych przeprowadzonych w latach 2019 i 2020. TNZ, Oświęcim, 85 p. [Google Scholar]
- Cowan JH Jr, Rose KA, DeVries DR. 2000. Is density-dependent growth in young-of the-year fishes a question of critical weight? Rev Fish Biol Fish 10: 61–89. [CrossRef] [Google Scholar]
- EA Engineering, Science and Technology Inc. 2008. Entrainment characterization data report for Calvert Cliffs Nuclear Power Plant. Constelation Energy Final Report, June 2008. [Google Scholar]
- Ehrler CP, Steinbeck JR, Laman EA, Hedgepeth JB, Skalski JR, Mayer DL. 2002. A process for evaluating adverse environmental impacts by cooling-water system entrainment at a California power plant. Sci World J S1: 81–105. [CrossRef] [Google Scholar]
- EPRI. 2000. Review of Entrainment Survival Studies: 1970–2000. Palo Alto, CA. 1000757. [Google Scholar]
- Foley CJ, Bradley D, Höök TO. 2016. A review and assessment of the potential use of RNA: DNA ratios to assess the condition of entrained fish larvae. Ecol Indic 60: 346–357. [CrossRef] [Google Scholar]
- Gjøsæter H, Hallfredsson EH, Mikkelsen N, Bogstad B, Pedersen T. 2016. Predation on early life stages is decisive for year-class strength in the Barents Sea capelin (Mallotus villosus) stock. ICES J Mar Sci 73: 182–195. [CrossRef] [Google Scholar]
- Grabowska J, Kotusz J, Witkowski A. 2010. Alien invasive fish species in Polish waters: an overview. Folia Zool 59: 73–85. [CrossRef] [Google Scholar]
- Greenwood MFD. 2007. Fish mortality by impingement on the cooling-water intake screens of Britain's largest direct-cooled power station. Mar Pollut Bull 56: 723–739. [Google Scholar]
- Hazlerigg CR, Lorenzen K, Thorbek P, Wheeler JR, Tyler CR. 2012. Density-dependent processes in the life history of fishes: evidence from laboratory populations of zebrafish Danio rerio. PLoS One 7(5): e37550. [CrossRef] [PubMed] [Google Scholar]
- Houde ED. 1989. Subtleties and episodes in the early life of fishes. J Fish Biol 35: 29–38. [CrossRef] [Google Scholar]
- Janáč M, Šlepanský L, Valová Z, Jurajda P. 2013. Downstream drift of round goby (Neogobius melanostomus) and tubenose goby (Proterorhinus semilunaris) in their non-native area. Ecol Freshwat Fish 22: 430–438. [CrossRef] [Google Scholar]
- Jurajda P. 1998. Drift of larval and juvenile fishes, especially Rhodeus sericeus and Rutilus rutilus, in the River Morava (Danube basin). Arch Hydrobiol 141: 231–241. [CrossRef] [Google Scholar]
- Kamler E. 1992. Early life history of fish. London: Chapman and Hall, 267 p. [Google Scholar]
- Kelso JRM, Milburn GS. 1979. Entrainment and impingement of fish by power plants in the Great Lakes which use the once-through cooling process. J Great Lakes Res 5: 182–194. [CrossRef] [Google Scholar]
- Lewis RB, Seegert G. 2000. Entrainment and impingement studies at power plants on the Wabash River in Indiana. Environ Sci Pol 3: 303–312. [CrossRef] [Google Scholar]
- Liu S, Xie Z, Liu B, Wang Y, Gao J, Zeng Y, Xie J, Xie Z, Jia B, Qui P, Li R, Wang L, Chen S. 2020. Global river warming due to climate change and anthropogenic heat emission. Glob Planet Change 193: 103289. [CrossRef] [Google Scholar]
- Mikołajczyk T, Nowak M, Skowronek D, Mikołajczyk Ł, Wawręty R. 2020. Wpływ elektrowni termicznych na ichtiofaunę. Kraków-Oświęcim-Bystra: TNZ-PNWI, 47 p. [Google Scholar]
- Mikołajczyk T, Nowak M, Skowronek D, Mikołajczyk Ł, Wawręty R. 2022. Szacunkowe straty w ichtiofaunie Wisły oraz Narwi spowodowane zasysaniem larw ryb i wczesnych form narybkowych do systemów chłodzących Elektrowni Połaniec, Kozienice i Ostrołęka B. Oświęcim: TNZ, 86 p. [Google Scholar]
- Newbold SC, Iovanna R. 2007. Population level impacts of cooling water withdrawals on harvested fish stocks. Environ Sci Technol 41: 2108–2114. [CrossRef] [PubMed] [Google Scholar]
- Nunn AD, Tewson LH, Cowx IG. 2012. The foraging ecology of larval and juvenile fishes. Rev Fish Biol Fish 22: 377–408. [CrossRef] [Google Scholar]
- Pander J, Mueller M, Knott J, Egg L, Geist J. 2017. Is it worth the money? The functionality of engineered shallow stream banks as habitat for juvenile fishes in heavily modified water bodies. River Res Appl 33: 63–72. [CrossRef] [Google Scholar]
- Paradis AR, Pepin P, Brown JA. 1996. Vulnerability of fish eggs and larvae to predation: revoiew of the influence of the relative size of prey and predator. Can J Fish Aquat Sci 53: 1226–1235. [CrossRef] [Google Scholar]
- Patrick PH, Di Giuseppe M, Manolopoulos H, Tai M-K., Poulton JS, Wright J. 2021. Entrainment of fish eggs and larvae at an operating nuclear generating station using improved methodology. Lake Reserv Manag 37: 186–198. [CrossRef] [Google Scholar]
- Pauly D, Liang C. 2022. Temperature and the maturation of fish: a simple sine-wave model for predicting accelerated spring spawning. Environ Biol Fish 105: 1481–1487. [CrossRef] [Google Scholar]
- Pavlov DS. 1994. The downstream migration of young fishes in rivers: Mechanisms and distribution. Folia Zool 43: 193–208. [Google Scholar]
- Pavlov DS, Mikheev VN, Kostin VV. 2020. Migrations of young fish in regulated rivers: Effects of ecological filters. Inland Water Biol 13: 262–272. [CrossRef] [Google Scholar]
- Ptak M, Sojka M, Graf R, Choiński A, Zhu S, Nowak B. 2022. Warming Vistula River – the effects of climate and local conditions on water temperature in one of the largest rivers in Europe. J Hydrol Hydromech 70: 1–11. [Google Scholar]
- Raptis CE, van Vliet MTH, Pfister S. 2016. Global thermal pollution of rivers from thermoelectric power plants. Environ Res Lett 11: 10411. [Google Scholar]
- Reichard M, Jurajda P, Ondračková M. 2002. The effect of light intensity on the drift of young-of-the-year cyprinid fishes. J Fish Biol 61: 1063–1066. [Google Scholar]
- Riverkeeper. 2014. Power plant fish kills. Power plant's extreme water withdrawals kill staggering numerous of fish and deplete ecosystems. https://www.riverkeeper.org/campaigns/stop-polluters/power-plants/power-plant-fish-kills/ [Google Scholar]
- Rognes T, Flouri T, Nichols B, Quince C, Mahé F. 2016. VSEARCH: a versatile open source tool for metagenomics. PeerJ 4: e2584. [CrossRef] [PubMed] [Google Scholar]
- Rose KA, Cowan JH, Jr, Winemiller KO, Myers RA, Hilborn R. 2001. Compensatory density dependence in fish populations: importance, controversy, understanding and prognosis. Fish Fish 2: 293–327. [CrossRef] [Google Scholar]
- Schaum A. 2008. Principles of local polynomial interpolation. In: 2008 37th IEEE Applied Imagery Pattern Recognition Workshop. Washington, DC, USA, pp. 1–6. [Google Scholar]
- Schiemer F, Keckeis H, Kamler E. 2003. The early life history stages of riverine fish: ecophysiological and environmental bottlenecks. Comp Biochem Physiol Part A 133: 439–449. [Google Scholar]
- Sierra Club. 2011. Giant fish blenders: how power plants kill fish and damage our waterways. http://www.sierraclub.org/pressroom/media/2011/2011-08-fish-blenders.pdf [Google Scholar]
- Steinbeck J, Hedgepeth J, Raimondi P, Cailliet G, Mayer D. 2007. Assessing power plant cooling water intake system entrainment impacts. Consultant report prepared for California Energy Commission, http://www.energy.ca.gov/2007publications/CEC-700-2007-010/ [Google Scholar]
- Turnpenny AWH, Taylor CJL. 2000. An assessment of the effect of the Sizewell power station on fish population. Hydroecol Appl 12: 87–134. [CrossRef] [EDP Sciences] [Google Scholar]
- Van der Kraak FG, Pankhurst NW. 1996. Temperature effects of the reproductive performance of fish. In McDonald G, Wood CM, eds. Global Warming: implications for freshwater and Marine Fish. Cambridge University Press pp. 159–176. [Google Scholar]
- White JW, Nickols KJ, Clarke L, Larier JL. 2010. Larval entrainment in cooling water intakes: spatially explicit models reveal effects on benthic metapopulations and shortcomings of traditional assessments. Can J Fish Aquat Sci 67: 2014–2031. [CrossRef] [Google Scholar]
- Witkowski A, Kotusz J, Przybylski M. 2009. Stopień zagrożenia słodkowodnej ichtiofauny Polski: Czerwona lista minogów i ryb − stan 2009. Chrońmy Przyr Ojcz 65: 33–52. [Google Scholar]
- Zitek A, Schmutz S, Ploner A. 2004. Fish drift in a Danube sidearm-system: II. Seasonal and diurnal patterns. J Fish Biol 65: 1339–1357. [CrossRef] [Google Scholar]
Cite this article as: Nowak M, Mikołajczyk T, Mikołajczyk Ł, Janik-Superson K, Jeziorski S, Krawczyk D, Skowronek D, Wawręty R. 2023. An alarming picture of larval fish assemblages entrained into the cooling system of the Kozienice Power Plant (Poland) revealed by DNA metabarcoding. Knowl. Manag. Aquat. Ecosyst., 424, 27
All Tables
Estimates of ELH densities drifting in the Vistula River upstream and downstream of the Kozienice Power Plant and total numbers of ELH entrained into its cooling system in spring and summer 2022 (minimum, maximum, and mean estimates based upon various representativeness of stationary bank samples).
All Figures
|
Fig. 1 Study area: circles represent points where stationary bank samples were taken, transverse line denotes transect of the tethered car ferry, gray arrow indicates river flow direction, and blue and red arrows point to the inlet and outlet of the power plant, respectively. |
| In the text | |
|
Fig. 2 Hydrological conditions at the Dęblin station during the 2022 season (red line) in comparison to the 1981–2021 period (mean ± 95% C.I.; blue) and water intake by the Kozienice Power Plant (gray line). Sampling occasions are marked with asterisks. Dashed horizontal line denotes discharge at which the flooding of the inundation floodplain begins. |
| In the text | |
|
Fig. 3 Water temperature upstream (blue) and downstream of the Kozienice Power Plant. (red; direct measurements at sampling dates) and at the Dęblin gauging station in 2022 (black) compared to the 1981–2021 period (mean ± 95% C.I.; gray). |
| In the text | |
|
Fig. 4 ELH densities (ind. m−3) upstream and downstream of the Kozienice Power Plant. Note different scales for two neogobiid and all other species. |
| In the text | |
|
Fig. 5 Local polynomial interpolation of lateral ELH densities distribution (ind. m−3) upstream of the Kozienice Power Plant at night on 3–4 July 2022. Dashed area represents estimated part of the discharge taken by the power plant. River discharge at Dęblin gauging station was 178 m3 s−1, and the power plant derived 69 m3 s−1. |
| In the text | |
Current usage metrics show cumulative count of Article Views (full-text article views including HTML views, PDF and ePub downloads, according to the available data) and Abstracts Views on Vision4Press platform.
Data correspond to usage on the plateform after 2015. The current usage metrics is available 48-96 hours after online publication and is updated daily on week days.
Initial download of the metrics may take a while.