Fig. 2
Download original image
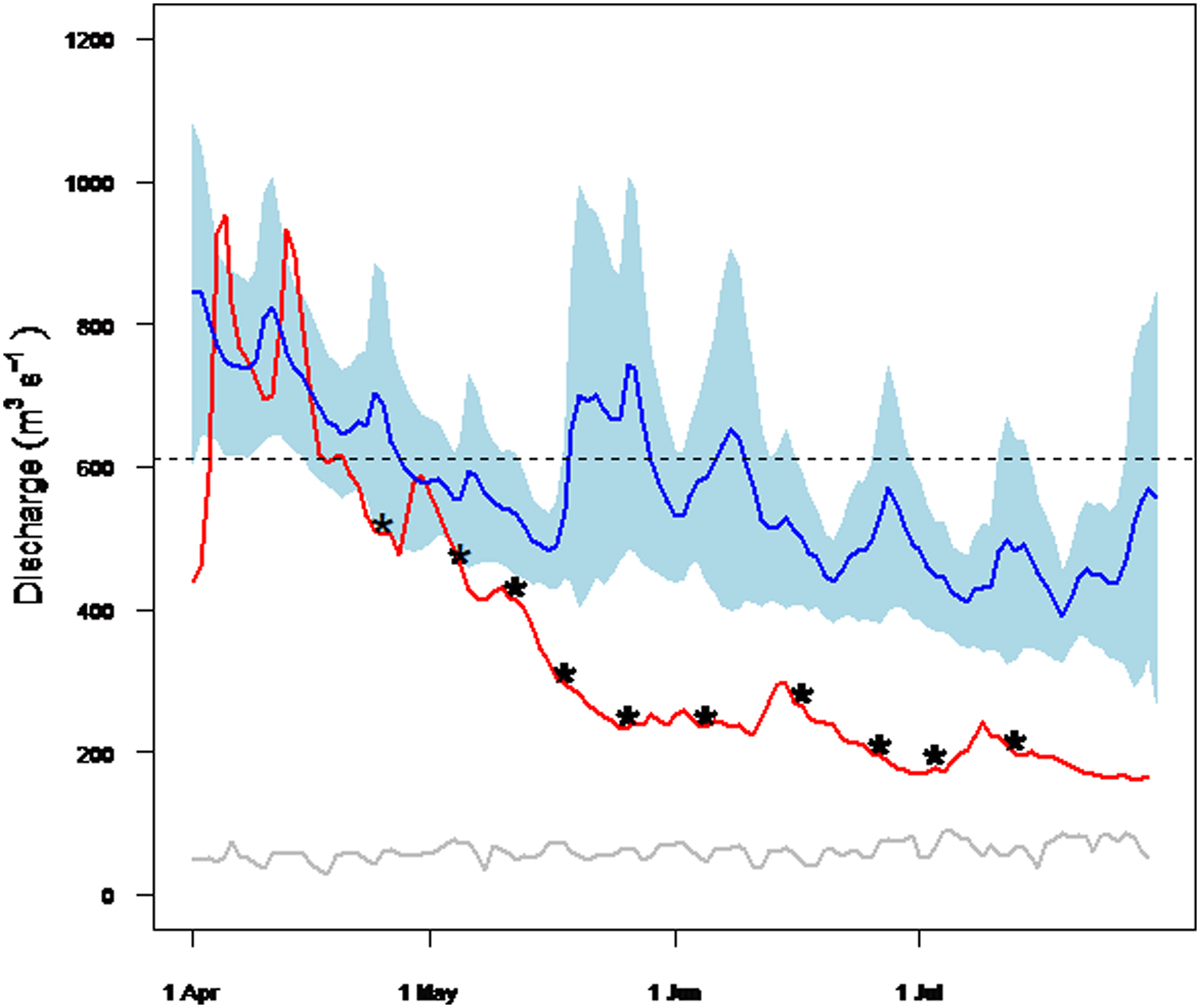
Hydrological conditions at the Dęblin station during the 2022 season (red line) in comparison to the 1981–2021 period (mean ± 95% C.I.; blue) and water intake by the Kozienice Power Plant (gray line). Sampling occasions are marked with asterisks. Dashed horizontal line denotes discharge at which the flooding of the inundation floodplain begins.
Current usage metrics show cumulative count of Article Views (full-text article views including HTML views, PDF and ePub downloads, according to the available data) and Abstracts Views on Vision4Press platform.
Data correspond to usage on the plateform after 2015. The current usage metrics is available 48-96 hours after online publication and is updated daily on week days.
Initial download of the metrics may take a while.