Fig. 5
Download original image
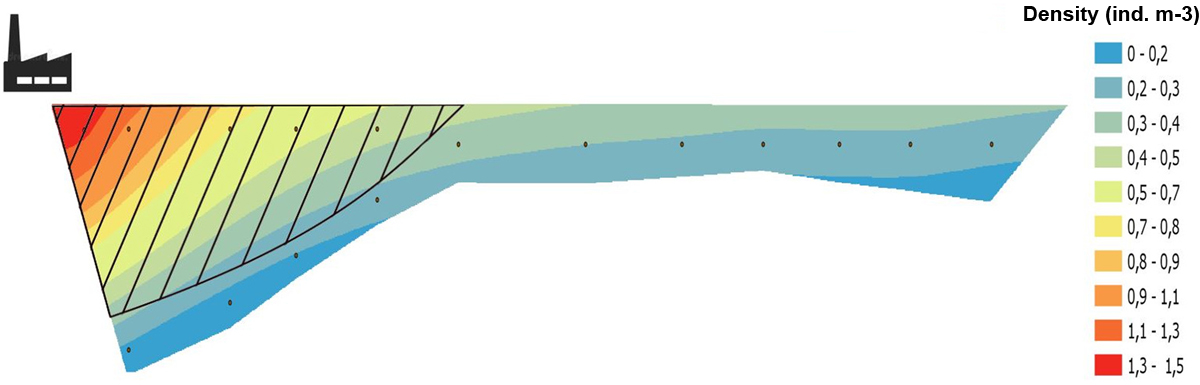
Local polynomial interpolation of lateral ELH densities distribution (ind. m−3) upstream of the Kozienice Power Plant at night on 3–4 July 2022. Dashed area represents estimated part of the discharge taken by the power plant. River discharge at Dęblin gauging station was 178 m3 s−1, and the power plant derived 69 m3 s−1.
Current usage metrics show cumulative count of Article Views (full-text article views including HTML views, PDF and ePub downloads, according to the available data) and Abstracts Views on Vision4Press platform.
Data correspond to usage on the plateform after 2015. The current usage metrics is available 48-96 hours after online publication and is updated daily on week days.
Initial download of the metrics may take a while.