| Issue |
Knowl. Manag. Aquat. Ecosyst.
Number 426, 2025
Riparian ecology and management
|
|
|---|---|---|
| Article Number | 15 | |
| Number of page(s) | 6 | |
| DOI | https://doi.org/10.1051/kmae/2025010 | |
| Published online | 21 May 2025 | |
Data Paper
IsoFresh: A global stable isotope database of freshwater food webs
1
Centre de Recherche sur la Biodiversité et l'Environnement (CRBE), Université de Toulouse, CNRS, IRD, Toulouse INP, Université Toulouse 3–Paul Sabatier (UT3), Toulouse, France
2
Fondation pour la Recherche sur la Biodiversité – Centre de Synthèse et d’Analyse sur la Biodiversité (FRB-CESAB), Montpellier, France
3
Conservation Science Partners, Inc., Truckee, CA, USA
4
German Centre for Integrative Biodiversity Research (iDiv) Halle-Jena-Leipzig, Leipzig, Germany
5
Department of Computer Science, Martin Luther University Halle-Wittenberg, Halle (Saale), Germany
6
Biology Department, Seattle University, Seattle, WA, United States
7
King County Water and Land Resources Division, Science and Technical Support Section, Seattle, Washington, USA
8
Scottish Centre for Ecology and the Natural Environment, School of Biodiversity, One Health and Veterinary Medicine, University of Glasgow, UK
9
Water@Leeds, School of Biology, Faculty of Biological Sciences, University of Leeds, Leeds, UK
10
South African Institute for Aquatic Biodiversity (SAIAB), Makhanda, South Africa
11
Te Kura Pūtaiao Koiora, Te Whare Wānanga o Waitaha | School of Biological Sciences, University of Canterbury, Private Bag 4800, Christchurch 8140, New Zealand
12
Faculty of Geoscience and Environment, University of Lausanne, Lausanne, Switzerland
13
Área de Biodiversidad y Conservación, Departamento de Biología y Geología, Física y Química Inorgánica, Universidad Rey Juan Carlos, Móstoles, Madrid, Spain
14
DECOD, INRAE, IFREMER, L’Institut Agro, Rennes, France
15
Freshwater Habitat Section, National Centre for Effectiveness Science, Fisheries and Oceans Canada, Moncton, New Brunswick, Canada
16
Department of Biology, University of Oxford, Oxford, UK
17
School of Aquatic and Fishery Sciences, University of Washington, Seattle, Washington, 98105, USA
* Corresponding authorS: This email address is being protected from spambots. You need JavaScript enabled to view it.
; This email address is being protected from spambots. You need JavaScript enabled to view it.
Received:
7
March
2025
Accepted:
16
April
2025
Abstract
Ecologists seek to understand the ways that human activities are altering the structures and processes that support biodiversity and nature's contributions to people. Food web research at the interface of community and ecosystem ecology is promising in this regard. An industry of studies has utilized stable isotopes in recent decades to rapidly characterize energy and material transfer among organisms in freshwater food webs. Nevertheless, these efforts have been somewhat siloed and mainly locally-based, and lack of a centralized database has limited efforts to tackle questions about food web change using isotopes at a global scale. Here we present IsoFresh, a freshwater food web database that contains species-level carbon (δ13C) and nitrogen (δ15N) stable isotope values for 15343 organisms, representing 1001 food webs and including > 1600 fish species and associated potential prey, from 65 countries around the globe. Our hope is that IsoFresh is used to explore fundamental and applied food web questions, contributing new knowledge about global environmental change so that human societies can better conserve and manage freshwater ecosystems along desirable future trajectories.
Key words: Stable isotope analyses / food web architecture / trophic interaction / trophic niche / fish / macroinvertebrates / human perturbations / freshwater ecosystems
© S. Boulêtreau et al., Published by EDP Sciences 2025
 This is an Open Access article distributed under the terms of the Creative Commons Attribution License CC-BY-ND (https://creativecommons.org/licenses/by-nd/4.0/), which permits unrestricted use, distribution, and reproduction in any medium, provided the original work is properly cited. If you remix, transform, or build upon the material, you may not distribute the modified material.
1 Introduction
Globalisation has led to conspicuous changes in biological diversity with profound impacts on ecosystem structure and function (Cardinale et al., 2012; Naeem et al., 2012). Yet, elucidating links between the structure of biodiversity and ecosystem functioning remains a fundamental challenge that is driven, in part, by the large disconnection between community and ecosystem ecology (Loreau, 2010). On the one hand, community ecologists often use macroecological approaches to describe global patterns of biodiversity, and grapple with the difficulty of translating how community changes may affect ecosystem processes. On the other, ecosystem ecologists investigate the interplay between ecosystem functions and a host of determinants (e.g. temperature, nutrient availability), yet persistently struggle to understanding how species contribute to ecosystem function and respond to changes. What progress has been made on establishing a connection between the structure of biodiversity and ecosystem functioning is largely limited to experimental settings or small-scale studies, predominantly in terrestrial ecosystems. New global initiatives are needed to better understand how ecosystem processes respond to changing biodiversity across broad scales, and how species and environments modulate these responses (Loreau, 2010; Burley et al., 2016; Gonzalez et al., 2020). Because they describe energy flow among species, food web approaches offer an opportunity to reconcile community and ecosystem ecology (Thompson et al., 2012). This is only possible due to a paradigm shift in the way in which food webs are studied. Traditional food web data, obtained using dietary observations (e.g. stomach contents) to document trophic interactions are problematic to assemble and interpret at global scales for a number of reasons including methodological variability. In addition, attaining time-integrated food webs at the whole- community level requires significant resources, limiting the ability to rapidly assemble many comparable food webs (Polis, 1991; Nielsen et al., 2018). Stable isotope analyses, because they reflect the consequences of energy flow, provide an integrative approach to reflect the net transfer of energy of resources to consumers and to characterize the trophic niche of diverse taxa (e.g. zooplankton, benthic invertebrates and fish) and food web structure (isotopic food webs). Stable isotopes of carbon (δ13C) and nitrogen (δ15N) are principally used by ecologists to quantify the nature and origin of resources consumed and the trophic position of consumers, respectively (Fry, 2006). There is a well established history of trophic investigations using stable isotope analyses in freshwater ecosystems. For instance, stable isotope analyses can reveal the role of predatory fish in coupling pelagic and littoral food chains in a simplified food web lake (Vander Zanden et al., 1999) or quantify the ecological consequences of global change such as biological invasions, habitat fragmentation, and pollution (e.g. Alp and Cucherousset, 2022). Stable isotope approaches provide accurate tools for comparing a first compilation food webs and population diets between ecosystems, notably by incorporating methods such as baseline corrections of the stable isotope values of consumers (Post, 2002; Quezada-Romegialli et al., 2018).
The development of rigorous stable isotope analyses in freshwater ecology provides a powerful, yet still underused, data archive to address questions at the intersection of community and ecosystem ecology, with a focus on global change, biodiversity loss, and food web architecture. However, despite the increased use of stable isotope analyses and the existence of a global stable isotope repository (IsoBank, Pauli et al., 2017), large-scale investigations of global ecological responses of food webs based on stable isotope analyses are still rare. In one of the first global investigations in aquatic ecosystems, food chain length patterns were investigated in freshwater and marine ecosystems across the globe (Vander Zanden and Fetzer, 2007). More recently, a compilation of stable isotope values of freshwater fish has been used to investigate several global-scale questions related to: (i) the influence of biological invasions on the stable isotope structure of freshwater fish communities in lentic and lotic ecosystems (Sagouis et al., 2015); (ii) resource partitioning and niche conservatism of non-native freshwater fish (Comte et al., 2016, 2017); (iii) the link between different facets of biological diversity in fish communities (Pool et al., 2016); and (iv) habitat coupling-trait relationships in lakes (Stiling et al., 2023). Altogether, these studies have revealed the importance, added-value and potential of large-scale stable isotope databases for evaluating of freshwater ecosystems to global change.
We present the IsoFresh database, a global stable isotope database of freshwater fish that also includes other organisms (non-fish) present in the food webs, compiles the species-level δ15N and δ13C values of 1001 freshwater food webs from the published materials in 65 countries from 1992 and 2023. Our motivation for compiling this database is to identify and understand the fundamental structure and processes of the earth's freshwater food webs and to assess the ways that these structures and processes are being altered by human-driven global change.
2 Methods
2.1 Data extraction
The IsoFresh database was initiated in 2011 and was updated regularly until end-2023, with the more recent updates to improve the geographical coverage of the database. IsoFresh is a global stable isotope database of freshwater fish in which we included all other organisms analysed for stable isotopes and used to interpret food webs. We first used online search engines to collect stable isotope values (δ15N and δ13C) in journal articles, academic theses and reports. Specifically, we first searched Clarivate Analytics' Web of Science online database using the following search terms: “TS = (isotope* AND fish* AND carbon AND nitrogen), (community* OR communities* OR assemblage*) and (freshwater* OR lake* OR reservoir* OR river* OR stream*)”. We also searched Google Scholar with similar terms. Then, we followed a more supplementary approach by searching for references cited in the selected publications and for literature published by the same group of scientists.
We applied a set of criteria to select a subset of studies for inclusion in the database from among all the publications identified by the initial search. Our first criterion of inclusion focused on identifying that the studies were conducted in freshwater ecosystems sensus stricto while excluding studies performed in estuarine, brackish and marine environments. Secondly, we included only the studies in which δ15N and δ13C values were simultaneously investigated. Thirdly, only studies including both stable isotope values for each species were included. Here each species must, at least, include an average δ15N and δ13C value irrespective of the number of individuals analysed per species. Fourth, we only included studies with comprehensively studied fish communities. To conclude comprehensiveness, we required that a statement was provided in the methods indicating that species known to be present in the local fish community were represented in the sample, or a comprehensive freshwater fish sampling protocol was presented indicating an effort to assay the whole fish community. It is therefore very likely that rare species were underrepresented in these studies. Studies assessing the trophic niche of only a subset of species within a given community were excluded. Finally, the presence of organisms other than fish was not used as a criterion for inclusion in the IsoFresh database but, when available, the stable isotope values of these organisms (i.e. baselines, potential prey) were included.
For each food web, information about site name, the type of freshwater ecosystem, the country, continent and the geographic coordinates (latitude and longitude) were extracted. The database could include distinct food webs for multiple sites sampled within the same drainage or for the same site sampled at different seasons or years. In cases when the geographical information was missing in a literature source, we digitalised the coordinates based on maps provided in the source and/or used online maps to localize the study site. For each food web, we extracted the mean δ15N and mean δ13C values of each fish species from tables, supplemental appendices or figures using WebPlotDigitizer (https://automeris.io). In addition, we collected the variability associated with mean δ15N and mean δ13C values (e.g. standard error, standard deviations), the number of individuals and the type of tissue (e.g. muscle, fin) analysed for stable isotope analyses. When δ15N and δ13C values were reported at the individual level or were provided for different age classes or subspecies, they were averaged to obtain a single value per species. Further fish taxonomy (species, orders and families) was obtained using rfishbase (Boettiger et al., 2012) or manually retrieved and confirmed if not available in FishBase. When available (77.1% of all food webs), we also extracted the stable isotope values (mean, associated variability and number of samples analysed for δ15N and δ13C values) of other taxa, including non-aquatic organisms that were collected to represent baselines and potential prey. These include primary producers such as macrophytes, phytoplankton, and detritus and consumers such as zooplankton and macroinvertebrates. We followed the same approach regarding the extraction of stable isotope data for these other organisms.
2.2 Database formatting
The database is organized in a folder containing multiple files. The first file is a README file (IsoFresh_read.me.txt) that describes the content of each column in each subsequent file. Each food web has a unique identifier (Food Web_ID) which is the first column of each spreadsheet and links the different information contained in each spreadsheet. The second file “IsoFresh_FoodWeb.csv” contains information about the food webs and includes a DOI link or URL access to the original source, the author's name, the publication title and year and the source type. The third file “IsoFresh_Ecosystem.csv” contains information about the location where the food web was sampled and includes the site name reported in the original source, the type of freshwater ecosystem (lentic or lotic), the country (and associated ISO code), the world region, and the longitudinal and latitudinal coordinates. The fourth file “IsoFresh_Isotope_Fish.csv” contains information about the fish species included in the database, including the common and scientific name of the species, its taxonomy (order, family and genus), the δ15N and δ13C values of each fish (mean, associated variability and number of individuals analysed) and the tissue used for stable isotope analyses (e.g fin, liver, muscle). The fifth file “IsoFresh_Isotope_Other.csv” contains information about the other organisms (common and scientific names of non-fish organisms, exactly as reported in the original source) for which δ15N and δ13C values (mean, associated variability and number of samples analysed) were available. These files, which constitute the IsoFresh database (Boulêtreau et al., 2025) are available on a Zenodo repository (https://doi.org/10.5281/zenodo.14982323).
3 Content of the database
In total, the stable isotope data were collected from 296 studies (82.6% peer-reviewed, 8.7% academic theses, 8.7% other sources such as reports/books) Justification: Reformatted for clarity and consistency such as reports and books) published between 1992 and 2023 (Fig. 1). The IsoFresh database contains δ15N and δ13C stable isotope values in 1001 food webs located in 65 countries worldwide with a total of 15343 stable isotope values of freshwater organisms (Fig. 1). The database contains food webs in all continents except Antarctica, with a high proportion of sites located in North America (29.1%, n = 291) and Europe (21.9%, n = 219, Tab. 1), which is a common geographical bias previously observed with stable isotope studies in freshwater ecosystems (Cucherousset et al., 2012). The database contains 178 food webs in Oceania, 131 in South-America, 108 in Asia and 74 in Africa (Tab. 1). Food webs were located in different types of freshwater ecosystems and relatively well balanced between lotic (n = 522, mainly rivers and streams) and lentic (n = 476, mainly lakes and reservoirs) ecosystems. In addition, 3 food webs were classified as Other because sampling was performed in both lentic and lotic habitats. Thus, the IsoFresh database provides a comprehensive global database of species-level stable isotope data of freshwater ecosystems across the globe.
Stable isotope values were collated for a total of 1607 fish species. The most common fish species in the database were the European perch Perca fluviatilis (150 food webs), the brown trout Salmo trutta (140 food webs), the common carp Cyprinus carpio (123 food webs), the northern pike Esox lucius (122 food webs) and the roach Rutilus rutilus (116 food webs). The number of fish species occurring in each food web varied between geographical regions, with the lowest richness in communities in Europe (mean ± SD; 5.4 ± 2.9, maximum = 20 species) and Oceania (6.7 ± 4.9, maximum = 24 species) and the highest richness in the communities in Africa (11.9 ± 13.2, maximum = a maximum of 72 species) and South-America (12.5 ± 8.7, maximum = 64 species) (Fig. 2 and Tab. 1). These geographic differences likely reflect natural biogeographical patterns observed in freshwater fish biodiversity (Tedesco et al., 2017). The fish species belonged to 182 families and there was a total of 609 fish species in South America (79 families, dominated by Cichlidae and Characidae), 360 in Africa (46 families dominated by Cichlidae and Cyprinidae), 318 in Asia (82 families dominated by Xenocyprididae and Cyprinidae), 248 in North America (43 families dominated by Salmonidae, Leuciscidae and Centrarchidae), 140 in Oceania (50 families dominated by Eleotridae and Terapontidae) and 77 in Europe (25 families dominated by Leuciscidae and Salmonidae). A vast majority of stable isotope analyses were performed on fish muscle (86.0 %) and 12.9% on fins and stable isotope values within each site were variable both within and between geographical regions (Tab. 1). In addition, the IsoFresh database contains 7307 δ13C and δ15N values of non-fish organisms that usually consist of potential prey and baseline organisms of the studied food webs (e.g. primary producers and primary and secondary consumers). On average, each food web has the stable isotope values for 9.5 (± 7.5) non-fish organisms.
 |
Fig. 1 Distribution of the publication year of the food webs (n = 1001) included in the IsoFresh database. |
Descriptive statistics of the food webs (total number) and the δ13C and δ15N values (mean, standard deviation, minimum and maximum) of freshwater fish contained in IsoFresh database for each geographical region.
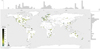 |
Fig. 2 Locations of food webs included in the IsoFresh database (n = 1001), with the colour gradient of points representing the number of fish species in each food web. |
4 Conclusion and perspectives
The IsoFresh database constitutesthe first comprehensive database of species-level carbon and nitrogen stable isotope values of freshwater fish and the associated baselines and putative prey present in food webs across the globe. The IsoFresh database provides a valuable opportunity to bridge the gap between community and ecosystem ecology. The global nature of the data can support broad-scale predictions related to the consequences of environmental change and predicting future trajectories of community dynamics in freshwater ecosystems. Global change is rewiring food webs across the globe (Bartley et al., 2019), and by providing the means to characterize freshwater food webs, the IsoFresh database will enables a broader understanding of how natural and human-induced environmental drivers are involved in that rewiring. This is an critical knowledge gap because, in addition to limiting fundamental insights into ecological theory, it hampers our understanding of how changes in biodiversity induced by environmental changes modulate ecosystem functioning.
In addition, a longstanding challenge in ecology is to identify integrative and robust metrics that summarize complex biological interactions while concurrently providing inferences regarding ecosystem health. To date, most bioindicators are based on taxonomic composition of communities and provide only limited information about the processes shaping community structure and ecosystem functioning. In stable isotope ecology, several metrics have been developed to describe the spread of species in the stable isotope space, including the size of the community trophic niche (convex hull area or standard ellipse area), the range of nitrogen and carbon values and trophic evenness, and shifts in isotope signatures over time (Layman et al., 2007; Schmidt et al., 2007; Jackson et al., 2011; Cucherousset and Villéger, 2015). Raw stable isotope values of all organisms in the food webs can also be used in Bayesian mixing models to estimate the relative contribution of prey to the diet of consumers (Semmens et al., 2009; Stock et al., 2018). We are confident that stable isotope based-metrics have the potential to serve as more sensitive indicators of ecosystem change than indicators based on taxonomic data (Jackson et al., 2016) and the IsoFresh database can support such investigations.
Acknowledgements
This research was conducted by the Fooδ-webs research group funded by the Centre for the Synthesis and Analysis of Biodiversity (CESAB) of the Foundation for Research on Biodiversity (FRB). This work is part of the FUNELAKES project (grant no. IRP 00020) from INEE CNRS (Centre National de la Recherche Scientifique). JS acknowledges funding from UKRI Future Leaders Fellowship [Grant/Award Number: MR/X035662/1]. We are grateful to two reviewers and the Editor for their valuable comments.
Data availability statement
The IsoFresh database is available at Zenodo (https://doi.org/10.5281/zenodo.14982323). We kindly request that users to cite this article when using data from the IsoFresh database. While the database is based on materials published until 2023, we encourage potential contributors to contact Stéphanie Boulêtreau and Julien Cucherousset to support future updates and extensions.
References
- Alp M, Cucherousset J. 2022. Food webs speak of human impact: Using stable isotope-based tools to measure ecological consequences of environmental change. Food Webs 30: e00218. [CrossRef] [Google Scholar]
- Bartley TJ, McCann KS, Bieg C, Cazelles K, Granados M, Guzzo MM, MacDougall AS, Tunney TD, McMeans BC. 2019. Food web rewiring in a changing world. Nat Ecol Evol 3: 345–354. [CrossRef] [PubMed] [Google Scholar]
- Boettiger C, Lang DT, Wainwright PC. 2012. rfishbase: exploring, manipulating and visualising FishBase data from R. J Fish Biol 81: 2030–2039. [CrossRef] [PubMed] [Google Scholar]
- Boulêtreau S, Vagnon C, Sagouis A, Comte L, Pool T, Stiling R, Harrod C, South J, McIntosh AR, Perga ME, Sanchez-Hernandez J, Roussel JM, Tunney TD, Jackson M, Olden JD, Cucherousset J. 2025. IsoFresh: a global stable isotope database of freshwater food webs. Zenodo. https://doi.org/10.5281/zenodo.14982323. [Google Scholar]
- Burley HM, Mokany K, Ferrier S, Laffan SW, Williams KF, Harwood T. 2016. Macroecological scale effects of biodiversity on ecosystem functions under environmental change. Ecol Evol 6: 2579–2593. [CrossRef] [PubMed] [Google Scholar]
- Cardinale BJ, Duffy JE, Gonzalez A, Hooper DU, Perrings C, Venail P, Narwani A, Mace GM, Tilman D, Wardle DA, Kinzig AP, Daily GC, Loreau M, Grace JB, Larigauderie A, Srivastava DS, Naeem S. 2012. Biodiversity loss and its impact on humanity. Nature 486: 59–67. [CrossRef] [PubMed] [Google Scholar]
- Comte L, Cucherousset J, Boulêtreau S, Olden JD. 2016. Resource partitioning and functional diversity of worldwide freshwater fish communities. Ecosphere 7: e01356. [CrossRef] [Google Scholar]
- Comte L, Cucherousset J, Olden JD. 2017. Global test of Eltonian niche conservatism of non-native freshwater fish species between their native and introduced ranges. Ecography 40: 384–392. [CrossRef] [Google Scholar]
- Cucherousset J, Villéger S. 2015. Quantifying the multiple facets of isotopic diversity: New metrics for stable isotope ecology. Ecol Indic 56: 152–160. [CrossRef] [Google Scholar]
- Fry B. 2006. Stable isotope ecology. New York: Springer. [Google Scholar]
- Gonzalez A, Germain RM, Srivastava DS, Filotas E, Dee LE, Gravel D, Thompson PL, Isbell F, Wang S, Kéfi S, Montoya J, Zelnik YR, Loreau M. 2020. Scaling-up biodiversity-ecosystem functioning research. Ecol Lett 23: 757–776. [Google Scholar]
- Jackson AL, Inger R, Parnell AC, Bearhop S. 2011. Comparing isotopic niche widths among and within communities: SIBER − Stable Isotope Bayesian Ellipses in R. J Anim Ecol 80: 595–602. [CrossRef] [PubMed] [Google Scholar]
- Jackson MC, Weyl OLF, Altermatt F, Durance I, Friberg N, Dumbrell AJ, Piggott JJ, Tiegs SD, Tockner K, Krug CB, Leadley PW, Woodward G. 2016. Recommendations for the next generation of global freshwater biological monitoring tools. Adv Ecol Res 55: 615–636. [CrossRef] [Google Scholar]
- Layman CA, Arrington DA, Montaña CG, Post DM. 2007. Can stable isotope ratios provide for community-wide measures of trophic structure? Ecology 88: 42–48. [CrossRef] [PubMed] [Google Scholar]
- Loreau M. 2010. Linking biodiversity and ecosystems: Towards a unifying ecological theory. Philos Trans R Soc B 365: 49–60. [CrossRef] [PubMed] [Google Scholar]
- Naeem S, Duffy JE, Zavaleta E. 2012. The functions of biological diversity in an age of extinction. Science 336: 1401–1406. [CrossRef] [PubMed] [Google Scholar]
- Nielsen JM, Clare EL, Hayden B, Brett MT, Kratina P. 2018. Diet tracing in ecology: Method comparison and selection. Methods Ecol Evol 9: 278–291. [CrossRef] [Google Scholar]
- Pauli JN, Newsome SD, Cook JA, Harrod C, Steffan SA, Baker CJO, Ben-David M, Bloom D, Bowen GJ, Cerling TE, et al. 2017. Why we need a centralized repository for isotopic data. Proc Natl Acad Sci USA 114: 2997–3001. [CrossRef] [PubMed] [Google Scholar]
- Polis GA. 1991. Complex trophic interactions in deserts: An empirical critique of food-web theory. Am Nat 138: 123–155. [CrossRef] [Google Scholar]
- Pool TK, Cucherousset J, Boulêtreau S, Villéger S, Strecker AL, Grenouillet G. 2016. Increased taxonomic and functional similarity does not increase the trophic similarity of communities. Glob Ecol Biogeogr 25: 46–54. [CrossRef] [Google Scholar]
- Post DM. 2002. The long and short of food-chain length. Trends Ecol Evol 17: 269–277. [CrossRef] [Google Scholar]
- Quezada-Romegialli C, Jackson AL, Hayden B, Kahilainen KK, Lopes C, Harrod C. 2018. TROPHICPOSITION, an R package for the Bayesian estimation of trophic position from consumer stable isotope ratios. Methods Ecol Evol 9: 1592–1599. [CrossRef] [Google Scholar]
- Sagouis A, Cucherousset J, Villéger S, Santoul F, Boulêtreau S. 2015. Non-native species modify the isotopic structure of freshwater fish communities across the globe. Ecography 38: 979–985. [CrossRef] [Google Scholar]
- Schmidt SN, Olden JD, Solomon CT, Vander Zanden MJ. 2007. Quantitative approaches to the analysis of stable isotope food web data. Ecology 88: 2793–2802. [CrossRef] [PubMed] [Google Scholar]
- Semmens BX, Ward EJ, Moore JW, Darimont CT. 2009. Quantifying inter- and intra-population niche variability using hierarchical Bayesian stable isotope mixing models. PLoS ONE 4: e 6187. [Google Scholar]
- Stiling RR, Olden JD, Boulêtreau S, Cucherousset J, Holtgrieve GW. 2023. Global investigation of lake habitat coupling by fishes. Oecologia 202: 617–628. [CrossRef] [PubMed] [Google Scholar]
- Stock BC, Jackson AL, Ward EJ, Parnell AC, Phillips DL, Semmens BX. 2018. Analyzing mixing systems using a new generation of Bayesian tracer mixing models. PeerJ 6: e5096. [CrossRef] [PubMed] [Google Scholar]
- Tedesco PA, Beauchard O, Bigorne R, Blanchet S, Buisson L, Conti L, Cornu JF, Dias MS, Grenouillet G, Hugueny B, et al. 2017. A global database on freshwater fish species occurrence in drainage basins. Sci Data 4: 170141. [CrossRef] [PubMed] [Google Scholar]
- Thompson RM, Brose U, Dunne JA, Hall RO, Hladyz S, Kitching RL, Martinez ND, Rantala H, Romanuk TN, Stouffer DB, Tylianakis JM. 2012. Food webs: Reconciling the structure and function of biodiversity. Trends Ecol Evol 27: 689–697. [CrossRef] [PubMed] [Google Scholar]
- Vander Zanden JM, Fetzer WW. 2007. Global patterns of aquatic food chain length. Oikos 116: 1378–1388. [CrossRef] [Google Scholar]
- Vander Zanden MJ, Casselman JM, Rasmussen JB. 1999. Stable isotope evidence for the food web consequences of species invasions in lakes. Nature 401: 464–467. [CrossRef] [Google Scholar]
Cite this article as: Boulêtreau S, Vagnon C, Comte L, Sagouis A, Pool T, Stiling RR, Harrod C, South J, McIntosh AR, Perga M-E, Sánchez-Hernández J, Roussel J-M, Tunney TD, Jackson M, Olden JD, Cucherousset J. 2025. IsoFresh: A global stable isotope database of freshwater food webs. Knowl. Manag. Aquat. Ecosyst., 426, 15. https://doi.org/10.1051/kmae/2025010
All Tables
Descriptive statistics of the food webs (total number) and the δ13C and δ15N values (mean, standard deviation, minimum and maximum) of freshwater fish contained in IsoFresh database for each geographical region.
All Figures
|
Fig. 1 Distribution of the publication year of the food webs (n = 1001) included in the IsoFresh database. |
| In the text | |
|
Fig. 2 Locations of food webs included in the IsoFresh database (n = 1001), with the colour gradient of points representing the number of fish species in each food web. |
| In the text | |
Current usage metrics show cumulative count of Article Views (full-text article views including HTML views, PDF and ePub downloads, according to the available data) and Abstracts Views on Vision4Press platform.
Data correspond to usage on the plateform after 2015. The current usage metrics is available 48-96 hours after online publication and is updated daily on week days.
Initial download of the metrics may take a while.