| Issue |
Knowl. Manag. Aquat. Ecosyst.
Number 426, 2025
Biological conservation, ecosystems restoration and ecological engineering
|
|
|---|---|---|
| Article Number | 5 | |
| Number of page(s) | 13 | |
| DOI | https://doi.org/10.1051/kmae/2024022 | |
| Published online | 31 January 2025 | |
Research Paper
Efficiency of a macroroughness block ramp in reducing the impact of low-head dams on riverine fish dispersion
1
Pôle R&D écohydraulique, OFB-IMFT-PPRIME, Toulouse, France
2
Office français de la biodiversité, Direction de la recherche et de l’appui scientifique, Toulouse, France
3
Office français de la biodiversité, Direction de la police et du permis de chasser, Service prévention appui prospective, Toulouse, France
* Corresponding author: This email address is being protected from spambots. You need JavaScript enabled to view it.
; This email address is being protected from spambots. You need JavaScript enabled to view it.
Received:
3
October
2024
Accepted:
6
December
2024
Abstract
Macroroughness ramps (e.g. with a rough bed and protruding blocks evenly distributed in staggered rows) are nature-like fishways offering a wide range of flow conditions and are expected to be very efficient tools to reduce the impact of weirs on the free movements of most life-stages of riverine fish species. However, their in situ efficiency has not been evaluated yet. Here, we used Radio Frequency Identification (RFID) telemetry to monitor during two years the displacement of eleven fish species, on such a macroroughness ramp located on a tributary of the Loire River in France. We (1) evaluated the migration rates of tagged fish species, poorly documented so far; (2) quantified macroroughness ramp attraction and efficiency; and (3) assessed the influence of fish species, fish length and environmental conditions (river discharge and temperature) on these efficiency estimates. All the species detected downstream of the weir successfully crossed the ramp, although at varying rates. Depending on the analytical approach (considering the whole study duration or taking into account different fish attempts), the ramp attraction efficiency ranged between 65.5% and 52.9%, the ramp passage efficiency between 81.8% and 77.0% and the overall efficiency between 53.6% and 41.6%. Fish between 70 and 451 mm in total length were detected crossing the ramp, usually within a short time. In comparison with the efficiency results available for other types of fishways, the macroroughness ramp studied here ranks among the most efficient devices for fish movement restoration.
Key words: Fish community / migration rate / fishway / efficiency estimates
© S. Tomanova et al., Published by EDP Sciences 2025
 This is an Open Access article distributed under the terms of the Creative Commons Attribution License CC-BY-ND (https://creativecommons.org/licenses/by-nd/4.0/), which permits unrestricted use, distribution, and reproduction in any medium, provided the original work is properly cited. If you remix, transform, or build upon the material, you may not distribute the modified material.
1 Introduction
The decline in freshwater fish diversity has been accelerating over the last century and the rate of extinction of these species is now higher than in other taxa (Reid et al., 2019). Riverine fishes are at particularly high risk of extinction due to the numerous anthropogenic stressors affecting their ecosystems including degradation of habitat quality and connectivity, biological invasions, and pollution (Oberdorff, 2022). River fragmentation is one of the major threats for riverine ecosystems (Nilsson, 2005; Fuller et al., 2015). Dams, weirs and other infrastructure built on watercourses impede the movement of sediments, nutrients, water, and aquatic organisms along river networks, thereby altering riverine habitat structure, together with ecosystem processes and functions.
As a consequence, a decline in migratory fish species was observed during the 20th century (Latham et al., 2008; Costa-Dias et al., 2009; Puijenbroek et al., 2019), increasing the need for riverine connectivity restoration. In this context, many different types of fish passage solutions have been proposed as a mitigation measure to facilitate fish migration through dams and weirs (e.g. Clay and Eng, 1995; Larinier, 1998; Larinier et al., 2006; Seliger and Zeiringer, 2018). For a long time, fishways were preferentially designed for diadromous fish with strong swimming capacities (mainly salmonids), which are of economic interest. These fishways are less effective for non-salmonid riverine fish (Noonan et al., 2012; Sun et al., 2023) also displaying obvious migration needs (Lucas et al., 2001), and need thus to be improved to mitigate habitat fragmentation for a broad fish community. The aim to restore connectivity for the entire fish community was favoured by the European Water Framework Directive (Directive 2000/60/CE, 2000), leading to the development of new types of fishways (Cassan and Laurens, 2016; Amaral et al., 2019, 2021; Miranda et al., 2021). Macroroughness ramps, with a rough bed and protruding macroroughness blocks evenly distributed in staggered rows (Cassan and Laurens, 2016), offer a wide range of flow conditions and may be suitable for the upstream migration of most fish species. This solution (see some examples of existing ramps in Suppl. Material) is particularly interesting for low-head weirs (up to 2 m), but until now, the in situ efficiency of such ramps has not been demonstrated.
Here we present results from a two-year-long efficiency study of a macroroughness ramp for eleven riverine fish species, some of which having low swimming capacities. Using Radio Frequency Identification (RFID) telemetry, the study objectives were to: (1) evaluate the migration rates of various freshwater fish species, that had been poorly documented so far; (2) quantify macroroughness ramp attraction and efficiency; and (3) assess the influence of species, fish length and environmental conditions (river discharge and temperature) on the efficiency estimates.
2 Material and methods
2.1 Study site
The study site was located on the lower course of the Rhins River, 7 km upstream of its confluence with the Loire River (France, Fig. 1). The Rhins is a small, 45-km long, gravel‐bed river with a median inter‐annual flow of 5.05 m3/s (source: hydro.eaufrance.fr; station K098301001). The Rhins shows fairly high seasonal flow fluctuations, with winter high levels, and average monthly flows between 6.6 and 9.4 m3/s from December to February. The low water period occurs during summer, in August and September (average monthly flows between 0.5 and 0.9 m3/s). The river is fragmented by several artificial physical barriers; some of which have already been erased or equipped with fishways by local managers. The bridge stabilization weir of Pont des Allées, generating a vertical water drop of 0.8–0.9 m (Fig. 1d) with a plunging jet, was equipped in 2016 with a 6-m wide ramp consisting of three 10 m long sections with macroroughness and two intermediate deep rest pools (Fig. 1). The slope of each 10 m section is 3.6%. The macroroughness is formed by basalt blocks of 34–40 cm in diameter, 45 cm high, at a concentration of 11% (see Larinier et al., 2006 for definition). The ramp bed is rough, filled with larger cobbles (15–20 cm). The ramp has two distinct bed levels in its transversal axis (Fig. 1e) to create favourable conditions for fish to pass through under a wide range of river discharge conditions (Fig. 2b).
At low discharges (<0.5 m3/s), all the water flows through the ramp (as seen in Fig. 1d). At median river flow and above, the ramp discharge is between 45% and 50% of the river flow (Fig. 2a). Velocities in jets between macroroughness blocks increase with the water depth on the ramp (Fig. 2b), from 0.43 m/s at a water depth of 0.11 m, up to 1.08 m/s at a water depth of 0.41 m (macroroughness nearly submerged). Volumetric dissipated power (Fig. 2b) is lower than 150 W/m3 until the macroroughness is submerged, and increases substantially thereafter. The lower and upper parts of the ramp are submerged at a total river flow of 1.6 and 6.1 m3/s respectively.
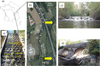 |
Fig. 1 (a) and (b) Location of the study site on the Rhins River with indications of the fished river sectors (S1–S6), (c) rock weir located between S3 and S4, (d) bridge stabilization weir with macroroughness block ramp (view from downstream), (e) top view of two upstream ramp sections separated by a rest pool, showing two different bed levels on either side of the ramp. |
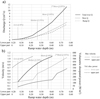 |
Fig. 2 Hydraulic characteristics of the studied macroroughness ramp: a) Discharge (Q) distribution between the ramp and the weir on the study site, and b) maximum flow velocity in jets between macroroughness blocks along with volumetric dissipated power, as a function of water depth on the ramp. Hydraulic characteristics were computed using the Cassiopée software package (Dorchies et al., 2022). Velocities were not computed once the macroroughness blocks were submerged. Percentages associated with the discharge Q (%) correspond to non-exceedance frequencies. |
2.2 Fish and environmental survey
The efficiency of the studied macroroughness ramp was assessed using RFID technology (as recommended by NF EN 17233, 2021). Three flat RFID detection antennas (connected to CIPAM receivers with sufficient storage capacity) were set up: one on the river bottom downstream of the weir (hereafter called “River antenna”, detecting the upstream migrating fish), one at the entrance of the ramp (“Entrance antenna”) and one at its exit (“Exit antenna”, detecting fish successfully passing through the entire fishway). Despite some breakdowns (2018: 30/11-6/12, 2019: 20/2-25/2, 30/4-6/5, 23/10-13/11), the RFID antennas operated during 95% of the study duration time.
The fish were captured on two occasions (October 2018 and 2019), by electrofishing a river stretch located between 300 and 900 m downstream of the bridge weir, divided into six ≈100-m-long sectors (S1–S6, Fig. 1b; note that 130 m–long S3 and 60 m–long S4 were separated by a rock weir, see photo Fig. 1c). To limit the impact of tagging on small individuals, a minimum total length for tagged fish was defined: 70 mm or 100 mm, depending on the species. All captured fish were anaesthetized (3–5 min in a bath with clove oil), measured (total length and weight) and then tagged with a PIT-tag (Passive Integrated Transponder), inserted into the body cavity via an incision (2–5 mm, without suture) done with surgical mini scalpel blade on the ventral part (slightly offset from the ventral line). 12 mm PITs were used for small fish between 70 and 130 mm long, 23 mm PIT for larger ones. The surgical procedure lasted a few seconds. The fish were then kept in a pool with oxygenated water, where they recovered and could swim normally after a few minutes. Each fish was released in the river sector where it was captured. Fish movements on the study site were recorded from October 2018 to December 2020. The study was validated by Ethics Committee N°073 and obtained the authorization of the French Ministry for Research.
Hourly data of river discharge (recorded at the hydrometric station of Saint-Cyr-de-Favières [station K098301001], 4 km upstream from the study site, without any major tributary between them) was extracted from the Hydro Portail website (http://hydro.eaufrance.fr). The water temperature (°C) of the Rhins River was recorded hourly (Hobo Data Logger Onset; precision 0.1 °C) just downstream of the weir. During the study period, the river discharge varied from 0.04 to 41 m3/s (Fig. 3) and several significant floods occurred. The water temperature ranged from 1.6 °C to 29.5 °C.
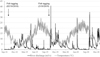 |
Fig. 3 Discharge and water temperature of the Rhins River during the study with indication of tagging days. |
2.3 Data analysis
2.3.1 Migration rate and relationship with fish body length
All fish detected by the River antenna moved at least 300 m in an upstream direction and were therefore considered to be in upstream movement (defined as “available fish” following NF EN 17233, 2021). We computed and compared (using Chi2 tests) the migration rate (proportion of tagged fish detected in upstream movement) among the S1–S6 fished sectors. Potential differences in fish length between migrating and undetected fish were tested using the Wilcoxon test (it should be noted that, when fish lengths were analysed, only records during the first year after fish tagging were used to limit a bias due to the fish growth).
2.3.2 Attraction, passage and overall efficiencies of the ramp
To assess the efficiency of the macroroughness ramp, fish data were first analysed all together (using all data recorded during the whole survey). However, several individuals attempted to cross the ramp several times during the study and we tried, in a second step, to better take into account these different individual approaches to the bridge weir (i.e. different attempts to migrate upstream). For this, individual data were split into distinct attempts by applying an arbitrary 5-day non-detection period (i.e. when the fish left the survey area, without coming back during at least 5 days, see further details in Suppl. Material).
Three efficiency estimates (as defined in NF EN 17233, 2021) were calculated using both the whole and split datasets:
Ramp attraction efficiency (Aeff): the ratio between the number of fish entering the macroroughness ramp (detected by the Entrance antenna) and the number of migrating fish (River antenna) (note that attraction efficiency in the present work is in fact a combination of the attraction and entrance efficiencies defined in the European guideline);
Ramp passage efficiency (Peff): the ratio between the number of fish leaving the ramp (Exit antenna) and those that entered it (Entrance antenna);
Overall ramp efficiency (overall Peff): the ratio between the number of fish leaving the ramp (Exit antenna) and the number of migrating fish (River antenna).
Using split data, the Aeff, Peff and overall Peff were expressed per attempt as binary data (0–failure/1–passage success), then for each fish by averaging all its attempts, and finally for each species by averaging the results of all individuals (note that some individuals made numerous attempts and would have weighed heavily on efficiency metrics if an average had been computed directly from all attempts).
2.3.3 Passage times
Using the data split into different attempts, three passage times were computed:
Approach time (Tapp): the duration between the first detection at the River antenna and the first detection at the Entrance antenna;
Ramp passage time (Tpas): the duration between the first detection at the Entrance antenna and the first detection at the Exit antenna;
Overall passage time (Tall): the duration between the first detection at the River antenna and the first detection at the Exit antenna.
2.3.4 Key parameters influencing fish passage and passage time
We analysed whether the likelihood of fish passage through the ramp (binary Aeff, Peff and overall Peff) and different passage times (ln-transformed Tapp, Tpas and Tall) can be mediated by fish length, river discharge, species, season or water temperature. For this, we used the data split into attempts (which occurred in the year following the tagging, until December n+1, to limit a bias due to the fish growth). Only the data from the four most abundant species (barbel, chub, gudgeon, spirlin) were considered. For each attempt, we associated (at the time of the first fish detection by the River antenna) the river discharge (m3/s), the water temperature (°C) and the season (considered in 3 categories: 1- spring/early summer including the reproduction season: April, May, June and July; 2–later summer and autumn: August, September, October and November; 3–winter: December, January, February and March). Long attempts (passage time > 2 days), during which flow conditions might have varied, were eliminated from the dataset. We first applied a mixed linear model (glmmTMB function of the glmmTMB package under R) to better account for specificities linked to the species and the individual (some individuals made several attempts). The species and the individual code (PIT tag ID) were included in the model as a random nested variable. We included in the initial model the fish length*species, river discharge*species, temperature* species and season*species interactions (if the data allowed it). We ln-transformed and scaled fish length, river discharge and temperature variables to improve the data fit to tested models. The Akaike information criterion (AIC) and Bayesian information criterion (BIC) were considered along with the significance of various explanatory variables (ANOVA test). The data fit for each model was checked using the simulateResiduals function of the DHARMa package. Other forms of the model were then tested by eliminating non-significant variables (ANOVA test, p>0.05). Since the Peff, Tapp, Tpas and Tall data did not fit any of the mixed models tested, we opted for generalized linear models (glm function of the stats package in R), eliminating the data of individuals making more than 4 attempts (to reduce their influence on results). Finally, we retained the best fitted model with the smallest AIC and BIC criteria, keeping only variables significantly explaining the efficiency metrics and different passage times. All statistical analyses were performed using the statistical program R (R Core Team, 2019).
3 Results
3.1 Migrations of riverine fish
A total of 963 individuals between 70 and 495 mm in total length, belonging to 13 species, were captured and tagged during the study (Tab. 1). Chub, gudgeon, spirlin and barbel were the most frequently tagged species (87% of all tagged fish).
From 0 to 20 different individuals were detected daily at the study site over the year (Fig. 4). Two main migration periods were observed: a longer one in spring (March–June) and a shorter and less intense one in autumn (October–November).
In total, 252 individuals were detected in upstream movement during the study period (26% of tagged fish). The proportion of migrating fish differed between sectors (χ2 = 25.07, p < 0.001) with a clearly negative effect of the rock weir on upstream fish migration between S3 and S4 (Fig. 5). 34% (between 30–37%, depending on the sector) of fish tagged upstream of the rock weir migrated upstream (i.e., were detected at least once at the River antenna), compared to 17% (13–21%) of the fish tagged downstream.
The proportion of migrating individuals clearly depended on fish species (Tab. 1). Regarding the most abundant species, the migration rates were 55% for barbel, 32% for chub, 24% for spirlin and 19% for gudgeon. For other species, the migration rates ranged from 0% for rudd and bleak (but the number of tagged individuals was low and all except one were caught and released downstream of the rock weir), up to 75% for brown trout.
Fish detected migrating upstream were between 70 and 451 mm long (Tab. 1). The length of migrating individuals ranged between 120 and 407 mm for barbel, between 102 and 323 mm for chub, between 100 and 145 mm for gudgeon and between 80 and 115 mm for spirlin (note that the minimum values corresponded most of the time to the smallest tagged fish). Considering all sectors together and the four most abundant species, there was no significant difference in fish length between migrating and undetected individuals (Wilcoxon test, W = 303, p-value = 0.11 for barbel, W = 10032, p-value = 0.11 for chub, W = 5565, p-value = 0.17 for gudgeon, and W = 2245, p-value = 0.35 for spirlin).
Species, number and total length of tagged fish, migration rate (%) and total length of migrating individuals, along with efficiency estimates of the macroroughness ramp computed for the whole survey period and when accounting for different fish attempts (na: no tagged individuals in the sector).
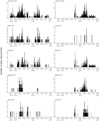 |
Fig. 4 Fish activity at the study site (for all species together and for the four most abundant species, separately per tagging year) as the number of fish detected daily (different individuals) on three RFID antennas. |
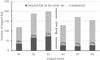 |
Fig. 5 Number of tagged fish at each river sector (S1–S6), and number (and proportion, %) of fish presenting an upstream movement (i.e., detected at least once at the River antenna) during the two-year survey (see Fig. 1b for sector locations and Table 1 for details per species). |
3.2 Efficiency estimates for the macroroughness ramp
Eleven species (out of 13 tagged) were detected downstream of the weir by the River antenna. All managed to cross the ramp but with different efficiency rates. Globally, out of a total of 252 migrating fish detected during the two-year survey, 165 entered the macroroughness ramp and 135 successfully crossed it, resulting in an attraction efficiency Aeff of 65.6%, a passage efficiency Peff of 81.8% and an overall efficiency overall Peff of 53.6%.
Concerning the four most abundant species (93% of all individuals detected during the study), without taking into account the different fish attempts, Aeff ranged from 51.9% for gudgeon up to 72.7% for barbel (Tab. 1). Peff appeared generally higher, except for spirlin, between 52% for the latter up to 91.7% for barbel. Overall Peff was therefore 36.1% for spirlin, 38.9% for gudgeon, 59.5% for chub and 66.7% for barbel. Less abundant species (Tab. 1), often showed very high Aeff, Peff and overall Peff values. All individuals of brown trout, nase, pumpkinseed, perch and bitterling detected downstream of the bridge weir managed to cross the ramp (100% efficiency). Values of overall Peff were lower but still considerable for roach (67%) and dace (43%).
Taking into account different fish attempts, the values of Aeff, Peff and overall Peff were lower, but not substantially, than those resulting from the global evaluation (Tab. 1). This clearly indicated that some fish made several approaches to the structure, not always followed by a crossing. Concerning the four most abundant species, Aeff ranged between 42.4% (gudgeon) and 55.7% (barbel), Peff between 43.7% (spirlin) and 86.7% (chub) and overall Peff between 24.2% (spirlin) and 46.5% (chub). The performances of most of other species remained very high (Aeff: 40.5–100%, Peff: 75 − 100%, overall Peff: 33.3 − 100%, cf. Tab. 1).
3.3 Passage time
The approach, ramp passage and overall passage times (Tapp, Tpas and Tall) varied, within and between species (Tab. 2). The time needed to cross the structure remained quite short, however, ranging from a few minutes (minimum) to a few hours (median value). 75% of the successful individuals (all species combined) crossed the structure in less than two days. Barbel individuals approached and entered the ramp the fastest (median Tapp = 50 min, 3rd percentile less than 7 hours). Chub individuals were the fastest in crossing the ramp (75% of individuals did it in less than 30 minutes). Concerning Tall, the chub individuals passed the fastest (median Tall = 1 hour 34 min, 75th percentile ~ 14 hours), contrarily to spirlin individuals taking generally more time (median Tall = 23 hours 29 min, 75th percentile = 41 hours 40 min). Less abundant species (all combined) crossed the macroroughness ramp very quickly (median Tall = 1 hour 34 min, 75th percentile = 3 hours 13 min).
Different passage times for barbel, chub, gudgeon, spirlin and all other species together.
3.4 Effect of fish length and environmental parameters on passage efficiency and passage time
Analysing 376 crossing attempts of the four most abundant species (313 after eliminating the data from individuals which made more than 4 attempts), the fish length and the river discharge appeared as the factors primarily influencing the efficiency estimates (Fig. 6 and Suppl. Material for detailed model results). Aeff, Peff and overall Peff increased significantly with fish length, and Peff and overall Peff decreased with rising river flow. The influence of water temperature was detected only on Aeff, but varied between species. While barbel individuals preferentially entered the ramp at low temperatures, chub, gudgeon and spirlin individuals did it at higher ones. A significant difference in Peff was detected between species: the passage efficiency of barbel individuals appeared significantly lower than that of chub individuals. This result, which is incoherent with the values presented above (Tab. 1), is clearly a consequence of different analytical approaches and fish behaviours on the ramp, as discussed below. Season was never identified as a factor significantly influencing efficiency estimates.
The fish length and river temperature always significantly explained the variability of the three passage times Tapp, Tpas and Tall (see Fig. 7 and Suppl. Material for detailed model results). All passage times significantly decreased with increasing fish length, and river temperature. We detected significant differences in Tpas between species, with barbel individuals spending more time to cross the ramp. Finally, the river discharge influenced Tall, but differently according to the species. It seemed that the Tall of benthic species (barbel and gudgeon) decreased with rising river discharge while pelagic species (chub and spirlin) took slightly more time to cross the ramp under high flow conditions. Season was never identified as a factor significantly influencing passage times.
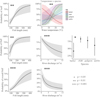 |
Fig. 6 Predicted probabilities of ramp attraction efficiency (Aeff), passage efficiency (Peff) and overall efficiency (overall Peff) as a function of fish length, river discharge, water temperature and species, resulted from mixed linear models for Aeff and overall Peff, and from logistic generalized linear model for Peff (the significance of each variable was tested with ANOVA, see Suppl. Material for details). |
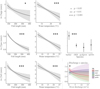 |
Fig. 7 Predicted approach time (Tapp), ramp passage time (Tpas) and overall passage time (Tall) as a function of fish length, river temperature, species and river discharge, resulted from generalized linear model (significance of each variable was tested with ANOVA, see Suppl. Material for details). |
4 Discussion
4.1 Migrations of river fish species
With 11 species (out of 13 tagged) detected by the River antenna downstream of the bridge weir, and a global migration rate of 26% (combining all tagged sectors and individuals), migration and individual displacement can clearly be considered as an important phenomenon for riverine fish communities, supporting the need to restore connectivity for the entire fish community, as targeted by the Water Framework Directive (Directive 2000/60/CE, 2000). The migration rates presented are moreover clearly underestimated in our study. Firstly, they were estimated using the total number of tagged fish, without accounting for natural mortality. It is likely that some individuals, especially young stages or small species with a short lifespan, died during the winter following fishing/tagging, before having the possibility to move upstream, towards the bridge weir. Secondly, the migration rate was clearly impacted by the presence of a rock weir between sectors S3 and S4, which partly impeded the progress of fish from downstream sectors (Fig. 5). Taking into account only sectors upstream of this structure, the migration rate reached 34% for all species and individuals combined, 57% for barbel, 41% for chub, 24% for gudgeon and 33% for spirlin (Tab. 1).
Few studies have reported the migratory fraction in populations of riverine fish species. Existing studies (cited here below) often focus on a single species and differ in their distinction between residents and migrants (movement distance may vary from a few hundred metres up to 10km to define a migrant, cf. Peňáz et al., 2002; De Leeuw and Winter, 2008). Compared to our results, Grimardias et al. (2022) reported higher migration rates in the Rhône River (79% for barbel and 45% for chub compared to 55% and 32% respectively in our study). However, these authors tagged already-migrating individuals, captured in the studied fishways, certainly leading to an overestimation of this rate. During the breeding season, Britton and Pegg (2011) estimated that the probability of a barbel moving from one locality to another was greater than 50%. In the medium-sized Jihlava River displaying high hydromorphological quality, Peňáz et al. (2002) observed 30% of migrating individuals in a barbel population. And Vilizzi et al. (2006) found only 23% of mobile barbels in the Lee River. The migration rate in a fish population therefore appears to be context-dependent and low rates of migrants (or short distances) observed could coincide with high habitat diversity, providing favourable conditions for all life stages (reproduction, egg laying, larvae and juvenile nursery, foraging, hiding, overwintering etc., cf. Peňáz et al., 2002; Britton and Pegg, 2011).
Two periods of increased fish displacement were clearly observed in our study (Fig. 4): a long one in spring (March-June) and a short and less intense one in autumn (October − November). Available studies, mainly based on the occurrence of individuals in fishways (Lucas, 2000; Prchalová et al., 2011; Benitez et al., 2015; Benitez and Ovidio, 2018), also identified these two preferential migration periods. The important finding is that these movements are not always linked to the species’ reproduction phase, since we detected significant autumnal mobility and movements of juveniles. This implies that fishways must be designed to be functional both during and outside the breeding season, and taking young specimens into consideration.
4.2 Efficiency of the ramp to restore fish displacement
Individuals of all species detected downstream of the weir managed to cross the ramp, confirming the multi-species suitability of the studied ramp. During the whole study duration, 65.5% of individuals detected downstream of the bridge weir successfully entered the ramp and 81.8% of individuals detected in the ramp entrance crossed it, resulting in an overall efficiency of 53.6%. Fish between 70 and 451 mm in total length were detected crossing the ramp (Tab. 1), usually within a short time (Tab. 2). This macroroughness ramp hence appeared to be an efficient tool to reduce the weir impact on fish upstream movements.
For some species however, efficiency estimates were lower (Tab. 1), especially when accounting for different fish attempts. These results are clearly impacted by methodological limits inherent to studies considering riverine fish species. The main limit is the uncertainty in an individual’s motivation for approaching to cross the obstacle. Riverine fish are generally not obliged to migrate upstream to complete their biological cycle (unlike diadromous species), and individuals may only approach the weir, spent some time on habitats immediately downstream or on the ramp. These behaviours are considered in the efficiency study as an attraction or passage failures, resulting in an overall efficiency failure. This is notable in our study when comparing the results of the global evaluation with the evaluation by attempts, where some differences in passage efficiency appeared especially for barbel (91.7% vs 79.1%) and spirlin (52% vs 43.7%, Tab. 1). The logistic regression also showed lower passage performance and longer passage time for barbel in comparison with other species (Figs 6 and 7), which is somewhat incoherent with previously computed passage efficiencies (Tab. 1). This incoherence is explained by different analytical approaches (i.e. logistic regression model considered several attempts of the same individual independently, while the passage efficiency computation primarily averaged all attempts for each individual before computing a mean per species), but informs us about the behaviour of some individuals. It means that some barbel individuals entered the ramp several times, spent some time in it, crossed it or returned downstream. This displacement does not necessarily mean that these individuals had difficulty crossing the ramp, rather they appreciate and seek riffle habitats on the ramp (Keith et al., 2020). Ramp efficiency estimates, especially those based on different fish attempts, are clearly impacted by this limit and should rather be considered as minimal values.
4.3 Key factors related to ramp efficiency
In agreement with Forty et al. (2016) and Dodd et al. (2024), working on brown trout, fish length and river discharge significantly explained the variability observed in fishway attraction, passage and overall efficiencies. All three efficiency estimates increased with fish length, and Peff and overall Peff decreased with river flow (Fig 6). Moreover, larger individuals took less time to enter and cross the ramp than smaller ones (Fig. 7) and higher temperatures favoured rapid ramp crossings. If the migratory event of the studied species was mainly motivated by reproductive behaviour, it is obvious that larger (i.e. mature) individuals would enter and cross the structure more often. Faster crossing of larger individuals could also be related to swimming capacities, increasing with fish size (Cano-Barbacil et al., 2020) and water temperature (cold inhibits all metabolic processes including muscle performance, McKenzie, 2011) up to a threshold. In our study, the majority of fish, regardless of species, preferred low-flow conditions to enter and cross the structure (Fig. 6), taking advantage of easier and less energy-costly hydraulic conditions to move upstream (Fig. 2, the maximum flow velocity and volumetric dissipated power on the ramp being very favourable under low river flows).
4.4 Comparison with other fishway assessments
Some studies have summarised and compared the efficiencies of different upstream fishways (Bunt et al., 2012; Ovidio et al., 2020; Hershey, 2021; Sun et al., 2023) but they encountered several problems impeding rigorous comparability. Firstly, efficiency studies used different methodologies and different definitions of efficiency estimates (attraction, passage, overall efficiency). Secondly, there are still too few studies on freshwater fish movements (but see works cited in Ovidio et al., 2020) so that knowledge remains partial and concerns only a few species (barbel, chub, nase, roach). Finally, as the efficiency of a fishway can vary according to species (Tab. 1), body length, river discharge and temperature (Figs. 6 and 7), the comparison of the performances of different devices must take this information into account.
Moreover, many studies used only two antennas, i.e. the equivalents of our “Entrance” and “Exit” antenna (Calles and Greenberg, 2007; Chasserieau, 2020; Ovidio et al., 2020; Peter et al., 2022), making impossible to evaluate the attractiveness and overall efficiency (because of unknown number of already migrating fish). To overcome this problem, Hershey (2021), following Bunt et al. (2012), used the total number of tagged fish, instead of the number of already migrating fish detected downstream of the structure, and the attractiveness in their definition is the ratio between the number of fish entering the fishway and the total number of tagged fish. This method improves the comparability between studies but could still contain significant bias linked to species-specific (as observed in our study, Tab. 1) and context-dependent (as discussed above) migration rates of tested fish, potentially affecting fishway efficiency results (attractiveness and efficiency are consequently low for species with low migration rate). For this reason, we did not compare our results with these existing data, as potential comparison cannot be performed in a reliable manner.
Passage efficiency, which was 81.8% in our case when accounting for all individuals and the whole study period (between 52 and 100% depending on species) and 77% if different fish attempts were distinguished (between 43.7 and 100% depending on species), is more easily comparable. Hershey (2021), analysing the data from several studies and all species combined, reported lower passage efficiencies, between 44% and 64% on average, with no significant difference between natural and technical fishways. Using the data collected by Hershey (2021) and computing the passage efficiency as defined in the present study, 75% of the studied non-salmonid species showed a passage efficiency lower than 61.1% on natural-like fishways. Contrarily, Ovidio et al. (2020) showed higher performances on natural passes for barbel and chub: barbel crossed natural passes with 86–89% of success (compared to 7.1–66.7% for technical ones) and chub with 86–100% of success (compared to 25.8–94.3% for technical passes). Albayrak et al. (2018), studying an hybrid, natural and technical, fishway, reported passage efficiencies (recalculated to be comparable with our study) of 80.7% for barbel and 80.5% for chub. These efficiencies observed for barbel and chub on natural passes (Albayrak et al., 2018; Ovidio et al., 2020) are clearly compatible with our present results on the macroroughness ramp: 91.7% for barbel and 89.2% for chub (Tab. 1, results obtained during the whole study).
The passage efficiency of smaller species on the macroroughness ramp was lower but still considerable: 75% for gudgeon and 52% for spirlin. Current knowledge about fishways efficiencies for these species is poor. Weibel and Peter (2013), using electro-fishing within stretches of 50–200 m length directly upstream the ramps − fish tagging − downstream translocation to the bottom of the ramps − upstream re-sampling by electro-fishing of identical stretches to assess the performance of natural passes, reported a near-zero return rate for gudgeon and spirlin (between 0% and 1.3% of recaptures). The fish passes studied by Weibel and Peter (2013) had higher slopes (5.2% and 8.9%) than the ramp of the present study, which could have slowed down (or prevented) the progression of both species. Albayrak et al. (2018), in an hybrid, natural and technical, fishway, reported 0% passage efficiency for gudgeon (but only 1 individual detected downstream) but 81.6% for spirlin, which largely exceeds the performance of this species in the macroroughness ramp studied here. Note, however, that the fish tagged in the Albayrak et al. (2018) study were captured directly in the fishway and released downstream after tagging. They were therefore all already migrating individuals, not naïve, perhaps more motivated to cross the structure and all confirmed to be physically able to progress in the fishway, which could have increased the efficiency estimate (Hershey, 2021).
Noonan et al. (2012) performed a comparison of the overall efficiencies, as defined in our study, between different fishway devices. For non-salmonid fish communities, mean passage efficiency (± SE) regardless of fishway type was only 21.1% ± 3.7%. The highest efficiencies were reported for pool-and-weir fishways, with an average value not exceeding ~43%. In comparison to these results, the macroroughness ramp of the present study, with an overall passage efficiency of 53.6% accounting for all individuals and the whole study period (41.6% if different fish attempts were distinguished), ranks among the most efficient devices for riverine fish species.
The present study confirmed the high performance of the studied macroroughness ramp in terms of fish passage efficiency, for a variety of species and fish lengths. This ramp was however characterized by a gentle slope (3.6%), creating favourable hydraulic conditions for upstream progression. Although these results are encouraging, the performance of the same type of device with a steeper slope remains to be demonstrated.
Acknowledgments
The authors would like to thank SYRRTA (Syndicat Mixte Rhins Rhodon Trambouzan et Affluents which became Roannaise des Eaux), the company TAD and the Auvergne Rhône-Alpes Regional Division of the OFB for their kind welcome and help in the field. The authors thank also to two independent referees for their valuable comments that improved the original version of manuscript.
Supplementary Material
Supplementary Material 1. Illustrations of existing macroroughness ramps.
Supplementary Material 2. Details on data splitting.
Supplementary Material 3. Results from generalized linear models.
Access Supplementary MaterialReferences
- Albayrak PI, Maddahi M, Rachelly C, Detert M, Peter A, Milzow C, Tuhtan J, Schwarzwälder K, Ruther N, Doessegger A. 2018. TEST-CASE: HPP Schiffmühle, Switzerland. FIThydro report. [Google Scholar]
- Amaral S, Branco P, Romão F, Ferreira M, Pinheiro A, Santos J. 2021. Evaluation of low-head ramped weirs for a potamodromous cyprinid: effects of substrate addition and discharge on fish passage performance, stress and fatigue. Water 13: 765. [CrossRef] [Google Scholar]
- Amaral SD, Quaresma AL, Branco P, Romão F, Katopodis C, Ferreira MT, Pinheiro AN, Santos JM. 2019. Assessment of retrofitted ramped weirs to improve passage of potamodromous fish. Water 11: 2441. [CrossRef] [Google Scholar]
- Benitez J-P, Ovidio M. 2018. The influence of environmental factors on the upstream movements of rheophilic cyprinids according to their position in a river basin. Ecol Freshw Fish 660–671. [Google Scholar]
- Benitez J-P, Nzau Matondo B, Dierckx A, Ovidio M. 2015. An overview of potamodromous fish upstream movements in medium-sized rivers, by means of fish passes monitoring. Aquat Ecol 49: 481–497. [CrossRef] [Google Scholar]
- Britton JR, Pegg J. 2011. Ecology of European Barbel Barbus Barbus: implications for river, fishery, and conservation management. Rev Fish Sci 19: 321–330. [CrossRef] [Google Scholar]
- Bunt CM, Castro-Santos T, Haro A. 2012. Performance of fish passage structures at upstream barriers to migration. River Res Appl 28: 457–478. [CrossRef] [Google Scholar]
- Calles EO, Greenberg LA. 2007. The use of two nature-like fishways by some fish species in the Swedish River Emån. Ecol Freshw Fish 16: 183–190. [Google Scholar]
- Cano-Barbacil C, Radinger J, Argudo M, Rubio-Gracia F, Vila-Gispert A, García-Berthou E. 2020. Key factors explaining critical swimming speed in freshwater fish: a review and statistical analysis for Iberian species. Sci Rep 10: 18947. [CrossRef] [PubMed] [Google Scholar]
- Cassan L, Laurens P. 2016. Design of emergent and submerged rock-ramp fish passes. Knowl Manag Aquat Ecosyst 45. [Google Scholar]
- Chasserieau C. 2020. Suivi du franchissement piscicole de l’ouvrage du Pont SNCF de Marignier (Giffre). No. Rapport FDP74.20/02. [Google Scholar]
- Clay CH, Eng P. 1995. Design of Fishways and Other Fish Facilities, CRC Press, 248 p. [Google Scholar]
- Costa-Dias S, Sousa R, Lobón-Cerviá J, Laffaille P. 2009. The decline of diadromous fish in Western Europe inland waters: mains causes and consequence. Fish Manag Econ Perspect Nova Sci Publ 67–92. [Google Scholar]
- De Leeuw JJ, Winter HV. 2008. Migration of rheophilic fish in the large lowland rivers Meuse and Rhine, the Netherlands. Fish Manag Ecol 15: 409–415. [CrossRef] [Google Scholar]
- Directive 2000/60/CE. 2000. Directive 2000/60/CE du Parlement européen et du Conseil du 23 octobre 2000 établissant un cadre pour une politique communautaire dans le domaine de l’eau. J Off Communautés Eur 327: 1–72. [Google Scholar]
- Dodd JR, Cowx IG, Joyce DA, Bolland JD. 2024. Can’t pass or won’t pass: the importance of motivation when quantifying improved connectivity for riverine brown trout. J Fish Biol 104: 851–865. [CrossRef] [PubMed] [Google Scholar]
- Dorchies D, Chouet M, Grand F, Cassan L, Richard S, Courret D. 2022. Cassiopée: tools for designing fish crossing devices for upstream and downstream migrations, and hydraulic calculation tools for environmental and agricultural engineering. Version 4.17.0, https://doi.org/10.15454/TLO5LX, Recherche Data Gouv, V1. [Google Scholar]
- Forty M, Spees J, Lucas MC. 2016. Not just for adults! Evaluating the performance of multiple fish passage designs at low-head barriers for the upstream movement of juvenile and adult trout Salmo trutta. Ecol Eng 94: 214–224. [CrossRef] [Google Scholar]
- Fuller MR, Doyle MW, Strayer DL. 2015. Causes and consequences of habitat fragmentation in river networks: River fragmentation. Ann N Y Acad Sci 1355: 31–51. [CrossRef] [PubMed] [Google Scholar]
- Grimardias D, Chasserieau C, Beaufils M, Cattanéo F. 2022. Ecological connectivity of the upper Rhône River: Upstream fish passage at two successive large hydroelectric dams for partially migratory species. Ecol Eng 178: 106545. [CrossRef] [Google Scholar]
- Hershey H. 2021. Updating the consensus on fishway efficiency: A meta-analysis. Fish Fish 22: 735–748. [CrossRef] [Google Scholar]
- Keith P, Poulet N, Denys G, Changeux T, Feunteun E, Persat H. 2020. Les poissons d’eau douce de France, Paris, 704 p. [Google Scholar]
- Larinier M. 1998. Upstream and downstream fish passage experience in France. In Jungwirth M, Schmutz S, Weiss S, eds. Fish migration and fish bypasses, Oxford, England. 127–145. [Google Scholar]
- Larinier M, Courret D, Gomes P. 2006. Guide technique pour la conception des passes “naturelles.” No. Rapport GHAAPPE RA.06.05-V1. [Google Scholar]
- Latham J, Collen B, McRae L, Loh J. 2008. The living planet index for migratory species: an index of change in population abundance. Final Report for the Convention on the Conservation of Migratory Species, London. [Google Scholar]
- Lucas MC. 2000. The influence of environmental factors on movements of lowland-river fish in the Yorkshire Ouse system. Sci Total Environ 251-252: 223–232. [CrossRef] [PubMed] [Google Scholar]
- Lucas MC, Baras E, Thom TJ, Duncan A, Slavik O. 2001. Migration of Freshwater Fishes, 420 p. [Google Scholar]
- McKenzie DJ. 2011. SWIMMING AND OTHER ACTIVITIES | Energetics of Fish Swimming. In: Farrell AP, ed. Encyclopedia of Fish Physiology Academic Press, San Diego. 1636–1644. [Google Scholar]
- Miranda FC, Cassan L, Laurens P, Tran TD. 2021. Study of a Rock-Ramp Fish Pass with Staggered Emergent Square Obstacles. [Google Scholar]
- NF EN 17233. 2021. Water quality − Guidance for assessing the efficiency and related metrics of fish passage solutions using telemetry. The European Committee for Standardization CEN: Brussels, Belgium. [Google Scholar]
- Nilsson C. 2005. Fragmentation and Flow Regulation of the World’s Large River Systems. Science 308: 405–408. [CrossRef] [PubMed] [Google Scholar]
- Noonan MJ, Grant JWA, Jackson CD. 2012. A quantitative assessment of fish passage efficiency. Fish Fish 13: 450–464. [CrossRef] [Google Scholar]
- Oberdorff T. 2022. Time for decisive actions to protect freshwater ecosystems from global changes. Knowl Manag Aquat Ecosyst 423: 19. [CrossRef] [EDP Sciences] [Google Scholar]
- Ovidio M, Sonny D, Watthez Q, Goffaux D, Detrait O, Orban P, Nzau Matondo B, Renardy S, Dierckx A, Benitez J-P. 2020. Evaluation of the performance of successive multispecies improved fishways to reconnect a rehabilitated river. Wetl Ecol Manag 28: 641–654. [CrossRef] [Google Scholar]
- Peňáz M, Baruš V, Prokeš M, Homolka M. 2002. Movements of barbel, Barbus barbus (Pisces: Cyprinidae). Folia Zool 51: 55–66. [Google Scholar]
- Peter A, Schoelzel N, Wilmsmeier L, Albayrak I, Bravo-Córdoba FJ, García-Vega A, Fuentes-Pérez JF, Valbuena-Castro J, Carazo-Cea O, Escudero-Ortega C, Sanz-Ronda FJ, Calluaud D, Pineau G, David L. 2022. The attractiveness of fishways and bypass facilities. In Rutschmann P, Kampa E, Wolter C, Albayrak I, David L, Stoltz U, Schletterer M, eds. Novel Developments for Sustainable Hydropower. Cham: Springer International Publishing, 61–81. [Google Scholar]
- Prchalová M, Horky P, Slavík O, VetešNíK L, Halacka K. 2011. Fish occurrence in the fishpass on the lowland section of the River Elbe, Czech Republic, with respect to water temperature, water flow and fish size. Folia Zool 60: 104–114. [CrossRef] [Google Scholar]
- Puijenbroek PJTM, Buijse AD, Kraak MHS, Verdonschot PFM. 2019. Species and river specific effects of river fragmentation on European anadromous fish species. River Res Appl 35: 68–77. [CrossRef] [Google Scholar]
- R Core Team. 2019. R: A language and environment for statistical computing. R Foundation for Statistical Computing, Vienna, Austria. URL https://www.R-project.org/. [Google Scholar]
- Reid AJ, Carlson AK, Creed IF, Eliason EJ, Gell PA, Johnson PTJ, Kidd KA, MacCormack TJ, Olden JD, Ormerod SJ, Smol JP, Taylor WW, Tockner K, Vermaire JC, Dudgeon D, Cooke SJ. 2019. Emerging threats and persistent conservation challenges for freshwater biodiversity. Biol Rev Camb Philos Soc 94: 849–873. [CrossRef] [PubMed] [Google Scholar]
- Seliger C, Zeiringer B. 2018. River Connectivity, Habitat Fragmentation and Related Restoration Measures. In Schmutz S, Sendzimir J, eds. Riverine Ecosystem Management: Science for Governing Towards a Sustainable Future, Springer International Publishing, Cham., 171–186. [Google Scholar]
- Sun J, Tan J, Zhang Q, Shen Y, Shi J, Zhang H, Shi X. 2023. Attraction and passage efficiency for salmonids and non‐salmonids based on fishway: A meta‐analysis approach. River Res Appl rra. 4194. [Google Scholar]
- Vilizzi L, Copp GH, Carter MG, Peňáz M. 2006. Movement and abundance of barbel, Barbus barbus, in a mesotrophic chalk stream in England. Folia Zool 55: 183–197. [Google Scholar]
- Weibel D, Peter A. 2013. Effectiveness of different types of block ramps for fish upstream movement. Aquat Sci 251–260. [Google Scholar]
Cite this article as: Tomanova S, Courret D, Richard S, Mercier O, Guillemin A, Labedan M, Sagnes P. 2025. Efficiency of a macroroughness block ramp in reducing the impact of low-head dams on riverine fish dispersion. Knowl. Manag. Aquat. Ecosyst., 426, 5. https://doi.org/10.1051/kmae/2024022
All Tables
Species, number and total length of tagged fish, migration rate (%) and total length of migrating individuals, along with efficiency estimates of the macroroughness ramp computed for the whole survey period and when accounting for different fish attempts (na: no tagged individuals in the sector).
Different passage times for barbel, chub, gudgeon, spirlin and all other species together.
All Figures
|
Fig. 1 (a) and (b) Location of the study site on the Rhins River with indications of the fished river sectors (S1–S6), (c) rock weir located between S3 and S4, (d) bridge stabilization weir with macroroughness block ramp (view from downstream), (e) top view of two upstream ramp sections separated by a rest pool, showing two different bed levels on either side of the ramp. |
| In the text | |
|
Fig. 2 Hydraulic characteristics of the studied macroroughness ramp: a) Discharge (Q) distribution between the ramp and the weir on the study site, and b) maximum flow velocity in jets between macroroughness blocks along with volumetric dissipated power, as a function of water depth on the ramp. Hydraulic characteristics were computed using the Cassiopée software package (Dorchies et al., 2022). Velocities were not computed once the macroroughness blocks were submerged. Percentages associated with the discharge Q (%) correspond to non-exceedance frequencies. |
| In the text | |
|
Fig. 3 Discharge and water temperature of the Rhins River during the study with indication of tagging days. |
| In the text | |
|
Fig. 4 Fish activity at the study site (for all species together and for the four most abundant species, separately per tagging year) as the number of fish detected daily (different individuals) on three RFID antennas. |
| In the text | |
|
Fig. 5 Number of tagged fish at each river sector (S1–S6), and number (and proportion, %) of fish presenting an upstream movement (i.e., detected at least once at the River antenna) during the two-year survey (see Fig. 1b for sector locations and Table 1 for details per species). |
| In the text | |
|
Fig. 6 Predicted probabilities of ramp attraction efficiency (Aeff), passage efficiency (Peff) and overall efficiency (overall Peff) as a function of fish length, river discharge, water temperature and species, resulted from mixed linear models for Aeff and overall Peff, and from logistic generalized linear model for Peff (the significance of each variable was tested with ANOVA, see Suppl. Material for details). |
| In the text | |
|
Fig. 7 Predicted approach time (Tapp), ramp passage time (Tpas) and overall passage time (Tall) as a function of fish length, river temperature, species and river discharge, resulted from generalized linear model (significance of each variable was tested with ANOVA, see Suppl. Material for details). |
| In the text | |
Current usage metrics show cumulative count of Article Views (full-text article views including HTML views, PDF and ePub downloads, according to the available data) and Abstracts Views on Vision4Press platform.
Data correspond to usage on the plateform after 2015. The current usage metrics is available 48-96 hours after online publication and is updated daily on week days.
Initial download of the metrics may take a while.