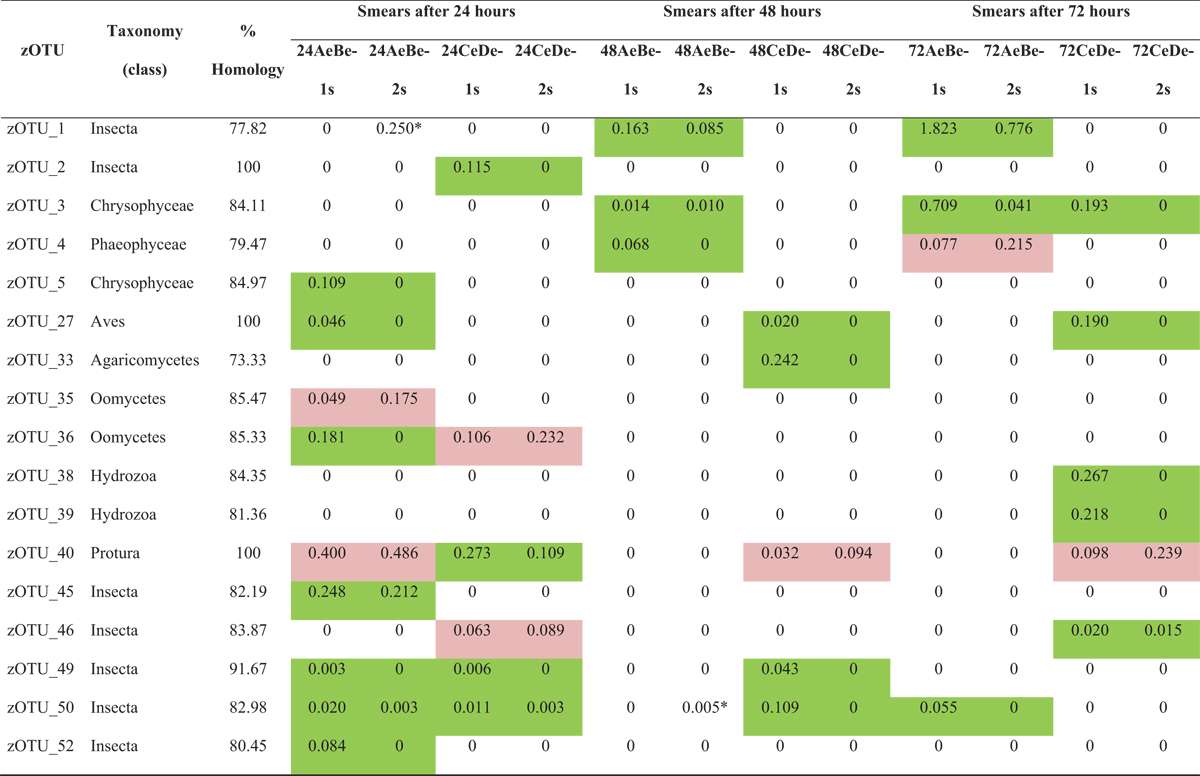
Table 2
Relative abundance (%) of zOTUs with the most relevant taxonomic level identified on the first or on the first and second fish smear. Reduction in the number of DNA copies from the first to the second smear is marked in green. Increase in DNA copies from the first to the second smear is marked in pink. Abbreviations: AeBe-1s − pooled sample from experimental aquaria Ae and Be, first smear; AeBe-2s − pooled sample from experimental aquaria Ae and Be, second smear; CeDe-1s − pooled sample from experimental aquaria Ce and De, first smear; CeDe-2s − pooled sample from experimental aquaria Ce and De, second smear;

Current usage metrics show cumulative count of Article Views (full-text article views including HTML views, PDF and ePub downloads, according to the available data) and Abstracts Views on Vision4Press platform.
Data correspond to usage on the plateform after 2015. The current usage metrics is available 48-96 hours after online publication and is updated daily on week days.
Initial download of the metrics may take a while.


