Fig. 2
Download original image
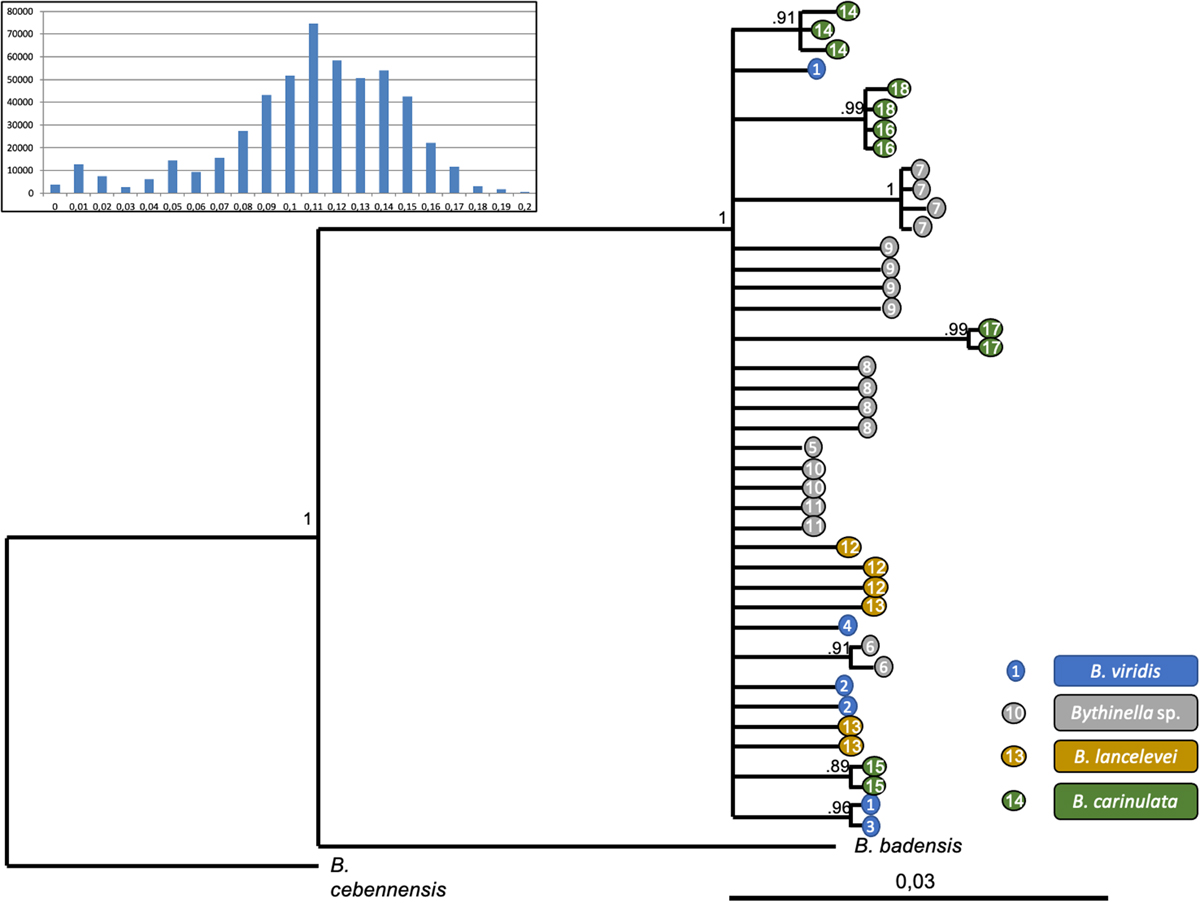
Phylogenetic tree based on Bayesian inference, using the COI gene. Only posterior probabilities > 0.8 are shown. Numbers refer to the sampled localities (Fig. 1, Tab. 1). Scale bar (0.3) indicate the minimum inter-specific genetic divergence for the COI gene (barcoding gap). Top left: distribution of the genetic divergence within the genus Bythinella illustrating the barcoding gap.
Current usage metrics show cumulative count of Article Views (full-text article views including HTML views, PDF and ePub downloads, according to the available data) and Abstracts Views on Vision4Press platform.
Data correspond to usage on the plateform after 2015. The current usage metrics is available 48-96 hours after online publication and is updated daily on week days.
Initial download of the metrics may take a while.