| Issue |
Knowl. Manag. Aquat. Ecosyst.
Number 426, 2025
Biological conservation, ecosystems restoration and ecological engineering
|
|
|---|---|---|
| Article Number | 18 | |
| Number of page(s) | 9 | |
| DOI | https://doi.org/10.1051/kmae/2025011 | |
| Published online | 13 June 2025 | |
Research Paper
Brown trout passage efficiency through a baffle series in a long culvert, assessed by fish translocation and by natural migration monitoring
1
Office français de la biodiversité, Direction de la recherche et de l'appui scientifique, Pôle R&D écohydraulique, OFB-IMFT-PPRIME, 2 allée prof Camille Soula, Toulouse, France
2
Cerema − Agence de Clermont-Ferrand, 8-10 rue Bernard Palissy, 63017 Clermont-Ferrand, France
3
Office français de la biodiversité, Direction régionale Auvergne-Rhône-Alpes, 9 allée des eaux et forêts − Marmilhat Sud 63370 Lempdes, France
* Corresponding authors: This email address is being protected from spambots. You need JavaScript enabled to view it.
; This email address is being protected from spambots. You need JavaScript enabled to view it.
Received:
4
February
2025
Accepted:
16
April
2025
Abstract
The passage efficiency of brown trout through a 73 m long culvert equipped with 10 notched baffles, was studied using PIT telemetry and two approaches: (1) fish translocation from upstream to downstream of the culvert, (2) monitoring of the natural migration of downstream individuals. The migration rate of translocated individuals was higher (90%) than that of naturally migrating individuals (42%). The attraction efficiency was assessed at 94.4% and 93.1%, the passage efficiency at 94.7% and 83.3%, and the overall passage efficiency at 89.4% and 77.6% for translocated and naturally migrating individuals respectively. The majority of individuals passed through the culvert (overall passage time) fairly rapidly but the approach times were longer for translocated individuals, impacting their overall passage times (median value 24 h 40 min vs. 11 h 16 min for naturally migrating fish). For translocated fish, large individuals crossed the structure faster than small ones. For fish in natural migration, individuals that passed through the structure were smaller than those that did not. For translocated fish only, the approach time decreased with increasing water level. The majority of trout approached the culvert during the day and the luminosity changes at its entrance and exit did not seem to be a limiting factor for their passage.
Key words: Fish passage / road-watercourse intersections / barrier mitigation / RFID
© S. Tomanova et al., Published by EDP Sciences 2025
 This is an Open Access article distributed under the terms of the Creative Commons Attribution License CC-BY-ND (https://creativecommons.org/licenses/by-nd/4.0/), which permits unrestricted use, distribution, and reproduction in any medium, provided the original work is properly cited. If you remix, transform, or build upon the material, you may not distribute the modified material.
1 Introduction
Integrating streams and rivers into road or railway projects has long been thought of as a simple matter of satisfying hydraulic issues and flood risks. These intersections between networks were developed as hydraulic structures (e.g. culverts) guaranteeing the sustainability of roads or railways, with little concern for other issues. In particular, ecological functions provided by watercourses (migratory corridors, living environments for many species, etc.) were neglected. As a result, numerous road-watercourse intersections contribute to habitat fragmentation (Forest Service Stream-Simulation Working Group, 2008; Goerig and Castro-Santos, 2017) threatening freshwater biodiversity (Fuller et al., 2015; Brauer and Beheregaray, 2020).
Hydraulic structures, built under the transport infrastructures, can act as physical and/or behavioral barriers for aquatic species, particularly for fish. Low water levels, high current speeds and/or significant falls at the downstream outlet can constitute physically impassable barriers for many fish species or individuals (Larinier, 2002; Forest Service Stream-Simulation Working Group, 2008; Burford et al., 2009; Newbold et al., 2014; and see citations in Goerig and Castro-Santos, 2017). Strong changes in luminous intensity at the entrance (and/or exit) of a hydraulic structure can act as a behavioral barrier, particularly when the structure is long and presents a very dark central part during the day. These conditions can discourage or frighten some fish species with diurnal activity (Keep et al., 2021), and result in hesitation by fish at the entrance/exit, in long passage times or in progress failure for some individuals.
In Europe, good ecological status for rivers (Directive 2000/60/CE, 2000) requires good ecological continuity conditions and, consequently, numerous culverts and hydraulic structures impacting free fish movements need to be improved in terms of fish passage. Some hydraulic structures under transport infrastructures have already been equipped with devices facilitating fish passage. Baffles and other types of deflectors are usually used in culverts (Larinier, 2002; Gigleux and De Billy, 2013) to ensure a sufficient water depth at any time, allowing the progression of large fish, along with low velocity areas where the fish can rest before moving through the next high velocity zone (Newbold et al., 2014). However, the biological efficiency of such devices, potentially able to solve or limit the impacts of such physical barriers (but not the behavioral impact), is still poorly documented in situ (but see Baker, 2014; Caudron et al., 2020).
To fill this gap, we used PIT (Passive Integrated Transponder) telemetry to monitor the movements of brown trout (Salmo trutta fario, Linnaeus, 1758) individuals through a 73 m long hydraulic structure equipped with baffles perpendicular to the flow and presenting alternating notches. Two methodological approaches were used to evaluate the passage success of trout through this device: (1) the translocation of individuals that were captured upstream of the culvert, tagged and then released downstream of the culvert, (2) the monitoring of naturally migrating individuals that had been living downstream of the culvert. Fish translocation has been previously used in several studies to evaluate the effectiveness of fishways (Weibel and Peter, 2013; Dodd et al., 2017; Ovidio et al., 2020). This approach can efficiently increase the number of migrating individuals (a high return rate can be observed especially for trout, Caudron et al., 2020) and usually provides the results in a very short time after releasing the fish. The concomitant use of these two methodological approaches allowed us to easily compare their respective results.
2 Material and methods
2.1 Study site
The Clidane River, with its source at an altitude of 951 m, is a 22 km long small-sized river in the Dordogne catchment (France). It is inhabited by brown trout (Salmo trutta fario), bullhead (Cottus sp.) and minnow (Phoxinus sp.) in its downstream part, and by brown trout alone in its upstream part. The Clidane River runs under the D2068 road (dual carriageway, 45°39'1.86”N, 2°38'37.54”E) and a small country road through a culvert 73.60 m long, approx. 5 m high and 4.80 m wide (Fig. 1) with a 1.6% slope. To allow fish passage, the culvert is equipped with 10 identical notched baffles (see Fig. 1), 7.8 m distant from each other, which raise the water level and reduce flow velocities by forming successive pools. This type of device concentrates the flow in the notches at low discharges, stabilizes the bottom substrate and provides resting areas for fish in the pools during their upstream movements. For example, in June 2018, at a discharge of 330 L/s, the water level ranged between 30 and 45 cm in the pools (depending on patches of sediment deposition), 26 cm on average in the notches, with 13–20 cm drops between pools, and the mean water velocity was 0.96 m/s in the notches. These conditions correspond to very low volumetric power dissipation (<50 W/m3) and are not limiting for trout passage (Larinier et al., 2006; Baudoin et al., 2015). A two-level shelf runs along the left bank to allow small wild fauna to pass through the structure.
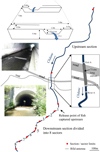 |
Fig. 1 Study site on the Clidane River. The fished zones (upstream and downstream of the culvert) are delimited by the red dots. The dimensions of the baffles are given at the top. The two photos show the inside view of the culvert from downstream and its downstream entrance. The locations of the 3 PIT-detection flatbed antennas (River A, Entrance A and Exit A) are given in the right-hand box. |
2.2 Fish and environmental survey
Fish movements through the culvert were studied using PIT telemetry (following the recommendations of NF EN 17233, 2021). Three flatbed half-duplex PIT detection antennas (connected to CIPAM or Oregon receivers with storage capacity) were installed at the site (Fig. 1): one on the river bottom downstream of the culvert (River antenna, detecting upstream migrating fish), one at the culvert downstream entrance (Entrance antenna, just upstream of the first baffle) and one at the culvert upstream exit (Exit antenna, detecting fish successfully passing through the entire device). Fish detection above the antenna cable was effective within a range of 23–30 cm (depending on the antenna) for 12 mm PIT tags and exceeded 80 cm for 23 mm PIT tags. During high flow events, the antennas could not detect 12 mm PITs in the whole water column. However, we considered them still efficient to detect upstream movements because it's very likely that small fish, tagged with these small PITs, used the more favorable hydraulic conditions of the near-bottom layer to move upstream.
The fish were captured on two occasions (May 2019 and May 2020) by electrofishing (DREAM Electronique© backpack electrofisher). Two different strategies were applied: (1) fish were captured upstream of the culvert, tagged, translocated and released 300 m downstream of the culvert, (2) fish were captured between 250 and 1000 m downstream of the culvert, on eight river sectors (of about 100 m in length, except sector #5 which was shorter, see Fig. 1), tagged and released on their capture sector. All captured individuals in good general condition were anaesthetized (3–5 min in a bath with 1:10 clove oil ethanol solution, in concertation of 3–4 ml/10 L of water), measured (total length and weight) and tagged with a PIT tag inserted into the body cavity (12 mm PITs were used for fish up to 130 mm in total length, 23 mm PITs for larger ones). The surgical procedure lasted a few seconds. Tagged fish were then kept in a pool with oxygenated water, where they recovered and swam normally after a few minutes. All the experimental procedures of this study were validated by the Ethics Committee No.073 and received the authorization of the French Ministry for Research.
The fish movements on the study site were recorded from May 2019 to June 2021. During the fish survey, the water levels were recorded every 15 min upstream of the culvert by an ultrasonic probe (Ijinus ©) (Fig. 2). The water temperature was also measured but unfortunately, due to the malfunction of the probe, the data are not available. During the study, several breakdowns impacted the fish monitoring, with full PIT-detection antennas functioning 77% of the time (Fig. 2). Consequently, complementary mobile fish detections (with an Oregon © RFID Backpack Reader and a GPS device to locate detections) were carried out on the upstream section of the culvert to check if some individuals had gone through the structure without being detected. Four mobile surveys were carried out: on 06/25/2019 and 06/17/2020 (following an antenna malfunction that occurred after the fish tagging), on 01/23/2020, and at the end of the study on 04/27/2021. This improved the quality of data by detecting two additional individuals that had crossed the culvert without being recorded on the Exit antenna.
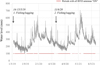 |
Fig. 2 Water level variation upstream of the culvert and periods with all PIT-detection antennas operating (red line) during the study. |
2.3 Data analysis
All results were considered separately for translocated and naturally migrating fish. The migration rate was assessed as the proportion of tagged fish detected in upstream movement, i.e. on the River antenna (defined as “available fish” following NF EN 17233, 2021). The potential difference in total length between migrating and non-migrating (undetected) individuals during the study were tested with a Wilcoxon test. Note that, when the fish length was used in an analysis, we used only records from the first year after fish tagging in order to limit the bias due to fish growth during the study.
Fish passage was considered successful if the individual reached the upstream-most antenna (Exit antenna) before the end of the study. Three efficiency metrics, defined in the European guideline (NF EN 17233, 2021), were calculated:
Attraction efficiency (Aeff): the ratio between the number of fish entering the culvert (Entrance antenna) compared to the number of migrating fish (detected on the River antenna) (N.B.: attraction efficiency in the present work is in fact a combination of the attraction and entrance efficiencies defined in the European guideline);
Passage efficiency (Peff): the ratio between the number of fish leaving the culvert (Exit antenna) and those that entered it (Entrance antenna); and
Overall efficiency (overall Peff): the ratio between the number of fish leaving the culvert (Exit antenna) and the number of migrating fish (River antenna).
For each detected individual, three passage times were computed:
Approach time (Tapp): the duration between the first detection at the River antenna and the first detection at the Entrance antenna;
Passage time (Tpas): the duration between the first detection at the Entrance antenna and the first detection at the Exit antenna;
Overall passage time (Tall): the duration between the first detection at the River antenna and the first detection at the Exit antenna.
The potential effects of fish size and water level (hourly averaged) on passage success (or failure) were assessed by non-parametric tests (Wilcoxon or Kruskal-Wallis test). Their respective influences on the different passage times (Tapp, Tpas and Tall) were examined using a Pearson correlation. The individual total length considered in this analysis was the value measured at the time of tagging. To avoid any bias due to fish growing, individuals that crossed the structure the second year after their tagging were excluded from this analysis. For each individual, the time of day was assigned to each first detection at the River, Entrance and Exit antenna according to the geographical coordinates of the site and the date and time of the recording using the get_DayTimeLimits function of the RchivalTag R package. Four periods were considered: dawn (between nautical dawn and sunrise), day (between sunrise and sunset), dusk (between sunset and nautical dusk) and night (between nautical dusk and dawn). The distributions of passages during these periods at the different antennas (River, Entrance, Exit) were examined and tested with a Chi2 test. We also used a Kruskal-Wallis test to see if there was a difference in approach time or in passage time with respect to the period of day during which the fish moved (when the fish was first detected at the River or Entrance antenna respectively). All statistical analyses and graphical outputs were carried out using the statistical program R (R Core Team, 2019).
3 Results
3.1 Migration rate and periods
A total of 358 brown trout were tagged during the study (Tab. 1): 137 individuals (38%) captured in the downstream section and 221 (62%) in the upstream one (before being translocated and released downstream). Tagged fish measured between 82 mm and 255 mm in total length, and were smaller in the downstream section (mean body length of 141 mm for downstream individuals against 152 mm for upstream ones). Migrating fish (i.e. detected on the River antenna) did not differ in size compared to undetected individuals (t test: t = –0.65, p = 0.52 for translocated individuals, and t = 0.36, p = 0.72 for individuals in natural migration).
89.6 % of translocated individuals, between 97 and 255 mm of total length, were detected at the downstream end of the culvert (i.e. by the River antenna), usually a very short time after their release (Fig. 3a): half of them less than 2 days later, 75% of them less than 34 days. 42.3% of tagged individuals in the downstream section, between 82 and 224 mm of total length, were detected in upstream migration over the study period. Their movements were mainly observed in autumn (between September and December, Fig. 3b), which corresponds to the reproduction period of the species.
Number (No), total length (mm) and weight (g) of tagged fish.
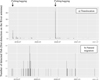 |
Fig. 3 Timing of the first fish presentation downstream of the culvert after tagging, for a) translocated fish and b) fish in natural migration, with indication of fishing/tagging days. |
3.2 Passage efficiency and time
The two methodological approaches provided fairly similar efficiency results (Tab. 2): Aeff was 94.4% and 93.1% for translocated and naturally migrating individuals respectively, Peff was 94.7% and 83.3% respectively, resulting in overall Peff of 89.4%, and 77.6%. Fish length and water level did not affect the overall efficiency (in terms of success vs. failure) for translocated individuals (Wilcoxon tests, p > 0.05). For individuals in natural migration, we observed an effect of the fish size (Kruskal-Wallis test to manage ex-aequo cases, χ2 = 5.23, p = 0.02), with larger individuals being more likely to abandon their upstream progression. Water level had no effect on the passage success of individuals in natural migration (Kruskal–Wallis test, p > 0.05).
The assessment of the passage times differed between the two methodological approaches. The Tall required to enter and go through the culvert (Tab. 2) were shorter for individuals in natural migration. 25% of these individuals passed through the structure in less than 40 minutes, 75% in less than 42 hours. Although Tpas did not differ significantly between translocation versus natural migration (median Tpas = 7 h 02 min vs. 5 h 38 min respectively, Wilcoxon test, p > 0.05), a significant difference was found in Tapp (median Tapp = 1 h 50 min for translocated individuals vs. 11 min for naturally migrating ones, Wilcoxon test, W = 4463, p < 0.001). Translocated fish usually spent more time downstream of the culvert before entering it, which had a direct consequence on Tall which was longer for translocated individuals (median Tall = 24 h 40 min for these vs. 11 h 16 min for naturally migrating fish, Wilcoxon test, W = 3583, p = 0.01).
Considering translocated fish only, large individuals generally passed through the culvert more quickly than small ones (Pearson correlation coefficient r = –0.27, p < 0.001). The water level (min–max = 156–507 mm, recorded at the time of the first individual presentation on the River antenna) influenced the passage time: Tapp decreased with increasing water level (r = –0.34, p < 0.001) resulting in a decrease of Tall (r = –0.26, p < 0.001). These effects were not significant for individuals in natural migration (p > 0.05, but note a lower number of observations).
The first approach downstream of the culvert (first fish detection at the River antenna) was recorded during the day for 75.4% of translocated individuals and for 78.3% of individuals in natural migration (Fig. 4). 13.4% and 17.4% of first approaches, respectively, were recorded at night, 11.2% and 4.3% at dusk or dawn (note that the “dawn” and “dusk” periods were grouped together due to the low number of observations). The first fish detections on the other antennas were distributed in a fairly similar way without any significant difference (Chi2 tests on the distribution of detections between River vs. Entrance, Entrance vs. Exit and River vs. Exit, all with p > 0.05). We only noted that fish in natural migration, in comparison with translocated ones, were rarely recorded at dusk and dawn. The approach time into the culvert Tapp did not differ following the period of the first fish presentation on the River antenna (dawn, dusk, day, night, Kruskal-Wallis tests, with p > 0.05). Likewise, the period at which the fish entered the culvert did not influence the passage time Tpas through the culvert (all Kruskal–Wallis tests, with p > 0.05).
Migration rate, efficiency metrics and passage times, separately for translocated fish and fish in natural migration.
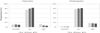 |
Fig. 4 Proportions of the first individual detections (%) at the different antennas, according to the period of day, for translocated fish (left) and fish in natural migration (right). |
4 Discussion
4.1 Functionality of the fish crossing device
Hydraulic structures can act as physical barriers, creating sections with high water speeds and/or shallow water depths, impeding fish progression. Gregory et al. (2004) had already shown the benefit of the presence of baffles in a hydraulic structure, placed perpendicularly, at 30 or 45° relative to the flow direction, on the progression of salmonids, but without being able to compute the exact gain in fish passage efficiency. Studies by Newbold et al. (2014) in an outdoor flume showed that baffle installation in a culvert can considerably improve overall passage efficiency for eels (an increase from 28% to 84% was observed during their experiments). Our field study, based on the monitoring of 198 translocated trout and of 58 individuals in natural migration, of various body lengths, completed previous works by assessing the passage efficiency through a long hydraulic structure (73 m) equipped with perpendicular baffles. The observed Aeff (94.4% after translocation and 93.1% for natural migrating behavior), Peff (94.7% and 83.3%, respectively) and overall Peff (89.4% and 77.6% respectively) reached high values, whichever the methodological approach used (Tab. 2). The most rapid passage times were only a few minutes, but overall, individuals in natural migration crossed the structure more quickly (median time 11 h) than translocated fish (median time 24 h). These results clearly confirm the advantage of this type of equipment for making hydraulic structures passable for trout.
Body length seemed to influence the passage success of individual fish in natural migration but in the opposite way to what was observed in previous works on other fishway solutions (Bravo-Córdoba et al., 2022; Tomanova et al., 2025). Smaller individuals passed through the culvert better than larger ones. Passage success was therefore not directly linked to the swimming abilities of individuals, known to be weaker for small fish (Ojanguren and Braña, 2003; Tudorache et al., 2008). On the other hand, water depth in the culvert did not seem to be limiting for larger individuals under the studied hydraulic conditions, since no influence of water level on passage success/failure was detected. The only hypothesis to explain this result is a lower motivation of large fish to migrate (Goerig and Castro-Santos, 2017). Knowing that favorable spawning areas were also present downstream of the culvert, it is possible that the larger individuals approached the structure for another reason (e.g. a movement within the home range). There is also a possibility of predation of the larger individuals before passing through the culvert by otters (Lutra lutra), a species detected within the study area, with dietary preferences for fish ≥120–250 mm (Sittenthaler et al., 2019).
Hydraulic structures can also act as behavioral barriers for fish exhibiting diurnal activity, due to potential strong changes in luminosity between the external environment and the entrance or the exit of the structure (Keep et al., 2021). In our study, as in Murphy (2020) on Brook trout, the majority of the studied individuals approached the culvert during the day (Fig. 4) but did not hesitate to enter or exit the culvert. The attraction efficiency Aeff of the structure was very high (>90%, Tab. 1) and the majority of trout approached, entered and exited the culvert during the day (Fig. 4). Fish approaching during the day did not show a longer approach or passage times than those approaching at night or at dawn/dusk. However, the rich riparian vegetation could have been helpful in our study, making the luminosity changes fairly gradual, which could have reduced or prevented any hesitation in the fish to enter or leave the culvert. The majority of crossing events observed during the day confirmed that migrating trout did not favor moments of total darkness to pass through the culvert, but seemed to prefer keeping visual cues to move along the structure (Fjeldstad et al., 2018).
4.2 Efficiency assessment of passage devices by translocation vs. natural migration
Two methodological approaches were applied in our study: (1) monitoring individuals translocated from upstream to downstream of the structure and (2) monitoring the natural migration of individuals living downstream, allowing a direct comparison of results provided by these two methods.
Fish translocation was previously used in several studies to evaluate the effectiveness of fishways (Weibel and Peter, 2013; Dodd et al., 2017; Ovidio et al., 2020). This approach generally ensures a sufficient number of tested individuals (a high return rate is usually observed, which was confirmed by the 90% return rate in our study) and provides the results in a very short time after the fish release (in the present study, 75% of the translocated individuals migrated within less than 34 days after the release). However, the major disadvantage of this method is that the environmental (e.g. hydraulic) conditions during these “forced” movements may not be representative of conditions during the natural migration period, potentially producing biased results. In the present study, we did not observe major differences between passage efficiency values using translocated individuals and values for naturally migrating ones. Nevertheless, the tested hydraulic conditions (summarized here by the water level) were comparable between these two experimental groups (min–max water level: 156–507 mm vs. 135–440 mm respectively, Wilcoxon tests, p > 0.05).
Significant differences however appeared on the calculations of the transit times (Tab. 2). Tapp values (which reflect the attractiveness of the structure and possible fish hesitation at the entrance) were higher for translocated individuals (75th percentile = 24 h) than for naturally migrating ones (75th percentile = approx. 25 min). These results obviously impacted the Tall values of both groups. This fish hesitation at the entrance of the culvert could be linked to a post-fishing/tagging/translocation disorientation, and the resulting longer approach time could wrongly point to an attractiveness failure or a problem at the entrance of the culvert. Assessments of fish passage efficiencies based solely on the translocation of individuals should therefore consider this possible bias.
4.3 Conclusion and perspectives
The studied series of baffles in a long culvert was quite well designed to facilitate trout upstream migration. Such feedback must now be gathered from other types of fish passage devices installed inside diverse hydraulic structures, in order to provide good dimensioning criteria for these devices, adapted to the local context (e.g. discharge, species of interest). It would also be very useful to extend these studies to include other potamodromous species, in particular species with lower swimming capacities than trout, a species which presents very good swimming and jumping capabilities.
Acknowledgments
The authors thank Mr. Battut, Departmental Council of Puy-de-Dôme, and the Auvergne Rhône-Alpes Regional Division of the OFB for their kind welcome and help in the field. The authors also thank to John Kerr for proofreading the article, and to two independent referees for their valuable comments, which improved the original version of the manuscript.
References
- Baker C. 2014. Testing the Effectiveness of Fish Passage Solutions. No. Horizons Report 2015/EXT1418. [Google Scholar]
- Baudoin J-M., Burgun V, Chanseau M, Larinier M, Ovidio M, Sremski W, Steinbach P, Voegtle B. 2015. Assessing the passage of obstacles by fish. Concepts, design and application. Avalaible on https://orbi.uliege.be/handle/2268/183173. [Google Scholar]
- Brauer CJ, Beheregaray LB. 2020. Recent and rapid anthropogenic habitat fragmentation increases extinction risk for freshwater biodiversity. Evol Appl 13: 2857–2869. [CrossRef] [PubMed] [Google Scholar]
- Bravo-Córdoba FJ, Fuentes-Pérez JF, García-Vega A, Peñas FJ, Barquín J, Sanz-Ronda FJ. 2022. Brown trout upstream passage performance for a fishway with water drops between pools beyond fish passage design recommendations. Water 14: 2750. [CrossRef] [Google Scholar]
- Burford DD, McMahon TE, Cahoon JE, Blank M. 2009. Assessment of trout passage through culverts in a large Montana drainage during summer low flow. North Am J Fish Manag 29: 739–752. [CrossRef] [Google Scholar]
- Caudron A, Bergé J, Richard A. 2020. La technologie RFID pour évaluer le franchissement piscicole d'une buse aménagée de grande dimension. Sci Eaux Territ 2020: 1–7. [Google Scholar]
- Directive 2000/60/CE. 2000. Directive 2000/60/CE du Parlement européen et du Conseil du 23 octobre 2000 établissant un cadre pour une politique communautaire dans le domaine de l'eau. J Off Communautés Eur 327: 1–72. [Google Scholar]
- Dodd JR, Cowx IG, Bolland JD. 2017. Efficiency of a nature-like bypass channel for restoring longitudinal connectivity for a river-resident population of brown trout. J Environ Manag 204: 318–326. [CrossRef] [Google Scholar]
- Fjeldstad H-P. Pulg U, Forseth T. 2018. Safe two-way migration for salmonids and eel past hydropower structures in Europe: a review and recommendations for best-practice solutions. Mar Freshw Res 69: 1834. [CrossRef] [Google Scholar]
- Forest Service Stream-Simulation Working Group. 2008. Stream Simulation: an ecological approach to Providing Passage for aquatic organisms at road-Stream Crossings, 646 p. [Google Scholar]
- Fuller MR, Doyle MW, Strayer DL. 2015. Causes and consequences of habitat fragmentation in river networks: River fragmentation. Ann N Y Acad Sci 1355: 31–51. [CrossRef] [PubMed] [Google Scholar]
- Gigleux M, De Billy V. 2013. Petits ouvrages hydrauliques et continuités écologiques, Cas de la faune piscicole. Note d'information du Sétra, CETE de l'Est / ONEMA. [Google Scholar]
- Goerig E, Castro-Santos T. 2017. Is motivation important to brook trout passage through culverts? Can J Fish Aquat Sci 74: 885–893. [CrossRef] [Google Scholar]
- Gregory S, McEnroe J, Klingeman P, Wyrick J. 2004. Fish passage through retrofitted culverts. Final Report SPR#325. Oregon State University, Corvallis, Oregon. [Google Scholar]
- Keep JK, Watson JR, Cramp RL, Jones MJ, Gordos MA, Ward PJ, Franklin CE. 2021. Low light intensities increase avoidance behaviour of diurnal fish species: implications for use of road culverts by fish. J Fish Biol 98: 634–642. [CrossRef] [PubMed] [Google Scholar]
- Larinier M. 2002. Fish passage through culverts, rock weirs and estuarine obstructions. Bull Fr Pêche Piscic 119–134. [CrossRef] [EDP Sciences] [Google Scholar]
- Larinier M, Courret D, Gomes P. 2006. Guide technique pour la conception des passes “naturelles.” No. Rapport GHAAPPE RA.06.05-V1. [Google Scholar]
- Murphy BD. 2020. Brook Trout Fish Passage Assessment and Monitoring Study Culvert Sliplining Project, Tributary to Lyman Brook Marlborough. Connecticut Department of Energy and Environmental Protection. [Google Scholar]
- Newbold LR, Karageorgopoulos P, Kemp PS. 2014. Corner and sloped culvert baffles improve the upstream passage of adult European eels (Anguilla anguilla). Ecol Eng 73: 752–759. [CrossRef] [Google Scholar]
- NF EN 17233. 2021. Water quality − Guidance for assessing the efficiency and related metrics of fish passage solutions using telemetry. The European Committee for Standardization CEN: Brussels, Belgium. [Google Scholar]
- Ojanguren AF, Braña F. 2003. Effects of size and morphology on swimming performance in juvenile brown trout (Salmo trutta L.). Ecol Freshw Fish 12: 241–246. [CrossRef] [Google Scholar]
- Ovidio M, Sonny D, Watthez Q, Goffaux D, Detrait O, Orban P, Nzau Matondo B, Renardy S, Dierckx A, Benitez J-P. 2020. Evaluation of the performance of successive multispecies improved fishways to reconnect a rehabilitated river. Wetl Ecol Manag 28: 641–654. [CrossRef] [Google Scholar]
- R Core Team. 2019. R: A language and environment for statistical computing. R Foundation for Statistical Computing, Vienna, Austria. URL https://www.R-project.org/. [Google Scholar]
- Sittenthaler M, Koskoff L, Pinter K, Nopp-Mayr U, Parz-Gollner R, Hackländer K. 2019. Fish size selection and diet composition of Eurasian otters (Lutra lutra) in salmonid streams: Picky gourmets rather than opportunists? Knowl Manag Aquat Ecosyst 420: 29. [CrossRef] [EDP Sciences] [Google Scholar]
- Tomanova S, Courret D, Richard S, Mercier O, Guillemin A, Labedan M, Sagnes P. 2025. Efficiency of a macroroughness block ramp in reducing the impact of low-head dams on riverine fish dispersion. Knowl Manag Aquat Ecosyst 426: 5. [CrossRef] [EDP Sciences] [Google Scholar]
- Tudorache C, Viaene P, Blust R, Vereecken H, Boeck GD. 2008. A comparison of swimming capacity and energy use in seven European freshwater fish species. Ecol Freshw Fish 17: 284–291. [CrossRef] [Google Scholar]
- Weibel D, Peter A. 2013. Effectiveness of different types of block ramps for fish upstream movement. Aquat Sci 251–260. [Google Scholar]
Cite this article as: Tomanova S, Détruit C, Rebière D, Olivier G, Mercier O, Sagnes P. 2025. Brown trout passage efficiency through a baffle series in a long culvert, assessed by fish translocation and by natural migration monitoring. Knowl. Manag. Aquat. Ecosyst., 426, 18. https://doi.org/10.1051/kmae/2025011
All Tables
Migration rate, efficiency metrics and passage times, separately for translocated fish and fish in natural migration.
All Figures
|
Fig. 1 Study site on the Clidane River. The fished zones (upstream and downstream of the culvert) are delimited by the red dots. The dimensions of the baffles are given at the top. The two photos show the inside view of the culvert from downstream and its downstream entrance. The locations of the 3 PIT-detection flatbed antennas (River A, Entrance A and Exit A) are given in the right-hand box. |
| In the text | |
|
Fig. 2 Water level variation upstream of the culvert and periods with all PIT-detection antennas operating (red line) during the study. |
| In the text | |
|
Fig. 3 Timing of the first fish presentation downstream of the culvert after tagging, for a) translocated fish and b) fish in natural migration, with indication of fishing/tagging days. |
| In the text | |
|
Fig. 4 Proportions of the first individual detections (%) at the different antennas, according to the period of day, for translocated fish (left) and fish in natural migration (right). |
| In the text | |
Current usage metrics show cumulative count of Article Views (full-text article views including HTML views, PDF and ePub downloads, according to the available data) and Abstracts Views on Vision4Press platform.
Data correspond to usage on the plateform after 2015. The current usage metrics is available 48-96 hours after online publication and is updated daily on week days.
Initial download of the metrics may take a while.