| Issue |
Knowl. Manag. Aquat. Ecosyst.
Number 421, 2020
|
|
|---|---|---|
| Article Number | 21 | |
| Number of page(s) | 16 | |
| DOI | https://doi.org/10.1051/kmae/2020013 | |
| Published online | 28 May 2020 | |
Research Paper
Morphologic and genetic characterisation of Corsican and Sardinian trout with comments on Salmo taxonomy
Caractérisation morphologique et génétique de la truite corse et sarde avec commentaires sur la taxonomie du genre Salmo
1
Department of Zoology, Swedish Museum of Natural History, 10405
Stockholm, Sweden
2
Dipartimento di Scienze della Vita e dell'Ambiente, Università di Cagliari, Via Fiorelli 1, Cagliari, Italy
3
Office National des Forêts, Pont de l'Orta, 20250 Corte, France
4
ISEM, Université de Montpellier, CNRS, IRD, EPHE,
Montpellier, France
a
Present address: Genome-R&D, 697 avenue de Lunel, 34400 Saint-Just, France.
* Corresponding author: This email address is being protected from spambots. You need JavaScript enabled to view it.
Received:
17
February
2020
Accepted:
8
April
2020
Abstract
Both morphological and molecular data are presented and discussed for indigenous Salmo sp. from Corsica and Sardinia, here called Tyrrhenian trout. For comparison, morphological data obtained from museum specimens, including the Algerian S. macrostigma, are discussed in the light of recent and new molecular findings. In total, 29 measurements and 20 meristic characters were taken from each specimen. Out of the meristic characters, 12 were obtained by means of X-ray. One important morphometric character in the present study is the size of the head measured from premaxilla to posterior margin of preoperculum. This character was particularly stable in all Tyrrhenian trout, showing relatively large head compared to Atlantic trout and to S. macrostigma. On the contrary, other characters like body punctuations, black and white edges of fins, body depth or number of epurals in the caudal skeleton are quite polymorphic. In certain meristic characters, range of variation of Tyrrhenian trout even exceeds that of the extensive comparative material. Each trout has been genetically characterized. New haplotypes from Tyrrhenian trout were discovered, belonging to three mitochondrial lineages viz. Adriatic, marble and Mediterranean, however, Adriatic haplotypes are dominant. Comparing morphological and genetic data, observed morphology lacks any obvious correlation to mitochondrial lineages and it is concluded that Tyrrhenian trout show no particular affinity to S. macrostigma from Algeria.
Résumé
La présente étude détaille et discute les données morphologiques et moléculaires des truites indigènes, Salmo sp. de Corse et de Sardaigne, ici appelée truites tyrrhéniennes. À titre de comparaison, les données morphologiques obtenues à partir de spécimens de musée, y compris S. macrostigma d'Algérie, sont discutées à la lumière des découvertes moléculaires récentes et nouvelles. Au total, 29 mesures et 20 caractères méristiques ont été considérés pour chaque spécimen. Parmi ces caractères méristiques, 12 ont été obtenus au moyen de rayons X. Un caractère morphométrique important dans la présente étude est la taille de la tête mesurée du prémaxillaire à la marge postérieure du préopercule. Ce caractère est particulièrement stable chez toutes les truites tyrrhéniennes, qui ont montré une tête relativement grande par rapport à celle de la truite de l'Atlantique et de S. macrostigma. Au contraire, d'autres caractères comme les ponctuations du corps, les franges noires et blanches des nageoires, la profondeur du corps ou le nombre d'hypuraux dans le squelette caudal sont assez polymorphes. Pour certains caractères méristiques, la gamme de variation de la truite tyrrhénienne dépasse celle de tous les taxons comparés. Chaque truite a été génétiquement caractérisée et de nouveaux haplotypes de truite tyrrhénienne ont été découverts, appartenant à trois lignées mitochondriales à savoir les lignées adriatique, marbrée et méditerranéenne, les haplotypes adriatiques étant dominants. En combinant les données morphologiques et génétiques, il est montré que la morphologie n'a aucune corrélation évidente avec les lignées mitochondriales. D'autre part, la truite tyrrhénienne n'a aucune affinité particulière avec S. macrostigma d'Algérie.
Key words: Brown trout / Tyrrhenian Sea / morphology / meristics / mtDNA
Mots clés : Truite commune / mer Tyrrhénienne / morphologie / caractères méristiques / ADNmt
© B. Delling et al., Published by EDP Sciences 2020
 This is an Open Access article distributed under the terms of the Creative Commons Attribution License CC-BY-ND (https://creativecommons.org/licenses/by-nd/4.0/), which permits unrestricted use, distribution, and reproduction in any medium, provided the original work is properly cited. If you remix, transform, or build upon the material, you may not distribute the modified material.
1 Introduction
The taxonomic status of Eurasian trouts, i.e., all Salmo spp. except Atlantic salmon, Salmo salar, is revised continuously. Among molecular oriented ichthyologists, this part of Salmo diversity is most often referred to as brown trout Salmo trutta or “brown trout complex”, whereas taxonomic oriented scientists, mainly focusing on morphology, continue to describe new species and recognize at least 50 distinct taxa (Delling and Doadrio, 2005; Sušnik et al., 2006, 2007; Kottelat and Freyhof, 2007; Delling, 2010; Turan et al., 2009, 2011, 2012, 2014a, 2014b, 2017, 2020; Doadrio et al., 2015; Froese and Pauly, 2019).
The extensive molecular studies of the genus started mainly with allozymes (Ferguson and Mason, 1981; Karakousis and Triantaphyllidis, 1990; García-Marín et al., 1999; Berrebi et al., 2000a; Berrebi, 2015), later on shifting focus towards DNA sequencing mainly of mitochondrial origin (Giuffra et al., 1994; Apostolidis et al., 1997; Aurelle and Berrebi, 2001; Snoj et al., 2011). These studies led to numerous publications describing genetic variation in the genus. One of the most important findings within the taxonomic context is probably the proposed five main mitochondrial DNA (mtDNA) lineages within the brown trout complex, Atlantic (AT), Mediterranean (ME), Adriatic (AD), marble (MA) and Danubian (DA) (Bernatchez et al., 1992; Bernatchez, 2001). These lineages are augmented by geographically more limited lineages such as the Duero (DU) lineage (Suarez et al., 2001) and the Dades trout (Snoj et al., 2011), both close to AT, and the Tigris (TI) lineage (Bardakçi et al., 2006) close to DA. A recent analysis of a larger portion of the mtDNA allowed for a division of the AT lineage into two sister clades: a North African lineage (NA, in Morocco, Algeria and Sicily) and a well-known European AT lineage (Tougard et al., 2018).
In several cases, morphological and molecular data are correlated, strengthening hypotheses on taxa delimitation (Sanz, 2018). However, they sometimes disagree: for example, Salmo marmoratus, considered as very distinct in morphology (Delling, 2002), is also characterized by the MA mtDNA and the LDH-C1*(120) allozyme allele. However, MA haplotypes are also found in low frequencies outside the taxon (Bernatchez et al., 1992; Snoj et al., 2009; Pustovrh et al., 2011; Tougard et al., 2018) and the 120-allele is rare in Zadlascica River (Slovenia) otherwise pure and isolated S. marmoratus population (Berrebi et al., 2000b). Another example of markers disagreement is illustrated by S. obtusirostris. This species, while fixed for a unique and specific mtDNA haplotype in the Neretva River (Snoj et al., 2002), is fixed for the AD mtDNA lineage in Jadro River population. Other frequent kinds of contradiction have been observed, especially in the Balkans with numerous taxa sharing similar AD haplotypes (Sušnik et al., 2004, 2006; Snoj et al., 2010). These kinds of discrepancy may be explained by ancient introgression (Sušnik et al., 2007). Another explanation is the Dobzhansky–Muller model which accounts for cytonuclear incompatibilities (Burton and Barreto, 2012).
Despite the high number of more or less distinguishable taxa within the genus Salmo, large portions of its populations are not easily referred with accuracy to any existing taxon (Splendiani et al., 2019). This is partly due to lack of morphological data, lack of studies including both kinds of data and the fact that several tentatively valid taxa are poorly described lacking clear diagnoses (Kottelat and Freyhof, 2007). Within the native distribution of Salmo, a large part of its diversity is found in basins of the Tyrrhenian islands, Corsica, Sardinia and Sicily (Berrebi et al., 2019), and especially in Corsica where numerous differentiated indigenous populations still survive. Trout from Corsica and Sardinia, together with several other Mediterranean trouts, are often referred to as Salmo macrostigma (Duméril 1858) − a species originally described from Algeria. The name macrostigma refers to the parr marks retained in adults (Duméril, 1858). This is a common feature in many Salmo spp. and may explain the broadened usage of this name, as applied to Corsican trout by Roule (1933) and to Sardinian trout at first by Boulenger (1901) also confirmed by Pomini (1941). Since that, Corsican trout have been characterized both for allozymes (Guyomard and Krieg, 1986; Berrebi, 1995), mtDNA (Bernatchez et al., 1992; Berrebi et al., 2019) and microsatellites (Berrebi et al., 2007, 2019), showing that they mainly belong to the AD lineage and possess the highly diagnostic allozyme allele LDH3*(040). Morphological data on Corsican trout is so far restricted to pyloric caeca counts (Olivari and Brun, 1988; Guyomard, 1989) and the description of variation in color pattern among populations (Lascaux et al., 2010). In the same way, the non-introgressed Sardinian populations were characterized by only the AD lineage and allele LDH-C1 100/100 (Sabatini et al., 2018). Some authors describe, for the Sardinian populations, different haplotypes with highly polymorphic characteristics accompanied by different phenotypes (Sabatini et al., 2011; Zaccara et al., 2015; Berrebi et al., 2019).
Regarding distinctiveness of S. macrostigma sensu stricto, Tougard et al. (2018) analyzed complete mtDNA sequences from one syntype and one topotypic specimen and concluded they belonged to the NA lineage. In the same study, samples from Corsica and Sardinia were associated to AD, ME, MA or AT lineages.
The present study is deliberately “cross-disciplinary”, the main focus being to describe and discuss the Salmo diversity irrespective of different views on classification and taxonomy. Consequently, the use of different names, e.g. S. marmoratus or S. lourosensis, only serve the purpose of pointing out a certain subset of trouts. Both molecular and morphological data are presented and discussed for indigenous Salmo sp. from Corsica and Sardinia, here called Tyrrhenian trout. Regarding comparison to Algerian S. macrostigma, morphological data obtained from museum specimens are also included and discussed in the light of recent molecular findings (Tougard et al., 2018).
2 Material and methods
2.1 Sampling
Contemporary specimens (N = 38) from one Sardinian and six Corsican localities were captured in the wild by electrofishing, anesthetized with clove essence to death, sampled for tissue (fin clip in 95% ethanol), fixed in formalin 5%, and later transferred to ethanol prior to morphological analyses. The geographic positions of sampling stations are given in Figure 1. Tyrrhenian Salmo is referred to with an abbreviation of the stream, e.g. CAM for Camboni River in text, certain graphs and tables (Tab. 1). As detailed in Figure 1, samples for genetic and morphological analyses are not exactly the same.
Comparative material includes different sets of Salmo spp. depending on analyses and the question of interest: distinction towards (i) Salmo macrostigma from Algeria, (ii) Atlantic basin Salmo trutta, (iii) Salmo sp. from Spain. Comparative material for morphometry is restricted to specimens within standard length (SL) − range (116–208 mm), i.e., within the SL-range of Tyrrhenian trout samples. A description of contemporary and comparative material is given in Table 1, obtained from several museum collections: CMK, Collection of Maurice Kottelat, Cornol, Switzerland; BMNH, British Museum of Natural History, London, UK; MHNG, Museum d'Histoire Naturelle, Geneva, Switzerland; MNCN, Museo Nacional de Ciencias Naturales, Madrid, Spain; MNHN, Museum National d'Histoire Naturelle, Paris, France; NMW, Naturhistorisches Museum, Wien, Austria; NRM, Swedish Museum of Natural History, Stockholm, Sweden; ZISP, Zoological Institute, Russian Academy of Sciences, St. Petersburg, Russia; ZMH, Zoologisches Museum für Hamburg, Germany. The sample from Spain, MNHN 1920 228-229, consists of two specimens only but is included in the study because their morphology resembles Tyrrhenian trout (see below). Comparative material in addition to that in Table 1 (Delling, unpublished) is included for a broader comparison of head length within Salmo. A complete list of studied material is provided as supplementary information (Table S1).
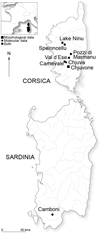 |
Fig. 1 Geographic position of the new sampled populations in Corsica and Sardinia. |
2.2 Molecular methods
DNA was extracted from fin clips using the Chelex/proteinase K protocol described by Estoup et al. (1996). Three to six individuals have been considered by locality in the Tyrrhenian region, being or not the exact individuals included in morphological analyses. Partial mtDNA control region (CR) was amplified by PCR using the PST and FST primers (Cortey and García-Marín, 2002). Each 50 µl reaction included 0.4 μM of each primer (Eurofins MWG Operon), 0.2 mM of dNTP (2 mM each), 2 mM of MgCl2 (25 mM), 10 µl of 5x PCR buffer, 1 U of Taq polymerase (GoTaq® Promega) and about 50 ng of genomic DNA. The conditions for PCR were an initial denaturation (95 °C, 5 min) followed by 30 cycles of strand denaturation (94 °C, 1 min), primer annealing (52 °C, 1 min) and DNA extension (72 °C, 1 min), then followed by a final extension (72 °C, 5 min). All PCR amplifications were performed in Eppendorf Mastercycler thermocyclers. The amplified DNA fragments were run on a 0.8% agarose gel to verify the efficiency of amplification. The PCR products were purified and sequenced in both directions to confirm polymorphic sites by the Macrogen Company, Seoul, South Korea (https://dna.macrogen.com/) and the platform GenSeq of the Institut des Sciences de l'Evolution de Montpellier (Montpellier, France).
The sequences of CR were aligned together with reference haplotypes retrieved from GenBank, using MEGA v5.05 (Tamura et al., 2011). Haplotypes for the new sequences were generated with DnaSP v5.10.1b (Librado and Rozas, 2009). Haplotype relationships and distribution among populations were evaluated with a median-joining network (Bandelt et al., 1999) constructed with PopART (Leigh and Bryant, 2015). In order to assign a phylogenetic position to the seven contemporary samples (CAM, SPE, POZ, ESE, CAR, CHA and NIN), the network included published GenBank sequences of the lineages AT, ME, AD, MA, DA and NA, all belonging to the brown trout complex.
2.3 Morphology methods
Methodology follows Delling et al. (2000) and Delling (2002). The length of the uppermost gill raker on the lower limb of the first gill arch (right side) was measured in situ using a pair of dividers. All other measurements were taken on the left side of the specimen with a digital calliper and rounded to the nearest 0.1 mm (Fig. 2). One important morphometric character in the present study is head length (HL) measured from tip of the snout to posterior margin of the operculum. However, the measurement that quantifies the size of the head more accurately is the distance from the premaxilla to the posterior margin of the preoperculum (No. 24 in Fig. 2). Below, the abbreviation HLpp is applied for that measurement.
The number of (i) pored scales along the lateral line to the end of the caudal peduncle (left side), (ii) scales in an oblique row from the base of the adipose fin backwards down to the lateral line including lateral line scales (left side), (iii) gill rakers, including rudimentary elements, on lower and upper limbs of the first gill arch separately (right side), and (iv) branchiostegal rays on both sides, were counted under a binocular dissection microscope.
The number of abdominal vertebrae, caudal vertebrae, pterygiophores supporting anal and dorsal fins, caudal fin upper and lower procurrent rays, and interneurals were taken from radiographs (Fig. 3). Rudimentary vertebrae in the caudal skeleton in addition to the three upturned vertebrae were not included in the counts. In cases of fused centra, the number of neural arches or spines was counted. The last abdominal vertebra is herein defined as the last one having ribs (sometimes rudimentary or missing) and/or having the haemal spine much shorter than in the consecutive first caudal vertebra. The positions of the dorsal and anal fins were estimated in relation to the vertebral column. The most strongly developed anterior pterygiophore was used as a marker of dorsal and anal fin position, respectively. Dorsal and anal fin pterygiophores do not articulate with neural and haemal spines, respectively, and in uncertain cases the lower value was chosen. The dorsal and anal fin positions are treated as meristic characters in statistical analyses. A membranous triangular bone sometimes present, located above the neural spine of the first vertebrae (Fig. 3), was not included in interneural counts.
Principal component analyses (PCA) on log transformed measurements and square rooted counts were used as an ordination method (Bookstein et al., 1985). Some informative meristic characters are summarised in frequency tables. The inclusion of ‘soft’ measurements, e.g. body width and body depth in analyses, depends on the state of preservation of specimens. PCAs were performed using SYSTAT 13. Colour pattern descriptions are most often restricted to contrasting markings: size, density and distribution of spots; presence of black and white leading edges of dorsal and anal fins; any other markings such as dark bars were also considered. In preserved material, light spots are interpreted as red spots based on personal observations: after transfer to ethanol, red spots disappear transformed into pale spots. Spots described as ocellated refer to spots enclosed by a light ring.
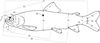 |
Fig. 2 Measurements taken on Salmo specimens; 1, upper jaw depth, as largest depth of the maxilla and supramaxilla; 2, snout length, from symphysis of premaxilla to osseous orbit margin; 3, orbital horizontal diameter, between osseous orbital margin; 4, head depth, just posterior to orbit; 5, orbital vertical diameter, between osseous orbital margin; 6, length of maxilla, from premaxilla end to posterior end of maxilla; 7, upper jaw length, from symphysis of premaxilla to posterior end of maxilla; 8, lower jaw length, from symphysis of dentary to retroarticular; 9, pectoral fin length, from base of first ray to tip of longest ray; 10, body depth, at level of origin of dorsal fin; 11, dorsal fin length, from base to tip of longest ray; 12, pelvic fin length, from base of first ray to tip of longest ray; 13, body depth, at level of origin of anal fin; 14, adipose fin length, from origin to tip; 15, anal fin length, from base of first ray to tip of longest ray; 16, caudal peduncle length, from end of anal fin to middle base of caudal fin; 17, least depth of caudal peduncle; 18, length of upper caudal fin lobe, from base to tip of longest ray; 19, length of middle caudal fin ray, from base to tip of shortest ray; 20, length of lower caudal fin lobe, from base to tip of longest ray; 21 standard length (SL), from upper jaw symphysis to middle base of caudal fin; 22, predorsal length from upper jaw symphysis to origin of dorsal fin; 23, head length, from upper jaw symphysis to posterior tip of operculum; 24, premaxilla to preoperculum length, from premaxilla end of maxilla to posterior margin of preoperculum (HLpp); 25, prepelvic length, from upper jaw symphysis to origin of pelvic fin; 26, preanal length, from upper jaw symphysis to origin of anal fin; 27, interorbital width, transverse at narrowest part of skull; 28, body width, transverse at widest part of body at level of dorsal fin origin, above abdominal cavity. |
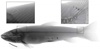 |
Fig. 3 Radiograph of Salmo sp. POZ, NRM62572, 197.3 mm SL; Pozzi di Marmanu Corsica (same specimen as in Fig. 8E). Upper left; a thin membranous bone indicated with dashed white line. Upper right; the uncommon condition with three (i-iii) epurals in the caudal skeleton. |
3 Results
3.1 Molecular results
Among the 38 contemporary specimens from Corsica and Sardinia, 34 CR sequences were obtained, corresponding to eight new haplotypes (Tab. 2). The alignment of CR sequences are 998 nucleotides long with 47 phylogenetically informative sites. These haplotypes are genetically very close (distant from each other by up to two mutations, Fig. 4) to 37 published GenBank haplotype sequences used as reference and illustrating the diversity on all the range of the S. trutta complex. A comprehensive network of these new and published haplotypes is presented in Figure 4. The sequences of the contemporary analyzed populations were all clustered into ME, AD and MA lineages, according to the reference sequences. AT, DA and NA lineages were represented only by GenBank sequences.
New haplotypes from Tyrrhenian trout were called ADcr2 to 6, MAcr1 and 2, and MEcr1 (Tab. 2). Three populations are characterized by one private haplotype each: NIN, (Corsica) with MEcr1; CAM (Sardinia) with ADcr2 and POZ (Corsica) with ADcr4. CAR (Corsica) is characterized by a majority of MA private haplotypes (MAcr1 and 2) and one AD haplotype (ADcr5), while CHA (Corsica) is characterized by two AD haplotypes (ADcr3 and ADcr6). SPE and ESE shared ADcr3 with CHA.
Distribution of the haplotypes involved in this study.
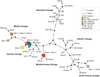 |
Fig. 4 Median-joining network of control region haplotypes of some trout samples (new Tyrrhenian haplotypes and AT, AD, DA, MA, ME and NA haplotypes from GenBank). Haplotypes are indicated by numbers as given in Table 2. Black circles are for nodes, and hatch marks are for mutation steps. |
3.2 Morphology
Morphometric data are given in Table 3, and meristic data are summarized in Tables 4–6 including extensive comparative material (Tabs. 1 and S1). Selected results from ordination by means of PCA are given for analyses focusing on variation between Tyrrhenian trout as a whole towards Atlantic basin S. trutta (Fig. 5). Corresponding character loadings are given in Supplementary Tables S2 and S3. The distinction of Tyrrhenian trout towards S. macrostigma is illustrated with a biplot (Fig. 6) focusing on the major morphological trait of the Tyrrhenian trout, viz. the longer head (HLpp) and slightly shorter caudal peduncle. The two Spanish specimens are included in all analyses and graphs. For discussion related to the comparatively large head in Tyrrhenian trout, HLpp is also presented as box plots in comparison to an extended number of Salmo samples (Fig. 7).
Morphometry of Salmo spp. Number of studied specimens (N) for certain measurements varies due to condition of preserved specimens.
Frequency distribution of scale counts from base of adipose fin to lateral line and left side branchiostegal counts in Salmo spp.
Frequency distribution of vertebral counts and caudal fin upper procurrent rays in Salmo spp.
Frequency distribution of gill raker counts in Salmo spp.
 |
Fig. 5 Morphometric PC II plotted against meristic PC I for Salmo from Sardinia, Corsica and Spain in comparison to Atlantic basin S. trutta. |
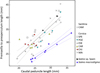 |
Fig. 6 Premaxilla to preoperculum length plotted against caudal peduncle length for Salmo from Sardinia, Corsica and Spain in comparison to S. macrostigma. Linear regression lines with 95% confidence bands are shown for each group separately. |
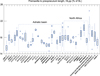 |
Fig. 7 Box plot of premaxilla to preoperculum length as % of SL, totally 518 specimens 116-208 mm SL. Number of specimens is given for each sample separately. Samples in bold are detailed in Table 1. Additional samples given in capital letters (Delling, unpublished) refer to rivers or streams in the given regions (Table S1). Ezenam is a lake in Daghestan and labrax represents trout from Black Sea basin with an anadromous silvery and slender appearance. Turkey and Mediterranean are samples scattered in the regions. Boxes represent median value +/− 25% of the observations, and whiskers the inner fences. Asterisks are outside or far outside values. |
3.2.1 Variation among Tyrrhenian trout samples
At first glance (Fig. 8A–G), the Tyrrhenian trout resembles Atlantic basin S. trutta, i.e. rather strong jaws, numerous red and black spots, black and white edges of fins, most prominent in CAM, CAR, CHJ and SPE. Black spots are sometimes irregularly distributed, more or less aggregated along the flanks of the body (SPE, NIN) in contrast to, e.g., CAM having its spots more evenly distributed (Fig. 8A). There are large variations in meristic characters between different populations and the range of variation sometimes exceeds that of the extensive comparative material (Tabs. 4–6). The NIN sample and the two Spanish specimens were not markedly different in multivariate statistics in comparison to the six remaining samples.
Four specimens (1 POZ, 3 ESE) were different in the number of epurals in the caudal skeleton, having three instead of two. All Salmo except S. salar have two, sometimes fused (anomaly) to one. Salmo salar is polymorphic but two is more common (see below).
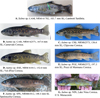 |
Fig. 8 External aspect of seven of the trouts, Salmo sp., analyzed in the present study. Pictures A-F taken after fixation in formalin prior to transfer to ethanol. |
3.2.2 Distinction of Tyrrhenian trout samples towards North Atlantic basin S. trutta
The rather strong jaws and a colour pattern with prominent black and white leading edges on the fins are shared between several populations of Atlantic basin S. trutta and the Tyrrhenian trouts. Dark, more or less ocellated, spots on flanks of the body are also common in both. However, some Tyrrhenian trout have their spots aggregated (Figs. 8F, 8G and p. 415 in Kottelat and Freyhof, 2007). The sample from Spain also possesses this uncommon pattern and was therefore especially highlighted in the comparative material. Sparsely or densely distributed, dark spots on caudal fin are also common in Tyrrhenian trout (Figs. 8B and 8G, CAM and SPE, respectively). Spots on caudal fins are rarely found in Atlantic basin S. trutta. Multivariate statistics (Fig. 5) indicate distinction but not complete separation of Tyrrhenian trout from Atlantic S. trutta due to differences in vertebral counts and head size.
3.2.3 Distinction of Tyrrhenian trout samples towards S. macrostigma
The extensive variation in meristic characters in Tyrrhenian trout as a whole (Tabs. 4–6) covers the range of variation in S. macrostigma and limits the analyses to morphometric data. PCA (not shown) reveals that HLpp and caudal peduncle length are the two morphometric characters that distinguish them best (Fig. 6). The Tyrrhenian trout has longer head (HLpp) and slightly shorter caudal peduncle compared to S. macrostigma (Tab. 3).
4 Discussion
4.1 Genetic diversity: a strong differentiation pattern
According to results from previous (Tougard et al., 2018; Berrebi et al., 2019) and present studies, the Tyrrhenian trout is mainly characterized by an island specific mtDNA-radiation within the AD lineage, as well as, to a lesser degree, by other lineages (AT, ME and MA). The recently described NA lineage is also naturally present in Sicily. Thus, within a rather limited and nowadays isolated region in the south center of Salmo distribution, a comparatively high number of mtDNA lineages (four of the five recognizable major lineages) occur naturally. It is also striking that a majority of the haplotypes recovered in the present study were new (Tab. 2) despite more than two decades of CR sequencing in Salmo. The presence of the ME lineage in the NIN sample, also observed in Corsica by Tougard et al. (2018) and in other Tyrrhenian samples not included in the morphological analyses, is explained by ancient introgressions evidenced elsewhere using nuclear markers (Berrebi et al., 2007; Berrebi, 2015). It shows that possible secondary contacts must have occurred, according to the post-glacial invasion of Corsica hypothesis (Gauthier and Berrebi, 2007). Moreover, the presence of MA lineage in some isolated Corsican rivers including CAR and the range of distribution of the NA lineage (Morocco, Algeria, Sicily: Tougard et al., 2018; Berrebi et al., 2019) demonstrates the multiple unknown events of migrations, invasions and hybridizations which complicate the trout genetic pattern in the Tyrrhenian region. Finally, the presence of several northern AT haplotypes recorded in the Tyrrhenian trout (Tougard et al., 2018; Berrebi et al., 2019) is due to stocking with commercial AT hatchery strains.
Nuclear markers (microsatellites) have also shown that the Tyrrhenian trouts exhibit exceptionally differentiated genotypes, at a continental-like level, within the two small sampled islands, but especially in Corsica where numerous autochthonous isolated small populations still survive (Berrebi et al., 2019). This strong differentiation among neighboring rivers is typical of dry Mediterranean mountainous regions, never frozen by glaciation and providing way for migration (Apostolidis et al., 2008; Berrebi et al., 2019).
4.2 Morphological diversity in light of genetic diversity
Regarding the strong morphological diversification between studied populations of Tyrrhenian trout, one explanation may involve random effects. Berrebi et al. (2019) showed very low levels of genetic variation within populations in Corsican streams based on microsatellites, suggesting small population sizes and repeated bottleneck events.
Hypothetically, the frequent (c. 10%) occurrence of three epurals in Tyrrhenian trout compared to c. 0.1% in comparative material might be a result of genetic drift accelerated by bottlenecks. Three epurals in the caudal skeleton are typical for, e.g., most Pacific trouts and salmons (Oncorhynchus), graylings (Thymallus) and whitefishes (Coregonus) (Norden, 1961; Stearley and Smith, 1993) and appear to be the ancestral state also retained as a polymorphism in S. salar with 12 out of 40 studied specimens having three.
Delling and Doadrio (2005) also described a situation with a seemingly plesiomorphic condition in rostrodermethmodid bone in the lake endemic S. pallaryi from Lake Sidi Ali, Morocco, not recorded elsewhere in Salmo. The genetic characteristics of this extinct trout is unknown but it is likely that these kinds of reversals approaching morphological anomalies may occur under certain conditions involving random processes in temporarily small populations.
Comparing Tyrrhenian samples to other Salmo spp., it is tempting to search for a pattern connecting certain characters to certain mtDNA lineages. However, ancient introgression in certain populations without strong impacts on morphology seems rather to be the “rule” in many salmonids and other taxa (Martinez et al., 2009; Gratton et al., 2013; Lerceteau-Köhler et al., 2013; Berrebi et al., 2017). The CAR sample also possessing the MA mtDNA lineage shows no typical S. marmoratus characters, e.g. marbled color pattern, high vertebral counts or a hypethmoid bone embedded in the rostral cartilage. In contrast, more recent hybrids involving S. marmoratus show a variable but, overall, intermediate phenotype (Delling et al., 2000). Prominent black and white leading edges on fins in several Tyrrhenian populations are similar to Atlantic basin S. trutta and could tentatively be regarded as ancient traces of the AT lineage. This pattern is also present in some North African trout, e.g. S. akairos and S. macrostigma belonging to the NA lineage, close to the AT one (Tougard et al., 2018). However, neither NA nor AT lineages have so far been reported from Corsica and Sardinia, except AT lineages of hatchery origin.
Despite the complex pattern of migrations, hybridizations and genetic radiation in the Tyrrhenian trout history, also giving rise to rather morphologically distinct populations in Corsica and Sardinia (Figs. 8A–G), they all share a comparatively large head (Figs. 6 and 7). This contradictory pattern of morphological homogeneity for certain characters opposed to strong differentiation in others take probably account of the genetic data in the search for possible explanations. Turning focus to the overall large head in Tyrrhenian trout, it is noticeable that this character varies extensively within and between different kinds of trouts (Fig. 7). It should be noted that sample sizes vary considerably (Fig. 7) but several of them can be characterized as typically small-headed, e.g., S. salar, S. obtusirostris and S. lourosensis. Next after the Tyrrhenian trouts, the two North African lake trouts endemic from Morocco, S. akairos and S. pallaryi, together with S. marmoratus and S. dentex inhabiting Adriatic basin drainages, possess comparatively large heads. Thus, there is no obvious correlation between size of head and habitat and/or lifestyle, e.g., rapid streams vs. lakes, and it is fully possible that the large head is a result of a founder effect during ancient establishment on the islands. However, body proportions can be affected by, e.g., growth rate. Barlow (1961) refers to studies where it was shown that head length was smaller in faster growing rainbow trout, Oncorhynchus mykiss. Thus, the comparatively large head in Tyrrhenian trout can be a consequence of slow growth under harsh condition, or a consequence of earlier sexual maturity. However, Pankhurst and Montgomery (1994) showed, also for O. mykiss, that retarded growth results in larger eyes. The Tyrrhenian trout possesses on the average slightly smaller eyes compared to Atlantic S. trutta (Tab. 3) and consequently retarded growth seems not to be a likely explanation for the large head.
The two Spanish specimens, referred to as Salmo sp. MNHN 1920 228-229, possess a color pattern with irregularly distributed spots, also found in some Tyrrhenian trouts, and are comparatively large headed (Fig. 6). They provide an example of what a hypothetical ancestor could have looked like and, if the interpretation of locality information (Ebro basin) is correct, it makes sense as the basin is dominated by AD haplotypes (Cortey et al., 2004). Also, the haplotype ADcs13 found in Ebro is very close to the Tyrrhenian AD haplotypes (Fig. 4).
5 Conclusions
Data presented herein suggest that within the rather unresolved Salmo complex in the Mediterranean region, we may start to perceive a kind of large headed trout. However, more populations from the islands and surrounding mainland (France, Spain, and Italy) need to be studied to survey the distribution of this morphology. It would be a large step forward if this kind of trout could get an identity, i.e. a scientific name to balance a perhaps too broad or erroneous usage of names such as S. trutta and S. macrostigma in the Mediterranean region. This long-term work already began with several recent molecular papers (Sanz, 2018; Tougard et al., 2018; Berrebi et al., 2019) and the present study. The Tyrrhenian trout studied here are left without a taxonomic identity but it is clearly demonstrated, in line with molecular data (Tougard et al., 2018), that they show no particular affinity to S. macrostigma once described from Algeria.
Supplementary Material
Supplementary Table S1. Supplementary Table S2. Supplementary Table S3.
Access Supplementary MaterialAcknowledgements
We thank Douglas Jones at the Institute of Freshwater Research, Drottningholm, for improving the English. This work was realized with the support of LabEx CeMEB, an ANR “Investissements d'avenir” program (ANR-10-LABX-04-01).
References
- Apostolidis AP, Madeira MJ, Hansen MM, Machordom A. 2008. Genetic structure and demographic history of brown trout (Salmo trutta) populations from the southern Balkans. Freshw Biol 53: 1555–1566. [Google Scholar]
- Apostolidis AP, Triantaphyllidis C, Kouvatsi A, Economidis PS. 1997. Mitochondrial DNA sequence variation and phylogeography among Salmo trutta L. (Greek brown trout) populations. Mol Ecol 6: 531–542. [CrossRef] [PubMed] [Google Scholar]
- Aurelle D, Berrebi P. 2001. Genetic structure of brown trout (Salmo trutta, L.) populations from south-western France: data from mitochondrial control region variability. Mol Ecol 10: 1551–1561. [CrossRef] [PubMed] [Google Scholar]
- Bandelt HJ, Forster P, Röhl A. 1999. Median-joining network for inferring intraspecific phylogenies. Mol Biol Evol 16: 37–48. [CrossRef] [PubMed] [Google Scholar]
- Barlow GW. 1961. Causes and significance of morphological variation in fishes. Syst Zool 10: 105–117. [Google Scholar]
- Bardakçi F, Degerli N, Ozdemir O, Basibuyuk HH. 2006. Phylogeography of the Turkish brown trout Salmo trutta L.: mitochondrial DNA PCR-RFLP variation. J Fish Biol 68: 36–55. [Google Scholar]
- Bernatchez L. 2001. The evolutionary history of brown trout (Salmo trutta L.) inferred from phylogeographic, nested clade, and mismatch analyses of mitochondrial DNA variation. Evolution 55: 351–379. [CrossRef] [PubMed] [Google Scholar]
- Bernatchez L, Guyomard R, Bonhomme F. 1992. DNA sequence variation of the mitochondrial control region among geographically and morphologically remote European brown trout Salmo trutta populations. Mol Ecol 1: 161–173. [CrossRef] [PubMed] [Google Scholar]
- Berrebi P. 1995. Étude génétique des truites de Corse. Rapport final 1995: Université Montpellier II. 36p. https://data.oreme.org/trout/home. [Google Scholar]
- Berrebi P. 2015. Three brown trout Salmo trutta lineages in Corsica described through allozyme variation. J Fish Biol 86: 60–73. [CrossRef] [PubMed] [Google Scholar]
- Berrebi P, Caputo Barrucchi V, Splendiani A, et al. 2019. Brown trout (Salmo trutta L.) high genetic diversity around Tyrrhenian Sea as revealed by nuclear and mitochondrial markers. Hydrobiologia 826: 209–231. [Google Scholar]
- Berrebi P, Dubois S, Recorbet B, Muracciole S, Mattei J. 2007. Les progrès en génétique obtenus lors du LIFE. Guide de gestion de la truite macrostigma. 52–60. https://data.oreme.org/trout/home. [Google Scholar]
- Berrebi P, Jesenšek D, Crivelli AJ. 2017. Natural and domestic introgressions in the marble trout population of Soca River (Slovenia). Hydrobiologia 785: 277–291. [Google Scholar]
- Berrebi P, Poteaux C, Fissier M, Cattaneo-Berrebi G. 2000a. Stocking impact and allozymic diversity in brown trout from Mediterranean southern France. J Fish Biol 56: 949–960. [Google Scholar]
- Berrebi P, Povz M, Jesenšek D, Crivelli AJ. 2000b. The genetic diversity of native, stocked and hybrid populations of marble trout in the Socă river, Slovenia. Heredity 85: 277–287. [CrossRef] [PubMed] [Google Scholar]
- Boulenger GA. 1901. On the occurrence of Salmo macrostigma in Sardinia. Annals and Magazine of Natural History (Ser. 7) 8: 14. [CrossRef] [Google Scholar]
- Bookstein FL, Chernoff B, Elder RL, Humphries JM, Smith GR, Strauss RE. 1985. Morphometrics in evolutionary biology. Academy of Natural Sciences of Philadelphia, Special Publication, 15. 277pp. [Google Scholar]
- Burton RS, Barreto FS. 2012. A disproportionate role for mtDNA in Dobzhansky–Muller incompatibilities? Mol Ecol 21: 4942–4957. [CrossRef] [PubMed] [Google Scholar]
- Cortey M, García-Marín JL. 2002. Evidence for phylogeographically informative sequence variation in the mitochondrial control region of Atlantic brown trout. J Fish Biol 60: 1058–1063. [Google Scholar]
- Cortey M, Pla C, García-Marín JL. 2004. Historical biogeography of Mediterannean Trout. The role of allopatry and dispersal events. Mol Phylogenet Evol 33: 831–844. [Google Scholar]
- Cortey M, Vera M, Pla C, García-Marín JL. 2009. Northern and Southern expansions of Atlantic brown trout (Salmo trutta) populations during the Pleistocene. Biol J Linn Soc 97: 904–917. [CrossRef] [Google Scholar]
- Delling B. 2002. Morphological distinction of marble trout, Salmo marmoratus, in comparison to marbled Salmo trutta from River Otra, Norway. Cybium 26: 283–300. [Google Scholar]
- Delling B. 2003. Species diversity and phylogeny of Salmo with emphasis on Southern trouts (Teleostei, Salmonidae): Doctoral Dissertation, Swedish Museum of Natural History. [Google Scholar]
- Delling B. 2010. Diversity of western and southern Balkan trouts, with the description of a new species from the Louros River, Greece (Teleostei: Salmonidae). Ichthyol Explor Freshw 21: 331–344. [Google Scholar]
- Delling B, Crivelli AJ, Rubin JF, Berrebi P. 2000. Morphological variation in hybrids between Salmo marmoratus and alien Salmo species in the Volarja stream, Soca River basin, Slovenia. J Fish Biol 57: 1199–1212. [Google Scholar]
- Delling B, Doadrio I. 2005. Systematics of the trouts endemic to Moroccan lakes, with description of a new species (Teleostei: Salmonidae). Ichthyol Explor Freshw 16: 49–64. [Google Scholar]
- Doadrio I, Perea S, Yahyaoui A. 2015. Two new species of Atlantic trout (Actinopterygii, Salmonidae) from Morocco. Graellsia 71: e031. [CrossRef] [Google Scholar]
- Duftner N, Weiss S, Medgyesy N, Sturmbauer C. 2003. Enhanced phylogeographic information about Austrian brown trout populations derived from complete mitochondrial control region sequences. J Fish Biol 62: 427–435. [Google Scholar]
- Duméril A. 1858. Note sur une truite d'Algérie (Salar macrostigma, A. Dum.). C R Acad Sci Paris 47: 160–162. [Google Scholar]
- Estoup A, Largiader CR, Perrot E, Chourrout D. 1996. Rapid one-tube DNA extraction for reliable PCR detection of fish polymorphic markers and transgenes. Mol Mar Biol Biotechnol 5: 295–298. [Google Scholar]
- Ferguson A, Mason FM. 1981. Allozyme evidence for reproductively isolated sympatric populations of brown trout Salmo trutta L. in Lough Melvin, Ireland. J Fish Biol 18: 629–642. [Google Scholar]
- Froese R, Pauly D. 2019. FishBase, The Global Database of Fishes. http://www.fishbase.org. [Google Scholar]
- García-Marín JL, Utter FM, Pla C. 1999. Postglacial colonization of brown trout in Europe based on distribution of allozyme variants. Heredity 82: 46–56. [Google Scholar]
- Gauthier A, Berrebi P. 2007. La colonisation de l'île par différentes souches de truite. Guide de gestion de la truite macrostigma. 4–10. https://data.oreme.org/trout/home. [Google Scholar]
- Giuffra E, Bernatchez L, Guyomard R. 1994. Mitochondrial control region and protein coding genes sequence variation among phenotypic forms of brown trout Salmo trutta from northern Italy. Mol Ecol 3: 161–171. [CrossRef] [PubMed] [Google Scholar]
- Gratton P, Allegrucci G, Gandolfi A, Sbordoni V. 2013. Genetic differentiation and hybridization in two naturally occurring sympatric trout Salmo spp. forms from a small karstic lake. J Fish Biol 82: 637–657. [CrossRef] [PubMed] [Google Scholar]
- Guyomard R. 1989. Diversité génétique de la truite commune. Bull Fr Pêche Piscic 314: 118–135. [CrossRef] [Google Scholar]
- Guyomard R, Krieg F. 1986. Mise en évidence d'un flux génique entre populations naturelles de truite fario et souche de repeuplement dans deux rivières de Corse. Bull Fr Pêche Piscic 303: 134–140. [CrossRef] [Google Scholar]
- Karakousis Y, Triantaphyllidis C. 1990. Genetic structure and differentiation among Greek brown trout (Salmo trutta L.) populations. Heredity 64: 297–304. [Google Scholar]
- Kottelat M, Freyhof J. 2007. Handbook of European freshwater fishes. Publications Kottelat, Cornol, Switzerland. [Google Scholar]
- Lascaux JM, Lagarrigue T, Mennessier JM, Muracciole S. 2010. Analyse de la variabilité de la ponctuation et des caractères ornementaux des truites des cours d'eau corses: Étude réalisée par ECOGEA dans le cadre du programme de gestion de la truite corse. 31p. [Google Scholar]
- Leigh, JW, Bryant D. 2015. PopART: Full-feature software for haplotype network construction. Meth Ecol Evol 6: 1110–1116. [Google Scholar]
- Lerceteau-Köhler E, Schliewen U, Kopun T, Weiss S. 2013. Genetic variation in brown trout Salmo trutta across the Danube, Rhine, and Elbe headwaters: a failure of the phylogeographic paradigm? BMC Evol Biol 13: 176. [CrossRef] [PubMed] [Google Scholar]
- Librado P, Rozas J. 2009. DnaSP v5: a software for comprehensive analysis of DNA polymorphism data. Bioinformatics 25: 1451–1452. [CrossRef] [PubMed] [Google Scholar]
- Martinez P, Castro J, Pardo BG, Bouza C, Hermida M, Vilas R. 2009. High Ag-NOR-site variation associated to a secondary contact in brown trout from the Iberian Peninsula. Genetica 136: 419–427. [PubMed] [Google Scholar]
- Meraner A, Baric S, Pelster B, Dalla Via J. 2007. Trout (Salmo trutta) mitochondrial DNA polymorphism in the centre of the marble trout distribution area. Hydrobiologia 579: 337–349. [Google Scholar]
- Norden CR. 1961. Comparative osteology of representative salmonid fishes with particular reference to the grayling (Thymallus arcticus) and its phylogeny. J Fisheries Res Board Can 18: 679–971. [CrossRef] [Google Scholar]
- Olivari G, Brun G. 1988. Le nombre de caeca pyloriques dans les populations naturelles de truites communes Salmo trutta, Linné en Corse. Bull Ecol 19: 2–3. [Google Scholar]
- Pankhurst NW, Montgomery JC. 1994. Uncoupling of visual and somatic growth on the rainbow trout Oncorhynchus mykiss. Brain Behav Evol 44: 149–155. [CrossRef] [PubMed] [Google Scholar]
- Pomini FP. 1941. Ricerche sul Salmo macrostigma. Boll Pesca Idrobiol Pescicolt 16: 3–36. [Google Scholar]
- Pustovrh G, Sušnik Bajec S, Snoj A. 2011. Evolutionary relationship between marble trout of the northern and the southern Adriatic basin. Mol Phylogenet Evol 59: 761–766. [Google Scholar]
- Roule L. 1933. Le peuplement des cours d'eau de la Corse en poissons. Bull Fr Pêche Piscic 63: 61–62. [CrossRef] [Google Scholar]
- Sabatini A, Cannas R, Follesa MC, et al. 2011. Genetic characterization and artificial reproduction attempt of endemic Sardinian trout Salmo trutta L., 1758 (Osteichthyes, Salmonidae): experiences in captivity. Ital J Zool 78: 20–26. [CrossRef] [Google Scholar]
- Sabatini A, Podda C, Frau G, et al. 2018. Restoration of native Mediterranean trout Salmo cettii Rafinesque, 1810 (Actinopterygii, Salmonidae) populations using an electric barrier as mitigation tool. Europ Zool J 85: 137–149. [CrossRef] [Google Scholar]
- Sanz N. 2018. Phylogeographic history of brown trout: a review. In Lobón-Cerviá J, Sanz N, eds. Brown trout: biology, ecology and management. John Wiley & Sons Ltd. 17–63. [Google Scholar]
- Snoj A, Glamuzina B, Razpet A, et al. 2010. Resolving taxonomic uncertainties using molecular systematics: Salmo dentex and the Balkan trout community. Hydrobiologia 651: 199–212. [Google Scholar]
- Snoj A, Maric S, Sušnik Bajec S, Berrebi P, Janjani S, Schöffmann J. 2011. Phylogeographic structure and demographic patterns of brown trout in North-West Africa. Mol Phylogenet Evol 61: 203–211. [Google Scholar]
- Snoj A, Maric S, Berrebi P, Crivelli AJ, Shumka S, Sušnik S. 2009. Genetic architecture of trout from Albania as revealed by mtDNA control region variation. Genet Sel Evol 41: 22. [Google Scholar]
- Snoj A, Melkic E, Sušnik S, Muhamedagic S, Dovc P. 2002. DNA phylogeny supports revised classification of Salmothymus obtusirostris . Biol J Linn Soc 77: 399–411. [CrossRef] [Google Scholar]
- Splendiani A, Palmas F, Sabatini A, Caputo Barucchi V. 2019. The name of the trout: considerations on the taxonomic status of the Salmo trutta L., 1758 complex (Osteichthyes: Salmonidae) in Italy. Europ Zool J 86: 432–442. [CrossRef] [Google Scholar]
- Stearley RF, Smith GR. 1993. Phylogeny of the pacific trouts and salmons, Oncorhynchus, and genera of the family Salmonidae. Trans Am Fisher Soc 122: 1–33. [CrossRef] [Google Scholar]
- Suarez J, Bautista JM, Almodovár A, Machordom A. 2001. Evolution of the mitochondrial control region in Palaearctic brown trout (Salmo trutta) populations: the biogeographical role of the Iberian Peninsula. Heredity 87: 198–206. [CrossRef] [PubMed] [Google Scholar]
- Sušnik S, Knizhin I, Snoj A, Weiss S. 2006. Genetic and morphological characterization of a Lake Ohrid endemic, Salmo (Acantholingua) ohridanus with a comparison to sympatric Salmo trutta . J Fish Biol 68: 2–23. [Google Scholar]
- Sušnik S, Schöffmann J, Snoj A. 2004. Phylogenetic position of Salmo (Platysalmo) platycephalus Behnke 1968 from south-central Turkey, evidenced by genetic data. J Fish Biol 64: 947–960. [Google Scholar]
- Sušnik S, Weiss S, Tomljanovic T, Delling B, Treer T, Snoj A. 2007. Reticulate evolution: ancient introgression of the Adriatic brown trout mtDNA in softmouth trout Salmo obtusirostris (Teleostei: Salmonidae). Biol J Linn Soc 90: 139–152. [CrossRef] [Google Scholar]
- Tamura K, Peterson D, Peterson N, et al. 2011. MEGA5: Molecular evolutionary genetics analysis using maximum likelihood, evolutionary distance, and maximum parsimony methods. Mol Biol Evol 28: 2731–2739. [CrossRef] [PubMed] [Google Scholar]
- Tougard C, Justy F, Guinand B, Douzery EJP, Berrebi P. 2018. Salmo macrostigma (Teleostei, Salmonidae): nothing more than a brown trout (S. trutta) lineage? J Fish Biol 93: 302–310. [CrossRef] [PubMed] [Google Scholar]
- Turan, D, Dogan E, Kaya C, Kanyılmaz M. 2014a. Salmo kottelati, a new species of trout from Alakır Stream, draining to the Mediterranean in southern Anatolia, Turkey (Teleostei, Salmonidae). ZooKeys 462: 135–151. [Google Scholar]
- Turan D, Kalaycι G, Bektaş Y, Kaya C, Bayçelebi E. 2020. A new species of trout from the northern drainages of Euphrates River, Turkey (Salmoniformes: Salmonidae). J Fish Biol online (https://doi.org/10.1111/jfb.14321). [Google Scholar]
- Turan D, Kottelat M, Bektas Y. 2011. Salmo tigridis, a new species of trout from the Tigris River, Turkey (Teleostei: Salmonidae). Zootaxa 2993: 23–33. [Google Scholar]
- Turan D, Kottelat M, Engin S. 2009. Two new species of trouts, resident and migratory, sympatric in streams of northern Anatolia (Salmoniformes: Salmonidae). Ichthyol Explor Freshw 20: 333–364. [Google Scholar]
- Turan D, Kottelat M, Engin S. 2012. The trouts of the Mediterranean drainages of southern Anatolia, Turkey, with description of three new species (Teleostei: Salmonidae). Ichthyol Explor Freshw 23: 219–236. [Google Scholar]
- Turan D, Kottelat M, Engin S. 2014b. Two new species of trouts from the Euphrates drainage, Turkey (Teleostei: Salmonidae). Ichthyol Explor Freshw 24: 275–287. [Google Scholar]
- Turan D, Kottelat M, Kaya C. 2017. Salmo munzuricus, a new species of trout from the Euphrates River drainage, Turkey (Teleostei: Salmonidae). Ichthyol Explor Freshw 28: 55–63. [Google Scholar]
- Zaccara S, Trasforini S, Antognazza CM, Puzzi C, Robert Britton J, Crosa G. 2015. Morphological and genetic characterization of Sardinian trout Salmo cettii Rafinesque, 1810 and their conservation implications. Hydrobiologia 760: 205–223. [Google Scholar]
Cite this article as: Delling B, Sabatini A, Muracciole S, Tougard C, Berrebi P. 2020. Morphologic and genetic characterisation of Corsican and Sardinian trout with comments on Salmo taxonomy. Knowl. Manag. Aquat. Ecosyst., 421, 21.
All Tables
Morphometry of Salmo spp. Number of studied specimens (N) for certain measurements varies due to condition of preserved specimens.
Frequency distribution of scale counts from base of adipose fin to lateral line and left side branchiostegal counts in Salmo spp.
Frequency distribution of vertebral counts and caudal fin upper procurrent rays in Salmo spp.
All Figures
|
Fig. 1 Geographic position of the new sampled populations in Corsica and Sardinia. |
| In the text | |
|
Fig. 2 Measurements taken on Salmo specimens; 1, upper jaw depth, as largest depth of the maxilla and supramaxilla; 2, snout length, from symphysis of premaxilla to osseous orbit margin; 3, orbital horizontal diameter, between osseous orbital margin; 4, head depth, just posterior to orbit; 5, orbital vertical diameter, between osseous orbital margin; 6, length of maxilla, from premaxilla end to posterior end of maxilla; 7, upper jaw length, from symphysis of premaxilla to posterior end of maxilla; 8, lower jaw length, from symphysis of dentary to retroarticular; 9, pectoral fin length, from base of first ray to tip of longest ray; 10, body depth, at level of origin of dorsal fin; 11, dorsal fin length, from base to tip of longest ray; 12, pelvic fin length, from base of first ray to tip of longest ray; 13, body depth, at level of origin of anal fin; 14, adipose fin length, from origin to tip; 15, anal fin length, from base of first ray to tip of longest ray; 16, caudal peduncle length, from end of anal fin to middle base of caudal fin; 17, least depth of caudal peduncle; 18, length of upper caudal fin lobe, from base to tip of longest ray; 19, length of middle caudal fin ray, from base to tip of shortest ray; 20, length of lower caudal fin lobe, from base to tip of longest ray; 21 standard length (SL), from upper jaw symphysis to middle base of caudal fin; 22, predorsal length from upper jaw symphysis to origin of dorsal fin; 23, head length, from upper jaw symphysis to posterior tip of operculum; 24, premaxilla to preoperculum length, from premaxilla end of maxilla to posterior margin of preoperculum (HLpp); 25, prepelvic length, from upper jaw symphysis to origin of pelvic fin; 26, preanal length, from upper jaw symphysis to origin of anal fin; 27, interorbital width, transverse at narrowest part of skull; 28, body width, transverse at widest part of body at level of dorsal fin origin, above abdominal cavity. |
| In the text | |
|
Fig. 3 Radiograph of Salmo sp. POZ, NRM62572, 197.3 mm SL; Pozzi di Marmanu Corsica (same specimen as in Fig. 8E). Upper left; a thin membranous bone indicated with dashed white line. Upper right; the uncommon condition with three (i-iii) epurals in the caudal skeleton. |
| In the text | |
|
Fig. 4 Median-joining network of control region haplotypes of some trout samples (new Tyrrhenian haplotypes and AT, AD, DA, MA, ME and NA haplotypes from GenBank). Haplotypes are indicated by numbers as given in Table 2. Black circles are for nodes, and hatch marks are for mutation steps. |
| In the text | |
|
Fig. 5 Morphometric PC II plotted against meristic PC I for Salmo from Sardinia, Corsica and Spain in comparison to Atlantic basin S. trutta. |
| In the text | |
|
Fig. 6 Premaxilla to preoperculum length plotted against caudal peduncle length for Salmo from Sardinia, Corsica and Spain in comparison to S. macrostigma. Linear regression lines with 95% confidence bands are shown for each group separately. |
| In the text | |
|
Fig. 7 Box plot of premaxilla to preoperculum length as % of SL, totally 518 specimens 116-208 mm SL. Number of specimens is given for each sample separately. Samples in bold are detailed in Table 1. Additional samples given in capital letters (Delling, unpublished) refer to rivers or streams in the given regions (Table S1). Ezenam is a lake in Daghestan and labrax represents trout from Black Sea basin with an anadromous silvery and slender appearance. Turkey and Mediterranean are samples scattered in the regions. Boxes represent median value +/− 25% of the observations, and whiskers the inner fences. Asterisks are outside or far outside values. |
| In the text | |
|
Fig. 8 External aspect of seven of the trouts, Salmo sp., analyzed in the present study. Pictures A-F taken after fixation in formalin prior to transfer to ethanol. |
| In the text | |
Current usage metrics show cumulative count of Article Views (full-text article views including HTML views, PDF and ePub downloads, according to the available data) and Abstracts Views on Vision4Press platform.
Data correspond to usage on the plateform after 2015. The current usage metrics is available 48-96 hours after online publication and is updated daily on week days.
Initial download of the metrics may take a while.