| Issue |
Knowl. Manag. Aquat. Ecosyst.
Number 420, 2019
Topical Issue on Fish Ecology
|
|
|---|---|---|
| Article Number | 46 | |
| Number of page(s) | 9 | |
| DOI | https://doi.org/10.1051/kmae/2019035 | |
| Published online | 01 November 2019 | |
Research Paper
Genetic characterisation of European mudminnow (Umbra krameri) populations from the Sava River system
Caractérisation génétique des populations de poisson chien européen (Umbra krameri) du système de la rivière Sava
1
Institute of Zoology, Faculty of Biology, University of Belgrade, Studentski trg 16, 11001 Belgrade, Serbia
2
Marine Biology Station Piran, National Institute of Biology, Fornače 41, Piran, Slovenia
3
Department of Zoology, National Museum, Václavské náměstí 68, 115 79 Prague 1, Czech Republic
4
Faculty of Teacher Education, University of Zagreb, Savska cesta 77, 10000 Zagreb, Croatia
5
Department of Biology and Department of Ecology and Environment Protection, Faculty of Natural Sciences and Mathematics, University of Banja Luka, Mladena Stojanovića 2, 78000 Banja Luka, Republic of Srpska, Bosnia and Herzegovina
6
Department of Animal Science, Biotechnical Faculty, University of Ljubljana, Groblje 3, 1230 Domžale, Slovenia
* Corresponding author: This email address is being protected from spambots. You need JavaScript enabled to view it.
Received:
21
February
2019
Accepted:
25
September
2019
Abstract
Two new populations of the European mudminnow (Umbra krameri Walbaum, 1792) were discovered in the Sava River system, one in its middle part (Bosnia and Herzegovina) and the other in a tributary to the Kupa River (Croatia). The Croatian population is the most upstream mudminnow discovery in the Sava River system known to date. The genetic structure of the newly recorded mudminnow populations was examined using mitochondrial DNA and microsatellite loci. By adding these new populations to the analysis of the population genetic structure of mudminnow from the Sava River system, previously unresolved relationships between the populations from the upper and the lower Sava were clarified: the middle Sava populations were shown to be well outside the hybridisation zone with the Danubian clade, meaning the upstream boundary of this zone is confined to the lower Sava. The results also suggest that mudminnow populations in the Sava River system are less isolated than previously believed. Namely, intermediate gene-flow was detected when comparing the uppermost Sava population with the lower Sava populations. Taking these results into account, appropriate guidelines are proposed to preserve mudminnow populations from the Sava River system.
Résumé
Deux nouvelles populations de poisson chien européen (Umbra krameri Walbaum, 1792) ont été découvertes dans le système de la rivière Sava, l'une dans sa partie centrale (Bosnie-Herzégovine) et l'autre dans un affluent du fleuve Kupa (Croatie). La population croate est la découverte de poisson chien européen la plus en amont connue à ce jour dans le système de la rivière Sava. La structure génétique des populations de poisson chien européen nouvellement observées a été examinée à l'aide d'ADN mitochondrial et de loci microsatellites. En ajoutant ces nouvelles populations à l'analyse de la structure génétique des populations de poisson chien européen du système de la rivière Sava, on a clarifié les relations non résolues entre les populations de la Sava supérieure et de la Sava inférieure : les populations de la Sava moyenne se trouvaient bien au-delà de la zone d'hybridation, le clade danubien ayant démontré que la limite amont de cette zone est limitée à la Sava inférieure. Les résultats suggèrent également que les populations de poisson chien européen dans le système de la rivière Sava sont moins isolées qu'on ne le croyait auparavant. A savoir, un flux intermédiaire de gènes a été détecté en comparant la population de Sava la plus élevée avec les populations de Sava les plus basses. Compte tenu de ces résultats, des directives appropriées sont proposées pour préserver les populations de poisson chien européen de la rivière Sava.
Key words: Conservation / European mudminnow / microsatellites / mitochondrial DNA / Sava River system
Mots clés : Conservation / poisson chien européen / microsatellites / ADN mitochondrial / système de la rivière Sava
© S. Marić et al., Published by EDP Sciences 2019
 This is an Open Access article distributed under the terms of the Creative Commons Attribution License CC-BY-ND (https://creativecommons.org/licenses/by-nd/4.0/), which permits unrestricted use, distribution, and reproduction in any medium, provided the original work is properly cited. If you remix, transform, or build upon the material, you may not distribute the modified material.
1 Introduction
The European mudminnow (Umbra krameri Walbaum, 1792, hereinafter mudminnow) is endemic to the Danube and Dniester river drainages (Wanzenböck, 2004; Freyhof and Brooks, 2011; Sekulić et al., 2013). The species inhabits wetlands rich in aquatic vegetation, and densely overgrown backwaters (Povž et al., 2015). This species is highly endangered due to the specificity and rarity of these habitats that are disappearing both naturally and due to anthropogenic impacts, such as pollution, water regulation, draining or even dredging (Delić et al., 1997; Mrakovčić et al., 2006; Kuehne and Olden, 2014).
Owing to habitat loss, the distribution of mudminnow has become patchy with constant declines in population size (Vuković and Ivanović, 1971; Maitland, 2000; Simonović, 2001; Wilhelm, 2003; Freyhof, 2011; Freyhof and Brooks, 2011; Kuehne and Olden, 2014; Takács et al., 2015). Consequently, mudminnow has been given high protection at both the international and national levels in all countries throughout its range (Freyhof, 2011; Freyhof and Brooks, 2011).
In general, this species occurs in the lowlands of the Danube, Sava, Drava, Tisza, Prut and Dniester systems (Movchan, 1995; Wanzenbock, 2004; Kottelat and Freyhof, 2007; Kuehne and Olden, 2014 and references therein). However, the magnitude of the species areal reduction is critical, and is especially evident in Serbia, where all 10 historically (1860–) known populations disappeared by 1995 (Sekulić et al., 2013). On the other hand, some previously unrecorded populations have been detected over the last 30 yr: two in the Danube drainage in Serbia (Sekulić et al., 2013; Miljanović et al., 2016), several in the Drava and Mura River systems in Croatia and Slovenia (Mrakovčić and Kerovec, 1990; Povž, 1990; Delić et al., 1997; Govedič, 2010), three in the Sava River system in Croatia, Bosnia-Herzegovina and Serbia (Zanella, 1997; Sekulić et al., 1998; Petronić et al., 2010) and two in the Timis? and Jiu River systems in Romania (Covaciu-Marcov et al., 2018). As a small bodied fish, mudminnow is not easy to find (Movchan, 1995), and therefore, it is more likely that these populations were simply overlooked rather than newly established. Furthermore, these “new” populations were mostly recorded in well preserved localities (also historically). These findings suggest that there may be more unrecorded populations.
To study the phylogeography and inter-population variation of mudminnow, a recent genetic survey of the species was performed across its entire range (Marić et al., 2017), revealing three large mitochondrial clades geographically corresponding to the: (1) Danube–Drava–Dniester River systems, (2) Sava River system, and (3) Tisza River system. According to microsatellite analysis (Marić et al., 2017), a clear differentiation was recorded between the populations from the upper and the lower Sava River. However, the middle Sava was not included in the analyses, as there was no data on the species present in this part of the river.
Habitat loss and fragmentation leads to formation of small populations with little to no gene flow (Marić et al., 2017). In such populations, random genetic drift leading to loss of genetic diversity and inbreeding may impair the evolutionary potential of the species, pushing it toward local extinction risk. Therefore, the discovery of each new population and the protection of the corresponding habitat is an extremely beneficial contribution to the protection of the species.
In this study, we present two newly recorded mudminnow populations found in 2016. Both were discovered in the Sava River system, one in the middle and the other in the upper part of the river. As these two populations may be a possible source for re-establishing populations in areas where they have become extinct (Leiner, 1995; Povž, 1990), we examined their genetic constitution using mtDNA and microsatellite makers. By combining these new data with the data presented in Marić et al. (2017), we also re-evaluate the population structure of the mudminnow Sava clade.
2 Material and methods
2.1 Description of localities
In the middle Sava, the mudminnow was first discovered in the Kraljica stream (tributary to the Matura River, near the town of Srbac in Bosnia and Herzegovina) (Čolić, 2018). Later surveys also detected the species in the lower Matura River system, including the tributaries Karavida, Glibača and Adžaba, and in numerous springs in that area (Fig. 1).
The second newly recorded population inhabits the upper Odra River, just one kilometre below the confluence of the two streams that form this 45 km long river, which flows via the Kupa River into the Sava River near the town of Sisak (Fig. 1). The mudminnow was found at just one of six comprehensively studied sampling sites. This is the most upstream mudminnow discovery in the Sava system to date.
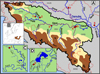 |
Fig. 1 (A) Map of sampling locations (Odra-1, Šuma Žutica-2, Kraljica-3, Gromiželj-4, Bakreni Batar-5, Kraljevac-6, Lugomir-7). The Sava River system is delineated with a thick, black solid line, while the borders between countries are shown with thin, red dotted lines. (B) Distribution of Umbra krameri in Europe according to Wanzenböck (2004). (C) Detailed map of the lower Kupa River system. (D) Detailed map of the lower Matura River system. |
2.2 Samples
Using electrofishing and landing nets, 19 specimens were collected from the Kraljica stream (Kraljica-3; 45°04′35″N, 17°23′25″E) in spring 2016, and 22 from the Odra River (Odra-1; 45°42′04″N, 16°09′07″E) in winter 2018.
A partial sample-set from Marić et al. (2017), representing the sampling locations from the Sava drainage (Šuma Žutica (Šuma Žutica-2; upper Sava), Gromiželj (Gromiželj-4) and Bakreni Batar (Bakreni Batar-5; lower Sava)) and two from the Danube drainage, Kraljevac (Kraljevac-6) neighbouring the Sava mouth, and Lugomir (Lugomir-7) upstream in the Danube River, were also incorporated in the study (Fig. 1, Tab. 1).
Sampling sites (asterisks denote populations described in Marić et al., 2017), mtDNA haplotypes, number of individuals sampled (N), expected heterozygosity (H E), allelic richness (A R) and average values of effective population sizes calculated from IM model estimation (θ).
2.3 Molecular analyses
Fin clips were sampled and stored in 96% ethanol. Total DNA was isolated using the phenol–chloroform–isoamyl alcohol method (Sambrook et al., 1989).
2.3.1 Mitochondrial DNA
The cytochrome b (cyt b) gene was PCR-amplified from 15 specimens from the Kraljica stream and 22 from the Odra River (Tab. 1), using GluF and ThrR primers and the PCR conditions as described in Machordom and Doadrio (2001). Bidirectional sequencing was carried out on an ABI Prism 3130xl DNA sequencer using the same primers.
Cytochrome b sequences were edited and aligned using the programs Chromas Lite 2.01 (http://www.technelysium.com.au/chromas.html; Technelysium Pty Ltd, Australia) and Clustal X (Thompson et al., 1997). All sequences were compared to the reference database from Marić et al. (2017), comprising of ten recorded haplotypes (seven Danube, two Tisza and one Sava haplotype) in 182 individuals from 17 populations (eight Danube populations, three Drava, two Tisza, three Sava and one Dniester).
2.3.2 Microsatellites
Seven microsatellite loci (UkrTet1, UkrTet3–UkrTet8) were amplified from all specimens from the newly recorded locations, according to the protocols of Winkler and Weiss (2009). Fragment analysis was performed on a 3130xl Genetic Analyzer and genotyped using Gene-Mapperv4.0 (Applied Biosystems).
Microsatellite loci were analysed in order to test for the presence of null alleles (Microchecker v2.2.3; Van Oosterhout et al., 2004), to determine the parameter of genetic diversity (H E) (GENETIX 4.04; Belkhir et al., 1996–2004), to test for Hardy-Weinberg equilibrium (HWE), to calculate F statistics and allelic richness (FSTAT 2.9.3.2; Goudet, 2002) and the most probable number of genetic groups (K) based on a two-step hierarchical STRUCTURE analysis (STRUCTURE v2.3; Pritchard et al., 2000) − in the first step, all localities were analysed together, while in the second step, pure Danubian population were removed to allow for a focus on only those populations carrying at least some amount of Sava genes. The ΔK method (Evanno et al., 2005) was applied to estimate the most probable K (Appendix A).
To investigate whether genetic differentiation may be influenced by stepwise mutations (R ST), we used an allele size randomization procedure (10 000 permutations) in SPAGeDi v.1.3 (Hardy and Vekemans, 2002) across all loci and genetic clusters. A R ST significantly larger than the permuted R ST (pR ST) suggests that stepwise mutations have had an important influence on the current differentiation. IMa2 software (Hey and Nielsen, 2007) was used to determine the gene flow and effective population size.
As IMa2 only assumes a stepwise mutation model (SMM) for microsatellite loci, two separate data sets were used and compared − one including all microsatellite loci and the other including only those five loci in which the individual permutation test and comparison of the R ST and F ST values were clearly in favour of SMM (UkrTet1, UkrTet3, UkrTet4, UkrTet5 and UkrTet7, see Sect. “Results”); in both datasets the HKY model of sequence evolution was applied to the mitochondrial sequences. Gene flow was estimated among all neighbouring populations and from several additional combinations selected according to biological rationale. Six parameters were estimated from each combination (using all seven and only five microsatellite loci): descendent (for both populations; θ 1, θ 2) and ancestral population sizes (θ ANC), relative time since divergence (t) and two population migration rates (2N1m2→1 and 2N2m1→2). For methodological details regarding microsatellite data analysis, see also Marić et al. (2011, 2017). Besides inferring historical gene-flow with IMa2, we have also used BayesAss Edition 3.0.4 (Wilson and Rannala, 2003) to evaluate contemporary migrations that occurred only in recent (1–3) generations. The analysis incorporated different delta values to ensure that proposed changes between chains at the end of the run were between 20 and 40% of the total chain length; for BayesAss analysis all microsatellite loci were considered and the analysis was set in line with suggestions from Meirmans (2014). The populations were analysed in two separate analyses to reduce the number of possible combinations for gene flow estimation; in one we estimated gene flow between the new populations (Odra-1 and Kraljica-3), Šuma Žutica-2 and Gromiželj-4 and in the other gene flow between Bakreni Batar-5 and the two Danubian populations (Kraljevac-6 and Lugomir-7). Three different sets of delta values (ΔA 0.40–0.60, Δm 0.20–0.30, ΔF 0.65–0.75) were selected in the accepted proportion of proposed changes (A 24–38%, m 28–37%, F 33–37%; 100 million iterations, 20 million burn-in and sampling frequency of 4000). All analyses were run in two repeats using different random seeds. Convergence of all parameter estimates was checked with Tracer (Rambaut et al., 2018).
3 Results
3.1 Mitochondrial DNA
A total of 1085 bp of the cyt b gene were resolved with sequence analysis in 37 individuals (15 from Kraljica-3 and 22 from Odra-1). After sequence alignment, all 37 sequences collapsed into a single haplotype. Following the nucleotide database search using BLAST, this haplotype was found to correspond with 100% nucleotide identity to the Sa1 haplotype (GenBank acc. no. KP898876), previously detected in the Sava drainage (Marić et al., 2017) and characterizing the Sava clade. This haplotype differed from the Da1 haplotype, which is the dominant Danubian haplotype recorded at the localities Lugomir-7 and Kraljevac-6, in seven nucleotide positions (0.65%). On the other hand, the Da1 haplotype differed from Da2 in a single nucleotide position (0.09%) and from Da3 in two nucleotides (0.18%).
3.2 Microsatellites
The Kraljica-3 and Odra-1 populations were found to be in HWE. No null alleles were detected. Expected heterozygosity and allelic richness were 0.516 and 4.61 in the Odra-1 population, and 0.579 and 6.29 in the Kraljica-3 population (Tab. 1).
Pair-wise F ST was 0.274 between Odra-1 and the geographically close Šuma Žutica-2 population, 0.065 between Kraljica-3 and the first downstream Gromiželj-4 population, and 0.142 between the Odra-1 and Kraljica-3 populations. Both newly recorded populations show the lowest F ST values in relation to Gromiželj-4, and the highest in relation to the Lugomir-7 population (Tab. 2).
Genetic differentiation of the whole sample set was assessed using hierarchical STRUCTURE analysis (Pritchard et al., 2000; Vähä et al., 2007). The most probable K values were K = 2 for the 1st and K = 4 for the 2nd step. In the 1st step, two genetic groups were detected, where one characterized the populations from the middle and upper Sava (Odra-1, Šuma Žutica-2 and Kraljica-3) and the second the Danubian Lugomir-7 population, while the populations from the lower Sava (Bakreni Batar-5 and Gromiželj-4) and Danubian Kraljevac-6 population, located near the mouth of the Sava River, were admixed with different proportions of parental genes. In the next step, the genetically uniform Lugomir-7 was excluded, as this is a Danubian population showing no introgression with the Sava lineage (unlike the Danubian Kraljevac-6 population where clear admixture with Sava lineage is evident both from mitochondrial and microsatellite data). After excluding the Lugomir-7 population, four genetically homogenous units emerged in the 2nd step (Kraljevac-6, Kraljica-3, Šuma Žutica-2 and Odra-1), whilst the populations of the lower Sava (Bakreni Batar-5 and Gromiželj-4) showed different levels of genetic mixing of those four genetic units with the dominant participation of the neighbouring populations (Fig. 2 and Appendix A).
The observed R ST value of the whole sample set was 0.374, with a pR ST value of 0.159 (P = 0.0000) and F ST value of 0.2007. The significantly higher R ST than pR ST, and considerably higher value than F ST, suggested that SMM contributed to genetic differentiation. However, when analysing the loci individually, this mutational influence was not apparent at two loci: for UkrTet6 and UkrTet8, the R ST (0.072 and 0.291, respectively) was considerably lower than both pR ST (0.323 and 0.338, respectively) and F ST (0.346 and 0.430, respectively).
No large discrepancies were observed between IM estimations with only five or all seven microsatellite loci; however, in some cases it was not possible to estimate the ancestral θ when considering all loci (Tab. 3). When comparing estimations done with five or seven loci, those with a narrower confidence interval were considered more reliable. In general, a narrower confidence interval (CI) was observed when using seven loci, and only population migration rates that differed significantly from zero were considered.
IM analysis of neighbouring populations revealed low to intermediate levels of historical migrations between the lower (Gromiželj-4 and Bakreni Batar-5) and the upper/middle Sava (Odra-1; Šuma Žutica-2 and Kraljica-3) mostly in the downstream direction towards the lower Sava: with the highest migrations from the Odra-1 and Šuma Žutica-2 towards the lower Sava (Gromiželj-4) (6.87 and 1.40 individuals per generation, respectively), followed by migrations primarily suggesting gene flow from peripheral Sava populations (Odra-1 and Gromiželj-4) to the central Sava population, Kraljica-3 (1.07 and 1.04 individuals per generation, respectively). A low historic population migration rate was also observed from the lower Sava (Bakreni Batar-5) to the middle Danube (Kraljevac-6) (1.60 individuals per generation).
BayesAss estimation revealed contemporary gene flow going only from Bakreni Batar-5 to Kraljevac-6 and from Gromiželj-4 to Kraljica-3 (24.01% [1.99–33.21] and 11.28% [1.58–20.64], respectively), while all other migrations did not differ significantly from zero.
The IM model showed that Gromiželj-4 and Bakreni Batar-5 were the largest populations in the Sava River watershed, with θ values of 20.79 (averaged over three estimations) and 10.02, respectively. Of the new Sava populations, the highest θ values were recorded at Kraljica-3 (5.06, averaged over three estimations), while Odra-1 (1.27, averaged over three estimations) and Šuma Žutica-2 (0.88, averaged over two estimations) were considerably smaller and of comparable size. In addition, the relative times since divergence calculated by the IM model were generally young between neighbouring populations and old when comparing the split between the Danubian and Sava watersheds (t 0 between Bakreni Batar-5 and Kraljevac-6 was 5.87); the only exception was the t 0 between Odra-1 and Gromiželj-4; however, estimations of this parameter did not converge nicely even after discarding the first 2.5 M generations.
Paired values of F ST for microsatellite marker data and their significance (* P < 0.05; *** P < 0.001).
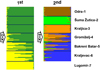 |
Fig. 2 Estimated population structure as inferred by hierarchical STRUCTURE analysis of microsatellite marker DNA data. Black lines separate sampling sites. The most probable K for the analysed samples shown in the arrows is based on the ΔK method; no further structures were detected in subsequent rounds (after the second step) and within the excluded clusters (K = 1). |
Migration estimates performed with IMa2 and BayesAss for each tested population pair. IMa2: time since divergence (t 0), effective population sizes of ancestral and the two descendent populations (qANC, q1, q2), historical population migration rates (2N1m2→1, 2N2m1→2) between the first (1) and second (2) populations with the lower and upper boundaries of the 95% highest posterior density (HPD) interval is given in brackets. All parameters except population migration rates are scaled by mutation rate. BayesAss: contemporary migration evaluations (M2→1, M1→2) between the first (1) and second (2) populations occurring only in recent (1–3) generations given in the percentage of migrants.
4 Discussion
The finding of the Sa1 cyt b haplotype in the middle Sava, represented by the Kraljica-3 population, confirmed the previous assumption (Marić et al., 2015, 2017) that this haplotype characterizes the Sava phylogeographic lineage while also leaving a trace in the Danube River, at least 50 km downstream of the Sava River mouth (Kraljevac-6 sampling site), where it was still detected to a minor extent (Tab. 1). The relatively high divergence between the Sa1 haplotype and the Danubian haplogroup, represented by the Da1, 2 and 3 haplotypes characterizing two Danubian populations, suggests long lasting and ancient separation of the Sava and Danubian mtDNA lineages, which according to Marić et al. (2017) dates back to the Middle Pleistocene. As inferred from microsatellite data, this is in line with only low historic population migration rate, observed in the direction from the lower Sava (Bakreni Batar-5) towards the middle Danube (Kraljevac-6). The presence of the Sava haplotype in the Danubian location Kraljevac-6 and the absence of the Danubian haplotypes in the Sava locality correspond with the observation that contemporary gene flow is only in the direction from Bakreni Batar-5 to Kraljevac-6. For more phylogenetic considerations and the historical processes that shaped the geographic haplotype distribution of U. krameri, see Marić et al. (2017).
On the basis of microsatellites, locations from the middle and upper Sava, including the new ones (Kraljica-3 and Odra-1), host well defined populations displaying high to moderate F ST values, while the reanalysis of the two neighbouring locations from the lower Sava (Gromiželj-4 and Bakreni Batar-5) confirmed the conclusion from Marić et al. (2017) that they host a single population. By adding the Kraljica-3 and Odra-1 populations to the analysis of the population genetic structure of mudminnow from the Sava River system, previously unresolved relationships between the populations from the upper (Šuma Žutica-2) and the lower Sava (Bakreni Batar-5 and Gromiželj-4) were clarified: the existence of a hybrid zone between the Sava and the Kraljevac-6 sampling sites in the Danube river system was confirmed, as previously suggested by Marić et al. (2017), and it was found that the upstream boundary of this zone extends well below the middle Sava (Kraljica-3 sampling site) (Tab. 1, Fig. 2).
Furthermore, STRUCTURE analysis revealed additional genetic sub-structuring in the Sava, which separated the three populations from the middle and upper Sava into three genetic sub-clusters that are also present in the admixed lower Sava population in varying proportions. However, such a genetic structure could also be a result of the founder effect coupled with the small sizes of the upper populations, as small populations undergo a reduction in genetic diversity more quickly than larger ones, due to the effects of genetic drift (also see Marić et al., 2017). Therefore, an alternative explanation is that the presence of genes from the two upper and middle Sava sub-clusters in the lower Sava is not due to gene-flow, but is instead a consequence of the lower Sava acting as a donor for the founders of the upriver populations. Over time, these small populations may have succumbed to an even higher loss of genetic diversity until they became almost monomorphic, while the large lower Sava populations retained their diversity and the signal of the founder genes are still present.
The comparison of the HE and AR values of the newly discovered Kraljica-3 and Odra-1 populations to the values of the entire species range (Marić et al., 2017) reveals that the Kraljica-3 population is characterized by an average level of genetic diversity while this is somewhat lower in the Odra-1 population. The genetic structure and diversity of mudminnow populations across the Sava River system varies between sampling sites, indicating the genetic spatial structure of the species. At first glance, genetic diversity appears to increase gradually from the upper towards the lower river system by geographic distance, with the Kraljica-3 population taking an intermediate position. However, the reliability of this assumption, based only on five populations, is questionable, also because the Šuma Žutica-2 population, located downstream from the Odra-1 population, deviates from the assumed trend, showing the lowest genetic diversity within the Sava River system (Tab. 1). On the other hand, the level of genetic diversity of all the Sava populations is positively associated with their effective population sizes (Tab. 1) − the higher the Ne, the higher the genetic diversity − which may suggest that population size is the main factor shaping the observed distribution of genetic diversity among populations. Nevertheless, in the case of the Kraljica-3 population (θ = 5.06), relatively high values of its diversity parameters may also indicate its communication with other adjacent populations in the Matura River system (see description of localities).
Inter-population differentiation measured by F ST values (Tab. 2) also implies that geographic distance is the primary driver of the genetic structure of populations. F ST values are generally low to moderate, showing temperate inter-population gradual differentiation, indicating a certain amount of communication and gene exchange between populations. This observation was also supported by the population migration (IM) analysis (detailed explanation below). Here, the Šuma Žutica-2 population is again an exception, as it was found to be considerably and more or less equally differentiated from other Sava populations, even in comparison to the Odra-1 population, less than 30 km away. Also, no statistically significant gene-flow was detected between the Šuma Žutica-2 and the other populations. This observation along with the low genetic diversity and relatively high pairwise F ST values of the Šuma Žutica-2 population indicates its localized distribution and restricted gene flow, which likely explains its pronounced position among the Sava populations.
Finally, we showed that mudminnow populations in the Sava are less isolated from each other than previously believed (Marić et al., 2017). Namely, intermediate gene-flow and population differentiation were also detected when comparing the uppermost Sava population (Odra-1) with the lower Sava (Gromiželj-4, Bakreni Batar-5), though it appears that the differentiation of the Šuma Žutica-2 population from the upper Sava is an exception to this pattern.
Converted per-generation population migration rates between these populations generally correspond to the migration of about one individual per generation, in the downstream direction from the upper (Odra-1) or middle Sava (Kraljica-3) towards the lower Sava (Gromiželj-4, Bakreni Batar-5). On the other hand, contemporary migrations between the lower and middle Sava population were detected flowing in the opposite direction − upstream from the lower to the middle Sava, indicating a potential change in the migration pattern. However, caution is advised when disentangling demographic, especially migration parameters using molecular markers. For IM models, Quinzin et al. (2015) demonstrated that while it is possible to distinguish between scenarios with or without gene flow, estimating its extent when different from zero is associated with relatively high error rates, while increasing the number of loci or sample size reduces the variance and credible interval of the estimates.
Furthermore, in this case, it should also be recognised that the 95% highest posterior density (HPD) intervals of contemporary (BAYESASS) immigrations and emigrations are relatively wide and overlap to at least some degree in all population pairs where such gene flow was detected (Tab. 3). To finally resolve whether a change in the direction of migration pattern truly happened, more microsatellite loci or other nuclear markers are required.
In the Sava River system, mudminnow populations from the upper Sava system are characterised by low values of genetic diversity and very small effective population sizes. These two populations likely became fragmented due to human impacts, thus their genetic structure may not reflect the natural evolutionary process but rather random drift. Marić et al. (2017) stated that it is questionable whether such small populations represent genetically viable entities with a good prospect of long-term survival without appropriate management. As inferred from the results of this study, the relatively large population size and genetic diversity of the Kraljica-3 population suggest its solid fitness and evolutionary potential. Furthermore, its genetic similarity with the upper Sava mudminnows and their geographic proximity that also frequently assures adaptive similarities of the adjacent populations make the Kraljica-3 population a suitable source for potential re-establishment or even genetic rescue (Whiteley et al., 2015), an under-used management option that shows great promise also in management of isolated freshwater fish populations (Robinson et al., 2017). However, despite this possibility, conservation efforts should be directed towards ensuring a favourable habitat status for mudminnow populations throughout its distribution range.
The genetic characterisation of European mudminnow populations from the Sava River system provides important findings applicable to the genetic management of the focal species. However, beyond that, we demonstrated that molecular genetic methods can serve as an effective tool for the basic guidelines for protection, conservation and sustainable management of other small-bodied and commercially unimportant freshwater species of high conservation value, which are often characterized by specialized requirements (habitat and/or diet), low fecundity, population size, dispersal capability, and are often geographically isolated or live in fragmented habitats (Reynolds et al., 2005; Sekulić et al., 2013; Kuehne and Olden 2014; Arthington et al., 2016).
Acknowledgements
This study received financial support from the Slovenian Research Agency and the Ministry of Education, Science and Technological Development of the Republic of Serbia (Grant No. 173045). RŠ was fully supported by the Ministry of Culture of the Czech Republic: project NAKI II (DG16P02B038) and DS by Slovenian Ministry of Education, Science and Sport and the European Regional Development Fund: Operational Programme for the Implementation of the EU Cohesion Policy in the period 2014–2020 (5442-15/2016/18).
Appendix
Hierarchical steps in estimating K (the number of genetic clusters) from STRUCTURE runs using the ΔK method. L(K) − posterior probability of K; stdev − standard deviation of L(K) from seven independent runs; ΔK − an ad hoc quantity, predictor of the real number of clusters (Evanno et al., 2005), best ΔK are in bold.
| K | L (K) | stdev | ΔK | |
|---|---|---|---|---|
| I step − all populations | 1 | –3955.10 | 0.29 | |
| 2 | –3612.51 | 0.74 | 203.73 | |
| 3 | –3420.99 | 8.46 | 2.10 | |
| 4 | –3247.25 | 0.57 | 139.12 | |
| 5 | –3152.56 | 0.98 | 84.074 | |
| 6 | –3140.49 | 3.19 | 22.55 | |
| 7 | –3200.28 | 21.93 | 0.33 | |
| 8 | –3252.80 | 14.42 | ||
| II step − Kraljevac-6, Bakreni Batar-5, Gromiželj-4, Kraljica-3, Šuma Žutica-2 i Odra-1 | 1 | –3222.51 | 0.28 | |
| 2 | –3022.24 | 1.06 | 30.45 | |
| 3 | –2854.29 | 4.31 | 15.62 | |
| 4 | –2753.60 | 1.91 | 71.89 | |
| 5 | –2790.00 | 47.54 | 0.54 | |
| 6 | –2851.99 | 20.71 | 2.34 | |
| 7 | –2865.50 | 51.98 |
References
- Arthington AH, Dulvy NK, Gladstone W, Winfield IJ. 2016. Fish conservation in freshwater and marine realms: status, threats and management. Aquat Conserv 26: 838–857. [Google Scholar]
- Belkhir K, Borsa P, Chikhi L, Raufaste N, Bonhomme F. 1996–2004. GENETIX 4.04, logiciel sous Windows TM pour la génétique des populations. Montpellier: Laboratoire Génome, Populations, Interactions, Université de Montpellier II. [Google Scholar]
- Covaciu-Marcov SD, Cupşa D, Telcean IC, Sas-Kovács I, Ferenţi S. 2018. Two new populations of the European mudminnow, Umbra krameri (Actinopterygii: Esociformes: Umbridae), in south-western Romania with the first record in the Banat region. Acta Ichthyol Piscat 48: 251–255. [CrossRef] [Google Scholar]
- Čolić S. 2018. Genetic characterization of the European mudminnow (Umbra krameri Walbaum, 1792) population from the Matura River drainage, Bosnia and Herzegovina. MA Thesis, University of Belgrade, Belgrade, Serbia. [Google Scholar]
- Delić A, Grlica ID, Razlog-Grlica J. 1997. Nova nalazišta crnke (Umbra krameri Walbaum, 1792) u Hrvatskoj [New records of the European mudminnow (Umbra krameri Walbaum, 1792) in Croatia]. Ribarstvo 55: 93–98. [Google Scholar]
- Evanno G, Regnaut S, Goudet J. 2005. Detecting the number of clusters of individuals using the software STRUCTURE: a simulation study. Mol Ecol 14: 2611–2620. [CrossRef] [PubMed] [Google Scholar]
- Freyhof J. 2011. Umbra krameri. The IUCN Red List of Threatened Species 2011:e.T22730A9380477. http://dx.doi.org/10.2305/IUCN.UK.2008.RLTS.T22730A9380477.en. Downloaded on 01 December 2018. [Google Scholar]
- Freyhof J, Brooks E. 2011. European Red List of Freshwater Fishes. Luxembourg: Publications Office of the European Union. [Google Scholar]
- Goudet J. 2002. FSTAT 2.9.3.2, a program to estimate and test gene diversities and fixation indices. Available: http://www2.unil.ch/popgen/softwares/fstat.htm. Accessed 15 October 2009. [Google Scholar]
- Govedič M. 2010. Ribe reke Drave med Mariborom in Hrvaško mejo 35 let po izgradnji hidroelektrarn [Fish of Drava River between Maribor and Croatian border 35 years after construction of hydro power plants]. In Zajc P, Colnarič N, Vreš B, eds. Book of Abstracts–International conference on the Drava River − Life in the river basin, Jovan Hadži Institute of Biology Scientific Research Centre SASA, Municipality Dravograd, RRA Koroška − Regional Development Agency for Koroška, Ljubljana–Dravograd, 22–23. [Google Scholar]
- Hardy OJ, Vekemans X. 2002. SPAGeDi a versatile computer program to analyse spatial genetic structure at the individual or population levels. Mol Ecol Notes 2: 618. [Google Scholar]
- Hey J, Nielsen R. 2007. Integration within the Felsenstein equation for improved Markov Chain Monte Carlo methods in population genetics. Proc Nat Acad Sci USA 104: 2785–2790. [CrossRef] [Google Scholar]
- Kottelat M, Freyhof, J. 2007. Handbook of European Freshwater Fishes. Kottelat, Cornol, and Freyhof, Berlin, 646 p. [Google Scholar]
- Kuehne ML, Olden DJ. 2014. Ecology and conservation of mudminnow species worldwide. Fisheries 39: 341–351. [CrossRef] [Google Scholar]
- Leiner S. 1995. The status of the European mudminnow, Umbra krameri Walbaum, 1792, in Croatia (Pisces: Umbridae). Ann Nat His Mus Wien 97B: 486–490. [Google Scholar]
- Machordom A, Doadrio I. 2001. Evidence of a Cenozoic Betic-Kabilian connection based on freshwater fish phylogeography (Luciobarbus, Cyprinidae). Mol Phylogenet Evol 18: 252–263. [Google Scholar]
- Maitland PS. 2000. Guide to Freshwater Fish of Britain and Europe. London: Hamlyn, 256 p. [Google Scholar]
- Marić S, Razpet A, Nikolić V, Simonović P. 2011. Genetic differentiation of European grayling (Thymallus thymallus) populations in Serbia, based on mitochondrial and nuclear DNA analyses. Genet Sel Evol 43: 2. [Google Scholar]
- Marić S, Snoj A, Sekulić N, Krpo-Ćetković J, Šanda R, Jojić V. 2015. Genetic and morphological variability of the European mudminnow Umbra krameri (Teleostei, Umbridae) in Serbia and in Bosnia and Herzegovina − a basis for future conservation activities. J Fish Biol 86: 1534–1548. [CrossRef] [PubMed] [Google Scholar]
- Marić S, Stanković D, Wanzenbock J, et al. 2017. Phylogeography and population genetics of the European Mudminnow (Umbra krameri) with a time-calibrated phylogeny for the family Umbridae. Hydrobiologia 792: 151–168. [Google Scholar]
- Meirmans PG. 2014. Nonconvergence in Bayesian estimation of migration rates. Mol Ecol Resour 14: 726–733. [Google Scholar]
- Miljanović B, Sipos S, Pankov N, Bajić A, Muller T. 2016. New Record of Umbra krameri Walbaum, 1792 in Serbia. In Melovski Lj, ed. Book of Abstracts–5TH Congress of Ecologists of the Republic of Macedonia with international participation, Macedonian Ecological Society, Skopje, 89. [Google Scholar]
- Movchan YV. 1995. Observations on the distribution of Umbra krameri WALBAUM, 1792, in the Ukraine. Ann Nat His Mus Wien 97B: 491–495. [Google Scholar]
- Mrakovčić M, Kerovec M. 1990. Umbra krameri. Ekološki glasnik 5/6: 68–69. [Google Scholar]
- Mrakovčić M, Brigić A, Buj I, Ćaleta M, Mustafić P, Zanella D. 2006. Red Book of Freshwater Fishes in Croatia. Ministry of Culture of the Republic of Croatia, State Institute for Nature Protection, Zagreb, 253 p. [Google Scholar]
- Petronić S, Panić G, Radošević D, Travar J. 2010. Rijetke i ugrožene biljne i životinjske vrste u posebnom rezervatu prirode “Gromiželj”. [Rare and endangered plant and animal species in the Special Natural Reserve “Gromizelj”]. In Šiljegović S, ed. Book of Abstracts–5TH Conference on integrative protection, Republic Institute for Protection of Cultural, Historical and Nature Heritage of Republic of Srpska, Banja Luka, 199–206. [Google Scholar]
- Povž M. 1990. Velika senčica (Umbra krameri Walbaum, 1792) − nova vrsta ribe Sloveniji [Mudminnow (Umbra krameri Walbaum, 1792) − New fish species in Slovenia]. Varstvo Narave 16: 45–48. [Google Scholar]
- Povž M, Gregori A, Gregori M. 2015. Sladkovodne ribe in piškurji v Sloveniji [Freshwater Fishes and Lampreys in Slovenia]. Zavod Umbra, Ljubljana, 293 p. [Google Scholar]
- Pritchard JK, Stephens M, Donnelly P. 2000. Inference of population structure using multilocus genotype data. Genetics 155: 945–959. [Google Scholar]
- Quinzin MC, Mayer F, Elvinger N, Mardulyn P. 2015. Theoretical expectations of the Isolation–Migration model of population evolution for inferring demographic parameters. Methods Ecol Evol 6: 610–620. [Google Scholar]
- Rambaut A, Drummond AJ, Xie D, Baele G, Suchard MA. 2018. Posterior summarisation in Bayesian phylogenetics using Tracer 1.7. Syst Biol 67: 901–904. [Google Scholar]
- Reynolds JD, Webb TJ, Hawkins LA. 2005. Life history and ecological correlates of extinction risk in European freshwater fishes. Can J Fish Aquat Sci 62: 854–862. [Google Scholar]
- Robinson ZL, Coombs JA, Hudy M, Nislow KH, Letcher BH, Whiteley AR. 2017. Experimental test of genetic rescue in isolated populations of brook trout. Mol Ecol 26: 4418–4433. [CrossRef] [PubMed] [Google Scholar]
- Sambrook J, Fritseh EF, Maniatis T. 1989. Molecular Cloning. A Laboratory Manual, 2nd edn. New York: Cold Spring Harbor Laboratory Press, 1626 p. [Google Scholar]
- Sekulić N, Budakov L, Branković D. 1998. Distribution of the European mudminnow Umbra krameri (Umbridae) in Serbia. Ital J Zool 65: 381–382. [CrossRef] [Google Scholar]
- Sekulić N, Marić S, Galamboš L, Radošević D, Krpo-Ćetković J. 2013. New distribution data and population structure of the European mudminnow Umbra krameri in Serbia and Bosnia and Herzegovina. J Fish Biol 83: 659–666. [CrossRef] [PubMed] [Google Scholar]
- Simonović P. 2001. Ribe Srbije [Fishes of Serbia]. Belgrade: NNK International, Institute for nature conservation of Serbia, Faculty of Biology, University of Belgrade, Belgrade, 247 p. [Google Scholar]
- Takács P, Erős T, Specziár A, et al. 2015. Population genetic patterns of threatened European Mudminnow (Umbra krameri Walbaum, 1792) in a fragmented landscape: implications for conservation management. PLoS ONE 10: e0138640. https://doi.org/10.1371/journal.pone.0138640 [CrossRef] [PubMed] [Google Scholar]
- Thompson JD, Gibson TJ, Plewniak F, Jeanmougin F, Higgins DG. 1997. The CLUSTAL_X windows interface, flexible strategies for multiple sequence alignment aided by quality analysis tool. Nucleic Acids Res 25: 4876–4882. [CrossRef] [PubMed] [Google Scholar]
- Vähä JP, Erkinaro J, Niemelä E, Primmer CR. 2007. Life-history and habitat features influence the within-river genetic structure of Atlantic salmon. Mol Ecol 16: 2638–2654. [CrossRef] [PubMed] [Google Scholar]
- Van Oosterhout C, Hutchinson WFD, Wills PM, Shipley P. 2004. MICRO-CHECKER: software for identifying and correcting genotyping errors in microsatellite data. Mol Ecol Notes 4: 535–538. [Google Scholar]
- Vuković T, Ivanović B. 1971. Slatkovodne ribe Jugoslavije [Freshwater Fishes of Yugoslavia]. Zemaljski muzej Bosne i Hercegovine, Sarajevo, 268 p. [Google Scholar]
- Wanzenböck J. 2004. European mudminnow (Umbra krameri) in the Austrian floodplain of the River Danube: conservation of an indicator species for endangered wetland ecosystems in Europe. In Akçakaya HR, Burgman MA, Kindvall O, Wood CC, Sjögren-Gulve P, Hatfield JS, Mccarthy MA, eds. Species Conservation and Management: Case Studies. Oxford: Oxford University Press, 200–207. [Google Scholar]
- Whiteley AR, Fitzpatrick SW, Funk WC, Tallmon DA. 2015. Genetic rescue to the rescue. Trends Ecol Evol 30: 42–49. [CrossRef] [PubMed] [Google Scholar]
- Wilhelm A. 2003. Growth of the mudminnow (Umbra krameri Walbaum) in river Ér. Tiscia 34: 57–60. [Google Scholar]
- Wilson GA, Rannala B. 2003. Bayesian inference of recent migration rates using multilocus genotypes. Genetics 163: 1177–1191. [PubMed] [Google Scholar]
- Winkler KA, Weiss S. 2009. Nine new tetranucleotide microsatellite DNA markers for the European mudminnow Umbra krameri . Conserv Genet 10: 1155–1157. [Google Scholar]
- Zanella, D. 1997. Rasprostranjenost i zaštita vrste Umbra krameri Walbaum, Pisces [Distribution and protection of the species Umbra krameri Walbaum, Pisces]. BSc thesis, University of Zagreb, Zagreb, Croatia. [Google Scholar]
Cite this article as: Marić S, Stanković D, Šanda R, Ćaleta M, Čolić S, Šukalo G, Snoj A. 2019. Genetic characterisation of European mudminnow (Umbra krameri) populations from the Sava River system. Knowl. Manag. Aquat. Ecosyst., 420, 46.
All Tables
Sampling sites (asterisks denote populations described in Marić et al., 2017), mtDNA haplotypes, number of individuals sampled (N), expected heterozygosity (H E), allelic richness (A R) and average values of effective population sizes calculated from IM model estimation (θ).
Paired values of F ST for microsatellite marker data and their significance (* P < 0.05; *** P < 0.001).
Migration estimates performed with IMa2 and BayesAss for each tested population pair. IMa2: time since divergence (t 0), effective population sizes of ancestral and the two descendent populations (qANC, q1, q2), historical population migration rates (2N1m2→1, 2N2m1→2) between the first (1) and second (2) populations with the lower and upper boundaries of the 95% highest posterior density (HPD) interval is given in brackets. All parameters except population migration rates are scaled by mutation rate. BayesAss: contemporary migration evaluations (M2→1, M1→2) between the first (1) and second (2) populations occurring only in recent (1–3) generations given in the percentage of migrants.
All Figures
|
Fig. 1 (A) Map of sampling locations (Odra-1, Šuma Žutica-2, Kraljica-3, Gromiželj-4, Bakreni Batar-5, Kraljevac-6, Lugomir-7). The Sava River system is delineated with a thick, black solid line, while the borders between countries are shown with thin, red dotted lines. (B) Distribution of Umbra krameri in Europe according to Wanzenböck (2004). (C) Detailed map of the lower Kupa River system. (D) Detailed map of the lower Matura River system. |
| In the text | |
|
Fig. 2 Estimated population structure as inferred by hierarchical STRUCTURE analysis of microsatellite marker DNA data. Black lines separate sampling sites. The most probable K for the analysed samples shown in the arrows is based on the ΔK method; no further structures were detected in subsequent rounds (after the second step) and within the excluded clusters (K = 1). |
| In the text | |
Current usage metrics show cumulative count of Article Views (full-text article views including HTML views, PDF and ePub downloads, according to the available data) and Abstracts Views on Vision4Press platform.
Data correspond to usage on the plateform after 2015. The current usage metrics is available 48-96 hours after online publication and is updated daily on week days.
Initial download of the metrics may take a while.