| Issue |
Knowl. Manag. Aquat. Ecosyst.
Number 419, 2018
Topical Issue on Fish Ecology
|
|
|---|---|---|
| Article Number | 4 | |
| Number of page(s) | 8 | |
| DOI | https://doi.org/10.1051/kmae/2017052 | |
| Published online | 31 January 2018 | |
Research Paper
The diet of reservoir perch before, during and after establishment of non-native tubenose goby
Le régime alimentaire de la perche d’un réservoir avant, pendant et après l'établissement du gobie demi-lune non-autochtone
Institute of Vertebrate Biology, Czech Academy of Sciences,
Květná 8,
603 65
Brno, Czech Republic
* Corresponding author: This email address is being protected from spambots. You need JavaScript enabled to view it.
Abstract
In recent decades, gobiid species have increased their distribution throughout Europe and now often represent the dominant genus along many rivers and canals. In this study, we assessed the role of tubenose goby (Proterorhinus semilunaris) as a prey species of native perch (Perca fluviatilis) in a lowland reservoir soon after their initial introduction in 1994 (sampling started 1998) and 17 years after establishment (2011–2012). We compare these data with perch diet composition from before introduction (1981–1982). Our data indicate that tubenose gobies quickly became the dominant species along the reservoir bankside, making them an attractive prey for ≥1 + perch. There was a clear increasing trend in the numbers of larger perch caught along the rip-rap, with the largest fish clearly specialising on gobies. As such, introduction of tubenose gobies has had a pronounced effect on food web and population dynamics along the littoral zone. While goby numbers appear to have dropped significantly in recent years, apparently due to predation pressure, further studies are needed to assess whether such changes have had any general impact on population and food web dynamics within the reservoir.
Résumé
Au cours des dernières décennies, les espèces de gobiidés ont élargi leur répartition dans toute l'Europe et représentent aujourd'hui souvent le genre dominant le long de nombreux cours d'eau et canaux. Dans cette étude, nous avons évalué le rôle du gobie demi-lune (Proterorhinus semilunaris) en tant que proie de la perche indigène (Perca fluviatilis) dans un réservoir de plaine peu après son introduction initiale en 1994 (échantillonnage commencé en 1998) et 17 ans après son établissement (2011–2012). Nous comparons ces données avec la composition du régime alimentaire des perches avant l'introduction (1981–1982). Nos données indiquent que les gobies demi-lune sont rapidement devenus l'espèce dominante le long des berges du réservoir, ce qui en fait une proie attrayante pour la perche ≥1+. Il y avait une nette tendance à la hausse du nombre de perches de plus grande taille capturées le long de l'enrochement, les plus gros poissons se spécialisant clairement dans les gobies. Ainsi, l'introduction du gobie demi-lune a eu un effet marqué sur la chaîne alimentaire et la dynamique des populations le long du littoral. Bien que le nombre de gobies semble avoir diminué considérablement au cours des dernières années, apparemment en raison de la pression exercée par la prédation, d'autres études sont nécessaires pour évaluer si ces changements ont eu un impact général sur la population et la dynamique du réseau trophique dans le réservoir.
Key words: Dietary shift / food preference / Gobiidae / invasive species / Perca fluviatilis / piscivore diet
Mots clés : changement de régime alimentaire / préférence alimentaire / Gobiidae / espèces envahissantes / Perca fluviatilis / régime alimentaire des piscivores
© L. Všetičková et al., Published by EDP Sciences 2018
 This is an Open Access article distributed under the terms of the Creative Commons Attribution License CC-BY-ND (http://creativecommons.org/licenses/by-nd/4.0/), which permits unrestricted use, distribution, and reproduction in any medium, provided the original work is properly cited. If you remix, transform, or build upon the material, you may not distribute the modified material.
1 Introduction
The Ponto-Caspian tubenose goby (Proterorhinus semilunaris) was first recorded in the Czech Republic in 1994 in the Mušov reservoir (Lusk and Halačka, 1995), part of the Nové Mlýny reservoir system on the River Dyje (Danube basin), more than 100 km from its known limit of distribution at the Austrian/Slovak border on the River Danube (Lelek, 1987; Roche et al., 2013). The most probable origin of these fish appears to be as live baitfish introduced by anglers from Danubian waters. From 1998 on (i.e. four years after introduction), the tubenose goby was the dominant species in the littoral fish community (Adámek et al., 2010). Since establishment, escapees from the Mušov population have spread up and down the River Dyje and into the River Morava (Fig. 1; Lusk et al., 2000; Prášek and Jurajda, 2005; Janáč et al., 2013).
While many recent studies have described the distribution of tubenose goby (Naseka et al., 2005; Hayden and Miner, 2009; Szaloky et al., 2015), its genetic diversity (Dillon and Stepien, 2001; Stepien et al., 2005) and their parasites (Kvach and Oguz, 2009; Huyse et al., 2015; Kvach et al., 2016), little or no information is presently available on the species' relationship with native fish species and its role in the food chain (but see Mikl et al., 2017). The European perch (Perca fluviatilis) is one of the most common fish predators in European waters, and certainly along the rip-rap banks of the Mušov reservoir (Adámek et al., 2010). While there have been numerous studies on fish predation by perch (e.g. Horppila et al., 2000; Specziár and Rezsu, 2009; Didenko and Gurbyk, 2016), with observations including cannibalism on perch fry (Lohniský, 1960; Craig, 2000) and/or predation upon YOY planktivorous cyprinids (Jacobsen et al., 2002; Dörner et al., 2003), very few have recorded perch foraging on benthic and/or shelter dwelling fish species such as gobies (see Almquist et al., 2010; Taraborelli et al., 2010). Further, while the consumption of gobiids by predatory fishes in general has been widely studied in North American waters (e.g. Kornis et al., 2013), it remains relatively understudied in Europe (but see Plachocki et al., 2012; Hempel et al., 2016; Mikl et al., 2017). Invasive non-native fish such as tubenose gobies have the potential to severely affect ecosystem relationships (Kornis et al., 2013) by causing changes to local food webs (Balshine et al., 2005; Copp et al., 2005; Johnson et al., 2005). In order to evaluate the potential impact of such species, however, detailed data are required on the interaction of such non-native species with native fish communities.
In this study, we describe long-term changes in the feeding behaviour of European perch in a lowland reservoir, with particular emphasis on the role of tubenose goby in the diet following their introduction.
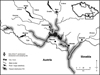 |
Fig. 1 The present range of tubenose goby (Proterorhinus semilunaris) in southern Moravia, Czech Republic. |
2 Material and methods
2.1 Site description
This study took place at the Mušov reservoir (N 48°53.42110′, E 16°33.20858′), the uppermost of three shallow lowland reservoirs that make up the Nové Mlýny reservoir system, situated on the River Dyje (Danube drainage; Czech Republic). Completed in 1978, the Mušov reservoir has a mean surface area of 528 ha and a maximum depth of 4.3 m (Vlček, 1984).
2.2 Fish sampling
Perch were collected using backpack electrofishing equipment (LENA, 220–240 V, 1.5–2 A, 80–90 Hz) along the littoral rip-rap bank reinforcement. In 1998 and 2011–2012 fish were caught once a month (from March to October), always before noon. Fish from 1981 to 1982 were obtained from the collection (preserved in formaldehyde) of the Academy of Sciences in Brno. A number of studies, both on the Dyje and elsewhere, have shown rip-rap to be the preferred habitat of tubenose gobies, with very few fish ever venturing away from the banks (e.g. Vašek et al., 2014). Immediately after being caught, the perch were sacrificed by overdosing with clove oil (∼0.1 ml l−1). In 1981–1982, whole fish were initially preserved in 4% formaldehyde and soon after measured to the nearest mm and weighed to the nearest 0.1 g (standard length; SL) in the laboratory. All specimens were retained in formaldehyde and stored in the zoological collection of the Czech Academy of Sciences for future analysis. In 1998 and 2011–2012, sacrificed fish were brought directly to the laboratory in crushed ice and subsequently measured, weighed and dissected, their digestive tracts being preserved in 4% formaldehyde for further analysis.
2.3 Diet analysis
Dietary remains from the digestive tracts were removed, identified in the laboratory under a stereo microscope (max. magnification 5.6) and classified to the lowest feasible taxonomic group (family, genus or species), with family level mainly used when analysing diet composition.
The percentage proportion of each dietary item (pooled from all digestive tracts) was expressed as relative percentage weight (%Wi), calculated according to Hyslop (1980):
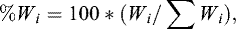 where Wi is the weight of diet item i (summed for all digestive tracts) and ΣWi represents the total weight of all dietary items (summed for all digestive tracts).
Frequency of occurrence (%Fi) was specified as the percentage of digestive tracts including dietary item i:
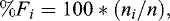 where ni is the number of fish with dietary item i in the digestive tract and n is the total number of fish whose digestive tracts contained food items (non-empty).
Food bulk in each digestive tract was assessed using an index of gut fullness IF (0/ooo), calculated as the ratio between diet weight (w) and eviscerated fish weight (Wevi):

The index of preponderance (IPi) was used to assess the “importance” of the dietary item i, according to Natarajan and Jhingran (1961):
 where %Wi is the percentage weight of the dietary item i and %Fi is the frequency of occurrence of the dietary item i (see above).
Costello's (1990) graphical method, as modified by Amundsen et al. (1996) was used for interpreting the role of particular food items in the diet (prey importance and feeding strategy). The newer, more precise approach of Amundsen et al. (1996) is based on the substitution of percentage abundance for prey-specific abundance (Pi), which is defined by the equation:
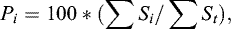 where Si = digestive tract content (by weight) of prey species i, and St = total digestive tract content (by weight) of fish with prey species i in their digestive tracts only.
Differences in prey occurrence between the three sample periods were tested using generalised linear models (GLM), utilising binomial (Bernoulli) distribution and the inverse link function. Differences in perch length (SL) eating fish (cyprinids, juvenile perch and/or gobies) or not eating fish were assessed using a linear model (LM) with log normal distribution. All analyses were performed using the R software package v. 3.0.3 (R Core Team, 2015), with significance level for all tests set at p < 0.05.
3 Results
In total, samples were extracted from 340 perch digestive tracts (4 tracts empty), 153 from 1981 to 1982, 85 from 1998 and 102 from 2011 to 2012. Although the mean SL of fish collected in 1981–82 was somewhat lower than that for fish collected later (Tab. 1; range 1981–1982 = 59–144 mm; 1998 = 56–164 mm; 2011–2012 = 56–174 mm), all fish collected were ≥1+. While the minimum size of fish captured varied little over the study, maximum size increased over time (1981/1982 = 64–144 mm SL; 1998 = 66–164 mm SL; 2011/2012 = 78–174 mm SL). Mean values for index of fullness increased from 81.1 in 1981–1982 to 149.8 in 1998 and 170.3 in 2011–2012.
In 1981–1982, prior to goby introduction, chironomid larvae were the dominant food item in perch diet (72 %Fi, 42 %Wi, IP 79), followed by zooplankton (34 %Fi, 18 %Wi, IP 16), Heteroptera (7 %Fi, 15 %Wi, IP 3) and dragonfly larvae (4 %Fi, 7 %Wi, IP 0.8) (Tab. 1). All other invertebrate groups were of low importance (IP < 1). Fish were of relatively low importance in the diet (2 %Fi, 9 %Wi, IP 0.4), with only small cyprinid remains found. An interpretation of the role of individual food classes in the diet indicates chironomid larvae as the dominant food item taken, with perch specialising on cyprinid fish, zooplankton, Heteroptera and molluscs (Fig. 2a).
In 1998, four years after goby establishment, chironomid larvae (68 %Fi, 34 %Wi, IP 68) and zooplankton (35 %Fi, 10 %Wi, IP 10) were of less importance in the diet than previously but still dominated as invertebrate prey. Hirudinea, on the other hand, had increased in importance (9 %Fi, 5 %Wi, IP 1). All other invertebrate food classes were of low importance (IP < 1). Compared with 1981–1982, the proportion of fish in the diet was considerably higher, with cyprinid prey increasing in importance (23 %Fi, 12 %Wi, IP 8) and tubenose goby now a dominant part of the diet (13 %Fi, 30 %Wi, IP 11). Furthermore, there was some evidence of cannibalism, with 0+ perch appearing in the diet (1 %Fi, 0.4 %Wi, IP < 0.01) (Tab. 1). While Chironomidae remained the dominant item in the diet, perch were now specialising on fish prey (cyprinids, tubenose goby, 0+ perch) and zooplankton (Fig. 2b).
In 2011–2012, 17 years after establishment, zooplankton (65 %Fi, 14 %Wi, IP 42) were more important than chironomid larvae (58 %Fi, 11 %Wi, IP 29), with invertebrate prey and Hirudinea having increased considerably in importance (18 %Fi, 16 %Wi, IP 13). All other benthic macroinvertebrates were of low importance (IP < 1). 0+ perch were not found in this sample, and the proportion of cyprinid fish was reduced by around half over the previous sample (4 %Fi, 6 %Wi, IP 1). Tubenose goby, on the other hand, had increased slightly in importance (6 %Fi, 43 %Wi, IP 12). However, while tubenose goby biomass was higher the numbers taken had decreased, suggesting a switch to larger individuals (Tab. 1). Overall, zooplankton had become the dominant prey item, with Chironomidae reduced to a general item (i.e. eaten by a high percentage of fish but not dominant in the diet). Again, perch appeared to be specialising on fish prey (tubenose goby, cyprinids) along with Hirudinea (Fig. 2c).
Overall, there was a significant increase (p < 0.001) in the proportion of zooplankton in the diet by 2011–2012, and a significant decrease (p < 0.05) in chironomid larvae between 1981–1982 and 2011–2012 (Tab. 2). The proportion of native fish (cyprinids and juvenile perch) in the diet was significantly higher (p < 0.001) in 1998 than 1981–1982, but significantly lower than 1998 in 2011–2012 (p < 0.001). All other differences were non-significant (p > 0.05; Tab. 2).
While the size range of perch consuming fish was wide (66–174 mm SL), and overlapped strongly with that of perch with no fish in the digestive tract (36–162 mm SL), there was a clear increasing trend in the maximum size of perch taking fish over time (1981/1982–144 mm, 1998–164 mm, 2011/2012–174 mm; Tab. 3). Over the same period, there was a slight peak in maximum size of perch taking native fish (cyprinids and/or juvenile perch) or not consuming fish; however; in both cases, this was probably caused by a few relatively large fish and the relatively small sample size. Likewise, there was an increase in maximum size of perch taking gobies between 1998 and 2011/2012. Unfortunately, the small sample sizes prevented meaningful statistical analysis of year-to-year changes; however, analysis of the pooled data showed a significant difference in the mean SL of perch taking fish and those without fish (p < 0.001; Fig. 3), and a close to significant difference in the mean size of those taking cyprinids only and those taking gobies only, with the latter tending to be larger (p < 0.08; Fig. 3).
Diet composition of perch in the Mušov reservoir. Note: Fi = mean frequency of occurrence; Wi = mean percentage weight; IP = mean index of preponderance.
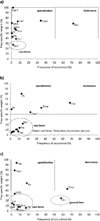 |
Fig. 2 Most important food items in the diet of perch from the Mušov reservoir in 1981–1982 (a), 1998 (b) and 2011–2012 (c) based on Costello's (1990) graphical interpretation (as modified by Amundsen et al. (1996)). Note: Mol = Mollusca, Hir = Hirudinea, Zoop = zooplankton, Crus = Crustacea, Het = Heteroptera, Odon = Odonata, Eph = Ephemeroptera, Col = Coleoptera, Trich = Trichoptera, Chir = Chironomidae, Dip = Diptera (except Chironomidae), Cyp = Cyprinid fish, PS = Proterorhinus semilunaris, PF = Perca fluviatilis, Mac = Macrophytes, Det = detritus. |
Differences in perch diet composition between the three study periods. N = number of perch with a specific food component; ΣW = total weight of specific food component; Pr(>|z|) = level of significance (generalised linear model), * = p < 0.05, *** = p < 0.001; na = not applicable. Native fish were cyprinids (1981/1982 and 2011/2012) and cyprinids + juvenile perch (1998).
Mean (min/max) standard length (SL) of perch with native fish (cyprinid or cyprinids + juvenile perch), tubenose goby, all fish combined or no fish remains in the digestive tract.
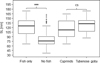 |
Fig. 3 Box plot illustrating the difference in mean size (standard length [SL] in mm) of perch consuming fish (cyprinids, juvenile perch and gobies), no fish, cyprinids only and tubenose gobies only (pooled data; linear model with log-normal distribution; significance set at * = p < 0.05). CS = close to significance at p < 0.08. |
4 Discussion
In our study, the tubenose goby quickly came to represent an attractive prey source for adult (≥1+) perch due to their rapid rise in numbers along the reservoir banks (Adámek et al., 2010) and their relatively small size (range 4–5 cm, max 5.6 cm; Všetičková et al., 2014), which makes them an ideal prey species for the small-mouthed perch. This appears to have prompted a shift in food web dynamics in the reservoir, i.e. an increasing number of large adult perch appear to have switched their main foraging habitat from open water to the littoral rip-rap zone, resulting in an increased intake of fish overall and, possibly, reduced predation on chironomids and cyprinids in favour of the tubenose goby. It has been suggested that, by altering energy flow through the aquatic food web, gobies could potentially affect the growth rate (Hensler and Jude, 2007) and body condition (Crane et al., 2015) of native predators. In turn, as predatory fish alter their feeding habits in response to changes in prey availability (Roseman et al., 2014), native species production may also be altered through top-down effects, the effects being especially strong if the predator specialises on novel prey species. An example of the type of effect such predation can have was documented in the Gulf of Gdańsk, where a shift to predation on non-native round gobies (40.7% mean contribution) appears to have resulted in the inclusion of Pomatoschistus spp. (43.1% mean contribution), a goby genus native to European fresh, brackish and marine waters, into the diet of 100–150 mm TL perch (Almquist et al., 2010). In our study, while there was no evidence of predation on previously avoided species, the shift in main prey and feeding site shown by large adult perch could result in reduced predation pressure on cyprinid species, potentially increasing cyprinid production in the reservoir. On the other hand, while gobies were caught all along the reservoir bankside in 1998, they were largely restricted to shallower gravelly banks by 2011 (Jurajda, pers. comm.). Over the same period, the numbers of gobies caught along the rip-rap banks dropped by around half, falling from 130 ind. per 50 m shoreline to just 63 ind. per 50 m (Jurajda, unpublished data). This would suggest that predation pressure from adult perch has had a strong impact on the goby population, with higher numbers surviving only in refuge habitats inaccessible to adult perch. As such, this may represent evidence of biological control of an invasive goby population.
Adámek and Jirásek (1986) described the diet of 63 adult perch from Mušov, caught using in open water using gill nets between 1981 and 1984 (mean SL = 181 and 186 mm). Unlike our results for the same period, they described fish as the dominant prey at around 50 %Wi (i.e. 25× more than our study), with roach (Rutilus rutilus) dominating, followed by perch and rudd (Scardinius erythropthalmus) and periphyton, detritus, Asellus and Chironomids. All other items were of low importance.
In contrast, our results for perch caught along the rip-rap bank in 1981/1982 described much smaller fish (mean SL 78 mm), specialising on Chironomids, zooplankton and macroinvertebrates, with a few cyprinid larvae taken by larger individuals (Tab. 1). Two points of interest are raised here. First, the clear difference in mean perch size caught at different sites in the 1980s, with juvenile fish predominating along the bank and adult fish (≥1+) in open water. From the 1990s on (i.e. after the introduction of tubenose goby), adult fish (mean SL 105 mm [1998] and 95 mm [2011–2012]) dominated the catch along the rip-rap bank. This was reflected in the diet, with a wider range of prey taken and the increased importance of fish prey, especially tubenose gobies (Tabs. 1 and 2). Further, it is also be reflected in the general increase in index of fullness over the sampling period, presumably caused by the increased intake of larger fish prey that take longer to digest. The presence of fish prey also led to extremely high index of fullness values in individual perch, as reflected by high variability in the index values. Interestingly, as in the data of Adámek and Jirásek (1986), we recorded a relatively small percentage of fish taking tubenose goby (12.7 %Fi [1998], 6.0 %Fi [2011–2012]); yet in each case these fish appeared to specialise on this food resource, with gobies representing 80.2 %Wi of the diet in 1998 and 93.9 %Wi in 2011–2012.
Secondly, there was a clear difference in diet between juvenile and adult (≥1+) fish in the 1980s, i.e. a shift from mainly Chironomids, zooplankton and macroinvertebrates to mainly fish and zooplankton (in this study, some fish were already displaying piscivory at 64 mm SL in 1981–1982). Just such an ontogenetic shift to obligate piscivory in perch of between 50 and 70 mm (depending on habitat/temperature) has been widely reported in the literature (Kratochvíl et al., 2008, Specziár and Rezsu, 2009). Though there is a shift to larger fish prey with age, perch continue to forage on a wide range of aquatic species of all sizes throughout their life (Craig, 2000), though benthic fish species are rarely taken. The few recent studies that have noted benthic fish in the diet have almost all been associated with the recent invasion of round goby (Neogobius melanostomus) in European and North American marine and freshwater ecosystems (e.g. Taraborelli et al., 2010), again suggesting that perch are capable of switching their feeding patterns when an attractive (i.e. abundant, easily caught) new food source becomes available. While not noted in this study, fish eggs have also occasionally been reported as an important perch dietary item (Zick et al., 2006). Zapletal et al. (2016), for example, noted large numbers of cyprinid eggs (together with the plant fragments to which they were stuck) in the diet of adult perch (162–300 mm SL) in spring/summer at another Czech reservoir, thereby also demonstrating an ability to temporarily switch to more profitable (in this case stationary) food items for a limited time when their absolute density/availability is high (see Stephens and Krebs, 1986; Zapletal et al., 2016).
Some authors (e.g. Paine, 1976; Walters and Juanes, 1993; Olson, 1996) have shown a relationship between predator and prey size; with larger perch consuming larger prey overall. As perch are opportunistic predators, however, differences in prey composition may also be explained by prey vulnerability rather than predator size alone (Craig, 2000). As already stated above, perch continue to forage on a wide range of large and small aquatic species and may even turn cannibalistic when young-of-the-year perch are abundant (Craig, 2000). In Lake Windermere (United Kingdom), for example, perch over a large size range (32–311 mm) fed on a wide spectrum of aquatic species, ranging from zooplankton to fish, though there was little relationship between perch size and the size of food item ingested (Craig, 1982). Dörner and Wagner (2003), while studying the relationship between perch and prey size in a German reservoir, found that 92 mm (total length, TL) perch were able to consume pikeperch (Sander lucioperca) of 54 mm TL, i.e. 59% of its own body length. Likewise, Almquist et al. (2010), who recorded perch taking round gobies following their introduction into the Gulf of Gdańsk (Poland), noted fish of up to half the perch's own body length being taken. These fish represented 41 %Wi of perch diet in the Gulf, a level similar to that for tubenose goby in this study in both 1998 (30 %Wi) and 2011–2012 (43 %Wi).
In general, our results concur with these studies, with perch of all sizes taking a wide range of prey items but larger fish specialising more on fish, and the largest perch specialising on gobies. In addition, our data strongly suggest a shift in population dynamics (habitat shift) along the littoral rip-rap zone, with high numbers of the relatively small tubenose goby attracting larger piscivorous perch from open waters.
In conclusion, tubenose gobies became an abundant and attractive prey for larger perch (and other piscivores; Mikl et al., 2017) soon after their introduction into the reservoir. In response, larger adult perch appear to have shifted their main foraging habitat to the banks and reduced their predation on cyprinid prey in favour of tubenose goby, which have since dropped dramatically in number (Jurajda, unpublished data). As such, introduction of tubenose gobies in 1994 has had a pronounced effect on food web and goby population dynamics along the littoral zone. Future studies will be needed, however, to assess whether such changes have had a more generalised effect on population or food web dynamics of other species in the reservoir.
Acknowledgements
This study was supported by the European Centre of Ichthyoparasitology through project ECIP P/505/12/G112. The authors would like to thank the representatives of the Moravian Anglers Union in Brno for supporting our research by allowing free access to waters under their control and Miroslav Prokeš for providing perch from his own collection (1981–1982).
References
- Adámek Z, Jirásek J. 1986. Biological value and food biology of commercial fishes of the Mušov and Věstonice reservoirs. Folia Univ Agric Brno 1–71. [Google Scholar]
- Adámek Z, Jurajda P, Prášek V, Sukop I. 2010. Seasonal diet pattern of non-native tubenose goby (Proterorhinus semilunaris) in the lowland reservoir (Mušov, Czech Republic). Knowl Manag Aquat Ecosyst 397: 1–12. [Google Scholar]
- Almquist G, Strandmark AK, Appelberg M. 2010. Has the invasive round goby caused new links in Baltic food webs? Environ Biol Fish 89: 79–93. [CrossRef] [Google Scholar]
- Amundsen PA, Gabler HM, Staldvik FJ. 1996. A new approach to graphical analysis of feeding strategy from stomach contents data − modification of the Costello (1990) method. J Fish Biol 48: 607–614. [Google Scholar]
- Balshine S, Verma A, Chant V, Theysmeyer T. 2005. Competitive interactions between round gobies and logperch. J Great Lakes Res 31: 68–77. [Google Scholar]
- Copp GH, Kováč V, Ojaveer H, Rosenthal H. 2005. The introduction, establishment, dispersal and impact of introduced non-native fishes. J Appl Ichtyol 21: 241–241. [CrossRef] [Google Scholar]
- Costello MJ. 1990. Predator feeding strategy and prey importance: new graphical analysis. J Fish Biol 36: 261–263. [CrossRef] [Google Scholar]
- Craig JF. 1982. Some aspects of the feeding, growth and population dynamics of perch, Perca fluviatilis L., in Windermere, University of Lancaster: Doctoral Dissertation, 141 p. [Google Scholar]
- Craig JF. 2000. Percid fishes, systematics, ecology and exploitation, Oxford UK: Blackwell Science. [CrossRef] [Google Scholar]
- Crane DP, Farrell JM, Einhouse DW, Lantry JR, Markham JL. 2015. Trends in body condition of native piscivores following invasion of Lakes Erie and Ontario by the round goby. Freshw Biol 60: 111–124. [CrossRef] [Google Scholar]
- Didenko AV, Gurbyk AB. 2016. Spring diet and trophic relationships between piscivorous fishes in Kaniv Reservoir (Ukraine). Folia Zool 65: 15–26. [CrossRef] [Google Scholar]
- Dillon AK, Stepien CA. 2001. Genetic and biogeographic relationships of the invasive round (Neogobius melanostomus) and tubenose (Proterorhinus marmoratus) gobies in the Great Lakes versus Eurasian populations. J Great Lakes 27: 267–280. [CrossRef] [Google Scholar]
- Dörner H, Berg S, Jacobsen L, Hulsmann S, Brojerg M, Wagner A. 2003. The feeding behaviour of large perch Perca fluviatilis (L.) in relation of food availability: a comparative study. Hydrobiologia 506: 427–434. [CrossRef] [Google Scholar]
- Dörner H, Wagner A. 2003. Size-dependent predator-prey relationships between perch and their fish prey. J Fish Biology 62: 1021–1032. [CrossRef] [Google Scholar]
- Hayden TA, Miner JG. 2009. Rapid dispersal and establishment of a benthic Ponto-Caspian goby in Lake Erie: diel vertical migration of early juvenile round goby. Biol Invasion 11: 1767–1776. [CrossRef] [Google Scholar]
- Hempel M, Neukamm R, Thiel R. 2016. Effects of introduced round goby (Neogobius melanostomus) on diet composition and growth of zander (Sander lucioperca), a main predator in European brackish waters. Aquat Invasion 11: 167–178. [Google Scholar]
- Hensler SR, Jude DJ. 2007. Diel vertical migration of round goby larvae in the great lakes. J Great Lakes Res 33: 295–302. [CrossRef] [Google Scholar]
- Horppila J, Ruuhijarvi J, Rask M, Karppinen C, Nyberg K, Olin M. 2000. Seasonal changes in the diets and relative abundances of perch and roach in the littoral and pelagic zones of a large lake. J Fish Biol 56: 51–72. [Google Scholar]
- Huyse T, Vanhove MPM, Mombaerts M, Volckaert FAM, Verreycken H. 2015. Parasite introduction with an invasive goby in Belgium double trouble. Parasitol Res 114: 2789–2793. [CrossRef] [PubMed] [Google Scholar]
- Hyslop EJ. 1980. Stomach content analysis-a review of methods and their application. J Fish Biol 17: 411–429. [Google Scholar]
- Jacobsen L, Berg S, Broberg M, Jepsen N, Skov C. 2002. Activity and food choice of piscivorous perch (Perca fluviatilis) in a eurytopic shallow lake: a radio-telemetry study. Freshw Biol 47: 2370–2379. [Google Scholar]
- Janáč M, Jurajda P, Kružiková L, Roche K, Prášek V. 2013. Reservoir to river passage of age-0+ year fishes, indication of a dispersion pathway for a non-native species. J Fish Biol 82: 994–1010. [CrossRef] [PubMed] [Google Scholar]
- Johnson TB, Bunnell DB, Knight CT. 2005. A potential new energy pathway in central Lake Erie: the round goby connection. J Great Lakes Res 31: 238–251. [CrossRef] [Google Scholar]
- Kornis MS, Sharma S, Vander Zanden MJ. 2013. Invasion success and impact of an invasive fish, round goby, in Great Lakes tributaries. Divers Distrib 19: 184–198. [CrossRef] [Google Scholar]
- Kratochvíl M, Peterka J, Kubečka J, Matěna J, Vašek M, Vaníčková I, Seďa J. 2008. Diet of larvae and juvenile perch, Perca fluviatilis performing diel vertical migrations in deep reservoir. Folia Zool 57: 313–323. [Google Scholar]
- Kvach Y, Oguz MC. 2009. Communities of metazoan parasites of two fishes of the Proterorhinus genus (Actinopterygii: Gobiidae). Helmintologia 46: 168–176. [Google Scholar]
- Kvach Y, Ondračková M, Jurajda P. 2016. First report of metacercariae of Cyathocotyle prussica parasitizing a fish host in the Czech Republic, Central Europe. Helminthologia 53: 257–261. [CrossRef] [Google Scholar]
- Lelek A. 1987. The freshwater fishes of Europe, Aula-Verlag GmbH Wiesbaden: Threatened fishes of Europe. [Google Scholar]
- Lohniský K. 1960. A contribution to the knowledge of perch (Perca fluviatilis Linnaeus, 1758) diet. Věst Čs Spol Zool 24: 139–161. [Google Scholar]
- Lusk S, Halačka K. 1995. The first finding of the tubenose goby, Proterorhinus marmoratus, in the Czech Republic. Folia Zool 44: 90–92. [Google Scholar]
- Lusk S, Lusková V, Halačka K, Lojkásek B. 2000. Changes in the species composition of the ichtyofauna in the territory of the Czech Republic after 1990. Biodiv ichtyof ČR 3: 21–28. [Google Scholar]
- Mikl L, Adámek Z, Všetičková L, Janáč M, Roche K, Šlapanský L, Jurajda P. 2017. Response of benthic macroinvertebrate assemblages to round (Neogobius melanostomus, Pallas 1814) and tubenose (Proterorhinus semilunaris, Heckel 1837) goby predation pressure. Hydrobiologia 785: 219–232. [CrossRef] [Google Scholar]
- Naseka AM, Boldyrev VS, Bogutskaya NG, Delitsyn VV. 2005. New data on the historical and expanded range of Proterorhinus marmoratus (Pallas, 1814) (Teleostei: Gobiidae) in eastern Europe. J Applied Ichtyhol 21: 300–305. [CrossRef] [Google Scholar]
- Natarajan AV, Jhingran AG. 1961. Index of preponderance − a model of grading the food elements in the stomach analysis of fishes. Indian J Fish 8: 54–59. [Google Scholar]
- Olson MH. 1996. Predator-prey interactions in size-structured fish communities: implications of prey growth. Oecelogia 108: 757–763. [CrossRef] [Google Scholar]
- Paine RT. 1976. Size-limited predation: an observational and experimental approach with the Mytilus-Pisaster interaction. Ecology 57: 858–873. [CrossRef] [Google Scholar]
- Plachocki D, Kobak J, Kakareko T. 2012. First report on the importance of alien gobiids in the diet of native piscivorous fishes in the lower Vistula River (Poland). Oceanol Hydrobiol Stud 41: 83–89. [CrossRef] [Google Scholar]
- Prášek V, Jurajda P. 2005. Expansion of Proterorhinus marmoratus in the Morava River basin (Czech Republic, Danube River watershed). Folia Zool 54: 189–192. [Google Scholar]
- R Core Team. 2015. R: A language and environment for statistical computing, Vienna, Austria: R Foundation for Statistical Computing. URL https://www.R-project.org/. [Google Scholar]
- Roche KF, Janáč M, Jurajda P. 2013. A review of Gobiid expansion along the Danube-Rhine corridor − geopolitical change as a driver for invasion. Knowl Manag Aquat Ecosyst 411: 01–24. [CrossRef] [Google Scholar]
- Roseman EF, Schaeffer JS, Bright E, Fielder DG. 2014. Angler-caught piscivore diets reflect fish community changes in Lake Huron. Trans Am Fish Soc 143: 1419–1433. [CrossRef] [Google Scholar]
- Specziár A, Rezsu ET. 2009. Feeding guilds and food resource partitioning in a lake fish assemblage: an ontogenetic approach. J Fish Biol 75: 247–267. [CrossRef] [PubMed] [Google Scholar]
- Stephens DW, Krebs JR. 1986. Foraging theory, Oxford UK: Oxford University Press. [Google Scholar]
- Stepien CA, Brown JE, Neilson ME, Tumeo MA. 2005. Genetic diversity of invasive species in the Great Lakes versus their Eurasian source populations: insights for risk analysis. Risk Anal 25: 1043–1060. [CrossRef] [PubMed] [Google Scholar]
- Szaloky Z, Bammer V, Gyorgy AI, Pehlivanov L, Schabuss M, Zornig H, Weiperth A, Eros T. 2015. Offshore distribution of invasive gobies (Pisces: Gobiidae) along the longitudinal profile of the Danube River. Fundam Appl Limnol 187: 127–133. [Google Scholar]
- Taraborelli AC, Fox MG, Johnson TB, Schaner T. 2010. Round goby (Neogobius melanostomus) population structure, biomass, prey consumption and mortality from predation in the Bay of Quinte, Lake Ontario. J Great Lakes Res 36: 625–632. [CrossRef] [Google Scholar]
- Vašek M, Všetičková L, Roche K, Jurajda P. 2014. Diet of two invading gobiid species (Proterorhinus semilunaris and Neogobius melanostomus) during the breeding and hatching season: no field evidence of extensive predation on fish eggs and fry. Limnologica 46: 31–36. [CrossRef] [Google Scholar]
- Vlček V. 1984. Rivers and reservoirs, Academia Praha CR: Geographical lexicon of CR. [Google Scholar]
- Všetičková L, Janáč M, Vašek M, Roche K, Jurajda P. 2014. Non-native western tubenose gobies Proterorhinus semilunaris show distinct site, sex and age-related differences in diet. Knowl Manag Aquat Ecosyst 414: 1–19. [Google Scholar]
- Walters CJ, Juanes F. 1993. Recruitment limitation as a consequence of natural selection for use of restricted feeding habitats and predation risk taking by juvenile fishes. Can J Fish Aquat Sci 50: 2058–2070. [CrossRef] [Google Scholar]
- Zapletal T, Adámek Z, Jurajda P, Roche K, Všeticková L, Mares J. 2016. Consumption of plant material by perch (Perca fluviatilis). Folia Zool 65: 95–97. [CrossRef] [Google Scholar]
- Zick D, Gassner H, Jagsch A, Patzner RA. 2006. Auswirkung und Populationsentwicklung des eingeschleppten Flussbarsches (Perca fluviatilis) im Grundlsee (Steiermark). Öesterr Fisch 59: 20–27. [Google Scholar]
Cite this article as: Všetičková L, Mikl L, Adámek Z, Prášek V, Roche K, Jurajda P. 2018. The diet of reservoir perch before, during and after establishment of non-native tubenose goby. Knowl. Manag. Aquat. Ecosyst., 419, 4.
All Tables
Diet composition of perch in the Mušov reservoir. Note: Fi = mean frequency of occurrence; Wi = mean percentage weight; IP = mean index of preponderance.
Differences in perch diet composition between the three study periods. N = number of perch with a specific food component; ΣW = total weight of specific food component; Pr(>|z|) = level of significance (generalised linear model), * = p < 0.05, *** = p < 0.001; na = not applicable. Native fish were cyprinids (1981/1982 and 2011/2012) and cyprinids + juvenile perch (1998).
Mean (min/max) standard length (SL) of perch with native fish (cyprinid or cyprinids + juvenile perch), tubenose goby, all fish combined or no fish remains in the digestive tract.
All Figures
|
Fig. 1 The present range of tubenose goby (Proterorhinus semilunaris) in southern Moravia, Czech Republic. |
| In the text | |
|
Fig. 2 Most important food items in the diet of perch from the Mušov reservoir in 1981–1982 (a), 1998 (b) and 2011–2012 (c) based on Costello's (1990) graphical interpretation (as modified by Amundsen et al. (1996)). Note: Mol = Mollusca, Hir = Hirudinea, Zoop = zooplankton, Crus = Crustacea, Het = Heteroptera, Odon = Odonata, Eph = Ephemeroptera, Col = Coleoptera, Trich = Trichoptera, Chir = Chironomidae, Dip = Diptera (except Chironomidae), Cyp = Cyprinid fish, PS = Proterorhinus semilunaris, PF = Perca fluviatilis, Mac = Macrophytes, Det = detritus. |
| In the text | |
|
Fig. 3 Box plot illustrating the difference in mean size (standard length [SL] in mm) of perch consuming fish (cyprinids, juvenile perch and gobies), no fish, cyprinids only and tubenose gobies only (pooled data; linear model with log-normal distribution; significance set at * = p < 0.05). CS = close to significance at p < 0.08. |
| In the text | |
Current usage metrics show cumulative count of Article Views (full-text article views including HTML views, PDF and ePub downloads, according to the available data) and Abstracts Views on Vision4Press platform.
Data correspond to usage on the plateform after 2015. The current usage metrics is available 48-96 hours after online publication and is updated daily on week days.
Initial download of the metrics may take a while.