| Issue |
Knowl. Manag. Aquat. Ecosyst.
Number 422, 2021
Topical Issue on Fish Ecology
|
|
|---|---|---|
| Article Number | 34 | |
| Number of page(s) | 6 | |
| DOI | https://doi.org/10.1051/kmae/2021033 | |
| Published online | 15 October 2021 | |
Short Communication
Desert pumpkinseed: diet composition and breadth in a Moroccan river
La perche-soleil du désert : composition et largeur de niche trophique dans une rivière Marocaine
1
MARE, Centro de Ciências do Mar e do Ambiente, Faculdade de Ciências, Universidade de Lisboa, Campo Grande, Lisboa, Portugal
2
cE3c, Centro de Ecologia, Evolução e Alterações Ambientais, Faculdade de Ciências, Universidade de Lisboa, Lisboa, Portugal
3
Departamento de Biología de la Conservación, Estación Biológica de Doñana − CSIC, Sevilla, Spain
* Corresponding author: chrisgenas@gmail.com
Received:
16
May
2021
Accepted:
28
September
2021
The widely invasive North American pumpkinseed sunfish, Lepomis gibbosus, is currently established in desert rivers in Morocco. The success of pumpkinseed in novel ecosystems has been associated with its generalist diet, but this trait remains unevaluated in arid regions. Desert rivers are harsh environments with limited water and prey availability which may adversely constrain the diet of fish. Here we studied the diet of pumpkinseed across 4 sites in the Draa River, embracing a 450 m elevational gradient covering from extremely dry lowlands to relatively humid highlands. We described pumpkinseed diet through the analysis of stomach contents of 82 individuals, collected in the fall of 2013. Pumpkinseed diet was dominated by Chironomidae in dry lowlands, while Ephemeroptera, Heteroptera, Trichoptera and Odonata were relevant prey in more humid highlands. Population diet breadth expanded with elevation, but individual specialization in diet was low among all sites. Our results highlight considerable changes in diet composition and breadth with aridity, suggesting that feeding plasticity and use of exclusive, locally abundant prey rather than generalized feeding may be associated with the success of pumpkinseed in most arid areas in desert rivers.
Résumé
La largement envahissante perche-soleil Nord-Américaine, Lepomis gibbosus, est établie aujourd'hui dans des rivières du désert au Maroc. Le succès de la perche-soleil dans les nouveaux écosystèmes a été associé à son régime alimentaire généraliste, mais cela reste non évalué dans les régions arides. Les rivières du désert sont des environnements hostiles avec peu d'eau et de proies disponibles ce qui contraint le régime alimentaire des poissons. Nous étudions le régime trophique de la perche-soleil sur quatre sites de la rivière Draa, le long d'un dénivelé de 450 m allant des plaines extrêmement arides aux hauteurs relativement humides. Nous avons décrit le régime alimentaire de la perche-soleil par l'analyse de l'estomac de 82 individus, capturés à l'automne 2013. Le régime alimentaire de la perche-soleil était dominé par les Chironomidae dans les plaines arides alors que les Ephéméroptères, Hétéroptères, Trichoptères et Odonates étaient des proies importantes dans les hauteurs plus humides. La largeur de la niche trophique s'accroissait avec l'altitude mais la spécialisation individuelle était faible entre tous les sites. Nos résultats mettent en évidence un changement considérable dans la composition et la largeur de la niche trophique en fonction de l'aridité suggérant que la plasticité alimentaire et l'utilisation exclusive de proies localement abondantes plutôt que l'alimentation généralisée peut être associée au succès de la perche-soleil dans les zones les plus arides des rivières du désert.
Key words: Invasive species / Lepomis gibbosus / aridity / elevation / feeding ecology
Mots clés : Espèce envahissante / Lepomis gibbosus / aridité / altitude / Écologie alimentaire
© C. Gkenas et al., Published by EDP Sciences 2021
 This is an Open Access article distributed under the terms of the Creative Commons Attribution License CC-BY-ND (https://creativecommons.org/licenses/by-nd/4.0/), which permits unrestricted use, distribution, and reproduction in any medium, provided the original work is properly cited. If you remix, transform, or build upon the material, you may not distribute the modified material.
The pumpkinseed sunfish, Lepomis gibbosus (Linnaeus, 1758), is native to the Great Lakes region in eastern North America (Scott and Crossman, 1973) but has been successfully introduced to over 30 countries in Central and South America, Europe, North Africa, and Anatolia Peninsula (Yavno et al., 2020). Pumpkinseed has been classified as an equilibrium strategist, but it can be very plastic in its native range and some non-native populations exhibit opportunistic traits that appear to contribute to its invasive success (Fox et al., 2007). Non-native populations inhabit a wide variety of freshwater systems, and desert rivers in the arid regions of Morocco currently constitute the limits of its distribution range. Several studies on the diet of non-native populations in Europe have reported macroinvertebrate and zooplankton consumption varying with prey availability and habitat characteristics (Godinho and Ferreira, 1998; Van Kleef et al., 2008; Gkenas et al., 2019), but little is known about the diet of pumpkinseed in desert rivers in arid regions.
Arid regions are characterized by low and uncertain precipitation, highly fluctuating temperatures, and water scarcity (Brito et al., 2014), which may have a critical influence on prey availability for fish in desert rivers (Balcombe et al., 2005). Desert rivers are highly dynamic systems in which dry periods, frequently involving the cessation of superficial flow, alternate with violent flash floods, proportionately more intense and more unpredictable than in other rivers (Harms et al., 2008). In general, aquatic macroinvertebrate abundance and diversity decrease with aridity, due to low primary productivity and habitat complexity (Bunn et al., 2003). Fish native to desert rivers have arguably developed feeding strategies to cope with these harsh and highly fluctuating conditions, but this may not be the case for non-native species which have evolved in more stable environments. Therefore, it is important to clarify whether successful invaders such as pumpkinseed become more of a generalist or rather more of a specialist in diet with aridity.
Here, we analyzed the diet of pumpkinseed across four sites in the Draa River in Northern Morocco, which embrace an elevational gradient covering from relatively humid highlands to extremely dry lowlands. Specifically, we analyzed patterns in the composition of the diet and in the population and individual diet breadth along this elevational gradient.
The Draa River has been described in detail by Clavero et al. (2015). In brief, the climate in the basin is arid with temperature ranging from 3 °C to 34 °C, and annual precipitation from 50 to 465 mm (https://www.worldclim.org/) (Fick and Hijmans, 2017). The Draa River flows for 1100 km from the High Atlas to the Atlantic Ocean but is usually dry in the last 600 km. Pumpkinseed were sampled in four sites, in the El Mansour Eddahbi Dam (D1), and 56.4 km (D2), 88.9 km (D3), and 135.6 km (D4) downstream. To avoid the period of flash floods, sampling was carried out in September and October 2013. During this period, precipitation and temperature ranged from 19 mm and 19.9–23.8 °C in D1 (1106 m a.s.l.) to 8 mm and 22.8–26.9 °C in D4 (674 m a.s.l). Water conductivity varied between 1318 µS/cm and 6274 µS/cm at D1 and D4, respectively, reflecting a downstream increase in salinity. Sampling was conducted with fyke nets in D1 and by electrofishing (50–75 direct pulses s−1) in the remaining sites, and pumpkinseed were euthanized with an overdose of clove oil and preserved in 4% formaldehyde.
We sampled and examined the stomach contents of 85 pumpkinseed, ranging from 40 to 80 mm standard length. We found 3 stomachs with less than 3 preys which were considered as empty and discarded to avoid confounding effects in the analysis of diet structure (Bowen, 1996). The remaining stomachs were similarly full among sites, as derived from visual estimation of percent volume fulness ranges. Prey items in each stomach were identified to the lowest recognizable taxon and counted.
For analysis, prey were grouped into ten categories, with “other” including both rare and unidentified prey items (Tab. 1). Prey categories accumulation curves based on random addition of stomachs and 1000 permutations (Gotelli and Colwell, 2001) reached an asymptote in all sites suggesting that the number of stomachs used were adequate to describe local diets (Supplementary Fig. S1). We described diet composition at each site using two conventional indices, the frequency of occurrence (F%) which is the proportion of non-empty stomachs containing a particular prey category, and the numerical frequency (N%), which is the proportional count of each prey category relative to the total prey count among fish (Hyslop, 1980). We analyzed variation in diet composition and breadth among sites using prey numerical frequency for each fish.
To summarize diet structure among sites, we performed a Non-Metric Multidimensional Scaling (nMDS), using the Bray-Curtis dissimilarity coefficient (Clarke et al., 2014). To reduce the influence of abundant prey in the analysis, data were previously square root transformed. We interpreted the first two ordination axes, with stress values <0.2 (Clarke et al., 2014). Analysis of Similarity (ANOSIM) was used to test for differences between sites, with overall significance calculated using 9999 permutations of the dataset and corrected for multiple testing using the Bonferroni sequential method. Similarity Percentage (SIMPER) analysis was used to identify the prey categories with the highest contribution to diet dissimilarity. Prey categories were ordered by their average contribution to the total average dissimilarity, with a cut-off at 50% of cumulative average dissimilarity (Clarke et al., 2014).
We quantified diet breadth at the population and individual levels. Population breadth was determined using the Shannon-Wiener index, which is maximized when populations use more prey, more evenly (Colwell and Futuyma, 1971). Individual breadth was determined using the index of Individual Specialization, which equals 1 when all individuals consume the full set of prey identified at the population-level and declines towards zero when individuals use smaller subsets of the population prey (Bolnick et al., 2002). Estimates for both indices were obtained using bootstrapped 95% confidence intervals (9999 permutations).
We used linear regression analysis to test for variation in diet composition and breadth with elevation. We used the mean location (i.e., centroids) from the nMDS scores in the firsts two axes and the mean Shannon-Wiener and Individual Specialization of fish in each site as response variables in the analysis. All analyses were conducted using the R software (v.4.0.0, R Core Team, 2020), and significance of statistical testing was assessed at P < 0.05.
In total, we analyzed 82 stomachs and 2257 prey items, with sample sizes per site varying between 19 and 21 stomachs and 324–759 prey (Tab. 1). Chironomidae were found in 98% of the stomachs and made up 53% of the total prey. Ephemeroptera were also often found (70%) but in low abundances (20%), while Odonata, Heteroptera and Trichoptera occurred less frequently in the stomachs (42–56%) and in small numbers (<10%). These results are coincident with those found in European rivers (Godinho and Ferreira, 1998; Almeida et al., 2009; Gkenas et al., 2019) and ponds (Van Kleef et al., 2008), suggesting that macroinvertebrates may constitute staple prey for pumpkinseed across its non-native range. Conversely, only small numbers of Cladocera (1%) and Copepoda (0.7%) were seldom found in pumpkinseed stomachs (<20%), but these have been found to be relevant prey for some non-native pumpkinseed populations in Lake Banyoles in Spain (García-Berthou and Moreno-Amich, 2000).
Diet composition varied considerably among sites (Tab. 1). Chironomidae made up only 30% of the total prey in D1 but increased in D2 (41%) and dominated the diet in D3 (71%) and D4 (82%). Additional important prey in D1 were Heteroptera (17%), Trichoptera (14%) and Odonata (12%). Ephemeroptera made up 43% of the total prey in D2 and were still relevant in D1 (22%) but not in D3 (14%) and in D4 (5%). The nMDS biplot highlighted considerable diet structure despite there was some overlap in scores among sites (Fig. 1a). The ANOSIM revealed significant variation between all sites, with the stronger separation in diet (AvD > 60%) occurring between D4 and D1 and D2 (Tab. 2). Dissimilarities in diet were consistently related to contributions of Chironomidae, with Ephemeroptera being also important for the differentiation of D4, and Heteroptera and Trichoptera for the differentiation of D1. Variation in nMDS1 scores showed a positive association with elevation (F1,2 = 25.07, R2 = 0.89, p = 0.037; Fig. 1b,) but no significant trend was found for nMDS2 (F1,2= 0.040, R2 = –0.47, p = 0.860; Fig. 1c). Spatial changes in diet have been commonly found in non-native populations of pumpkinseed reflecting foraging plasticity and changes in local prey supply (Almeida et al., 2009; Gkenas et al., 2016). This may also be the case in the Draa River, where the elevational gradient in diet composition probably reflects changes in richness and abundance of macroinvertebrates, and the decrease of Ephemeroptera, Heteroptera and Trichoptera and dominance of tolerant Chironomidae under more dry and salty conditions (Moreno et al., 2010; Colombetti et al., 2020). It is also possible that variation in diet can at least partially be associated with changes in prey availability under more stable environmental conditions prevailing in the dam (D1), as found in other studies (Almeida et al., 2009).
Population-level diet breadth increased with elevation (F1,3 = 43.89, R2 = 0.93, p = 0.022; Fig. 2a) but no significant trend was found for individual-level breadth (F1,2 = 4.42, R2 = 0.53, p = 0.170; Fig. 2b) which ranged between 0.65 and 0.74. The values for population diet breadth are close to figures found in southern Europe, namely in the Bullaque and Estena rivers in Spain (Almeida et al., 2009) and in the Ardila River in Portugal (Gkenas et al., 2019). Likewise, values for individual diet breadth were within the range reported for the Guadiana River in Portugal (Gkenas et al., 2016). The trends towards narrower diets and use of similar sets of prey by all individuals in dryer lowlands may reflect conditions of prey limitation associated to drought as found elsewhere (Magalhães, 1993). Furthermore, the use of exclusive, likely abundant prey, may also be associated to changes in fish assemblages across the elevational gradient (see Clavero et al., 2015), with low diet breadth at both the population and individual levels favoring prey partitioning among species.
Our results indicate that pumpkinseed may display a narrower diet with aridity. It would be important to further understand how feeding patterns are influenced by prey availability and interspecific trophic interactions and how these affect the spread of pumpkinseed in arid environments which are expected to expand under future warmer and dryer climates (see references in Brito et al., 2014). Integrative studies dealing with pumpkinseed population traits and habitat characteristics additional to diet, should thus be encouraged in desert rivers.
Supplementary Material
Figure S1. Prey categories accumulation curves for pumpkinseed Lepomis gibbosus in the Draa river in Northern Morocco, based on random addition of stomachs and the average of 1000 permutations. Access here
Acknowledgements
This work was funded by the National Geographic Society's Committee for Research and Exploration through grant #9188-12 and by the EBD-CSIC through a micro-project within the Spanish Severo Ochoa Program (SEV-2012-0262), also benefitting by the support of Land Rover Jaguar España. Permissions were obtained from the Haut Commissariat aux Eaux et Forêts et à la Lutte Contre la Désertification du Royaume du Maroc. We greatly acknowledge the company and field assistance provided by Raulo Arroyo, Carli Pérez, Iria Soto, Fali Becerra, Mariángeles Martínez Panke, Pepa Borrero and Manu Pérez. Additional support was provided by the Fundação para a Ciência e Tecnologia (FCT) through the strategic project UID/MAR/04292/2019 granted to MARE and the post-doc grants to Christos Gkenas (SFRH/ BPD/ 84859/2012) and to Filipe Ribeiro (SFRH/BPD/46761/2008) from the Programa Operacional Potencial Humano/Fundo Social Europeu (POPH/FSE).
References
- Almeida D, Almodóvar A, Nicola GG, Elvira B. 2009. Feeding tactics and body condition of two introduced populations of pumpkinseed Lepomis gibbosus: taking advantages of human disturbances? Ecol Freshw Fish 18: 15–23. [CrossRef] [Google Scholar]
- Balcombe SR, Bunn SE, McKenzie-Smith FJ, Davies PE. 2005. Variability of fish diets between dry and flood periods in an arid zone floodplain river. J Fish Biol 67: 1552–1567. [CrossRef] [Google Scholar]
- Bolnick DI, Yang LH, Fordyce JA, Davis JM, Svanbäck R. 2002. Measuring individual-level resource specialization. Ecology 83: 2936–2941. [CrossRef] [Google Scholar]
- Bowen SH. 1996. Quantitative description of the diet. In Murphy BR, Willis DW, eds. Fisheries techniques. Bethesda, MD: American Fisheries Society, pp. 513– 532. [Google Scholar]
- Brito JC, Godinho R, Martínez‐Freiría F, et al. 2014. Unravelling biodiversity, evolution, and threats to conservation in the Sahara‐Sahel. Biol Rev 89: 215–231. [CrossRef] [Google Scholar]
- Bunn SE, Davies PM, Winning M. 2003. Sources of organic carbon supporting the food web of an arid zone floodplain river. Freshw Biol 48: 1–17. [CrossRef] [Google Scholar]
- Clarke KR, Gorley RN, Somerfield PJ, Warwick RM. 2014. Change in marine communities: An approach to statistical analysis and interpretation, 3rd edn. Plymouth: Primer-E Ltd, 256 p. [Google Scholar]
- Clavero M, Esquivias J, Qninba A, et al. 2015. Fish invading deserts: non-native species in arid Moroccan rivers. Aquat Conserv Mar Freshw Ecosyst 25: 49–60. [CrossRef] [Google Scholar]
- Colombetti P, Calderon M, Tello J, González P, Jofré M. 2020. Relationships between aquatic invertebrate assemblages and environmental quality on saline wetlands of an arid environment. J Arid Environ 181: 104245. [CrossRef] [Google Scholar]
- Colwell RK, Futuyma DJ. 1971. On the measurement of niche breadth and overlap. Ecology 52: 567–576. [CrossRef] [PubMed] [Google Scholar]
- Fick SE, Hijmans RJ. 2017. Worldclim 2: new 1-km spatial resolution climate surfaces for global land areas. Int J Climatol 37: 4302–4315. [CrossRef] [Google Scholar]
- Fox MG, Vila-Gispert A, Copp GH. 2007. Life history traits of introduced Iberian pumpkinseed (Lepomis gibbosus) relative to native populations: can differences explain colonization success? J Fish Biol 71: 56–69. [CrossRef] [Google Scholar]
- García-Berthou E, Moreno-Amich R. 2000. Food of introduced pumpkinseed sunfish: ontogenetic diet shift and seasonal variation. J Fish Biol 57: 29–40. [CrossRef] [Google Scholar]
- Godinho FN, Ferreira MT. 1998. Spatial variation in diet composition of pumpkinseed sunfish, Lepomis gibbosus, and largemouth bass, Micropterus salmoides, from a Portuguese stream. Folia Zool 47: 205–213. [Google Scholar]
- Gkenas C, Magalhães MF, Cucherousset J, Domingos I, Ribeiro F. 2016. Long term patterns in the late summer dietary niche of the invasive pumpkinseed sunfish Lepomis gibbosus. Knowl Manag Aquat Ecosyst 417: 1–5. [Google Scholar]
- Gkenas C, Magalhães MF, Cucherousset J, Orjuela RL, Ribeiro F. 2019. Dietary niche divergence between two invasive fish in Mediterranean streams. Knowl Manag Aquat Ecosyst 420: 1–10. [Google Scholar]
- Gotelli NJ, Colwell RK. 2001. Quantifying biodiversity: procedures and pitfalls in the measurement and comparison of species richness. Ecol Lett 4: 379–391. [CrossRef] [Google Scholar]
- Harms TK, Sponseller RA, Grimm NB. 2008. Desert streams. In Jørgensen SE, Fath BD, eds. Ecosystems. Encyclopedia of Ecology. Oxford: Elsevier, pp. 871– 879. [CrossRef] [Google Scholar]
- Hyslop EJ. 1980. Stomach contents analysis − a review of methods and their application. J Fish Biol 17: 411–429. [Google Scholar]
- Magalhães MF. 1993. Feeding of an Iberian stream cyprinid assemblage—seasonality of resource use in a highly variable environment. Oecologia 96: 253–260. [CrossRef] [PubMed] [Google Scholar]
- Moreno JL, Angeler DG, De las Heras J. 2010. Seasonal dynamics of macroinvertebrate communities in a semiarid saline spring stream with contrasting environmental conditions. Aquat Ecol 44: 177–193. [CrossRef] [Google Scholar]
- R Development Core Team. 2020. R: A language and environment for statistical computing. Vienna, Austria: R Foundation for Statistical Computing. https://www.R-project.org/. [Google Scholar]
- Scott WB, Crossman EJ. 1973. Freshwater fishes of Canada. Bulletin Fisheries Research Board of Canada, Ottawa, 966 p. [Google Scholar]
- Van Kleef HH, Van der Velde G, Leuven RSE. 2008. Pumpkinseed sunfish (Lepomis gibbosus) invasions facilitated by introductions and nature management strongly reduce macroinvertebrate abundance in isolated water bodies. Biol Invasions 10: 1481–1490. [CrossRef] [Google Scholar]
- Yavno S, Gobin J, Wilson CW, Vila-Gispert A, Copp GH, Fox MG. 2020. New and Old World phylogeography of pumpkinseed (Lepomis gibbosus): the North American origin of introduced populations in Europe. Hydrobiologia 847: 345–364. [CrossRef] [Google Scholar]
Cite this article as: Gkenas C, Magalhães MF, Campos-Martin N, Ribeiro F, Clavero M. 2021. Desert pumpkinseed: diet composition and breadth in a Moroccan river. Knowl. Manag. Aquat. Ecosyst., 422, 34.
All Tables
Variation in the numeric frequency (N%) and in the frequency of occurrence (F%; in parentheses) of prey categories in the diet of pumpkinseed Lepomis gibbosus (40–80 mm SL) in the Draa river in Northern Morocco. Prey categories with numeric frequency >10% are highlighted in bold. Sites are ordered by increasing aridity and thus by decreasing elevation.
Results of the ANOSIM and SIMPER analyses of prey numeric frequency in the diet of pumpkinseed Lepomis gibbosus in the Draa river in Northern Morocco. Asterisks indicate significant differences in pairwise comparisons based on the sequential Bonferroni method (α = 0.05, k = 6). Prey categories contributing >20% to average dissimilarity (AvD) are highlighted in bold and ranks of prey contributions are shown in parentheses. Prey codes are: CHI, Chrironomidae; EPH, Ephemeroptera; HET, Heteroptera; TRI, Trichoptera.
All Figures
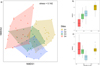 |
Fig. 1 Results of Non-Metric Multidimensional Scaling (nMDS) ordination of prey numeric frequency in the diet of pumpkinseed Lepomis gibbosus in the Draa river in Northern Morocco. a) nMDS biplot, with each site delimited by minimum convex polygons; b and c) box plots illustrating variation in the first and second nMDS scores for each site in relation to elevation, respectively; boxes represent the interquartile range (IQR; 25th and 75th percentiles), lines within boxes are the median, whiskers represent the 75th percentile − 1.5 x IQR and the 25th percentile + 1.5 x IQR, and dots beyond the whiskers are outliers. Stress value for ordination axes is indicated in panel a). |
| In the text | |
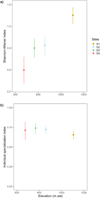 |
Fig. 2 Variation in diet breath of pumpkinseed Lepomis gibbosus in the Draa river in Northern Morocco in relation to elevation. a) Population breadth determined from the Shannon-Wiener index; b) Individual breath determined from the Individual Specialization index. Markers and error bars are the mean and the bootstrapped 95% confidence intervals for each index, respectively. |
| In the text | |
Current usage metrics show cumulative count of Article Views (full-text article views including HTML views, PDF and ePub downloads, according to the available data) and Abstracts Views on Vision4Press platform.
Data correspond to usage on the plateform after 2015. The current usage metrics is available 48-96 hours after online publication and is updated daily on week days.
Initial download of the metrics may take a while.