Fig. 3
Download original image
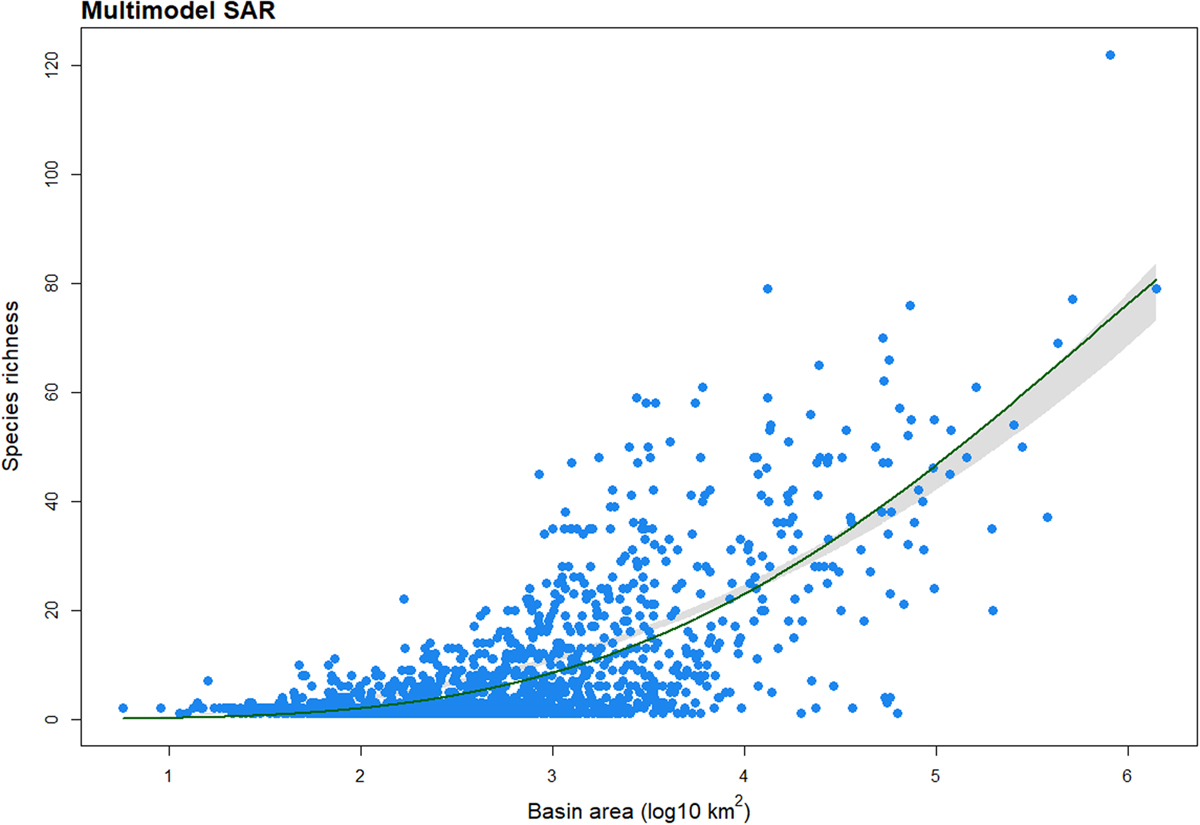
Species-area relationship (SAR), based on the log-transformed basin area. A multi-model inference approach was followed to determine a multi-model averaged curve with the best fit to the data (green curve, R2 = 0.542). Grey boundaries represent the bootstrap 95% confidence interval of the multi-model averaged curve. The SAR plot was produced in R, version 4.1.0 (R Core Team, 2021), using the “sars” package, version 1.3.6 (Matthews, Triantis, Whittaker, and Guilhaumon, 2019). All basins with a maximum Strahler above 2 were considered for this analysis, including 1554 river basins, representing 95.8% of RivFISH study area.
Current usage metrics show cumulative count of Article Views (full-text article views including HTML views, PDF and ePub downloads, according to the available data) and Abstracts Views on Vision4Press platform.
Data correspond to usage on the plateform after 2015. The current usage metrics is available 48-96 hours after online publication and is updated daily on week days.
Initial download of the metrics may take a while.