Fig. 2
Download original image
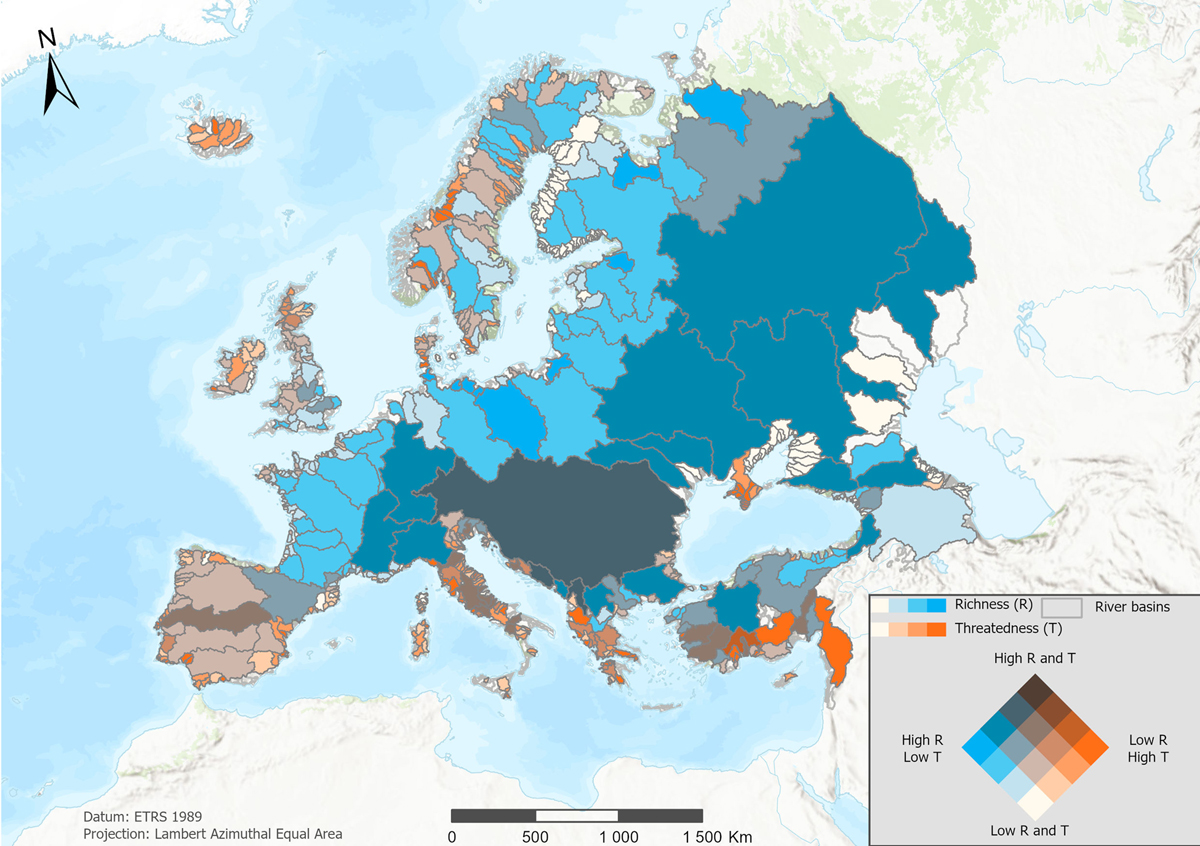
Map representing species richness versus the ratio of threatened species (listed as “Vulnerable”, “Endangered” or “Critically Endangered”) per river basin, considering the risk category in the IUCN (International Union for Conservation of Nature) Red List. The map was produced in ArcGIS Pro (version 3.2.2) with the European sea outlet basins layer from the Catchment Characterisation and Modelling 2 (CCM2) dataset (de Jager and Vogt, 2007). All basins with a maximum Strahler above 2 and harbouring more than 2 native species were considered for this analysis, including 756 river basins, representing 90.9% of RivFISH study area.
Current usage metrics show cumulative count of Article Views (full-text article views including HTML views, PDF and ePub downloads, according to the available data) and Abstracts Views on Vision4Press platform.
Data correspond to usage on the plateform after 2015. The current usage metrics is available 48-96 hours after online publication and is updated daily on week days.
Initial download of the metrics may take a while.