Fig. 5
Download original image
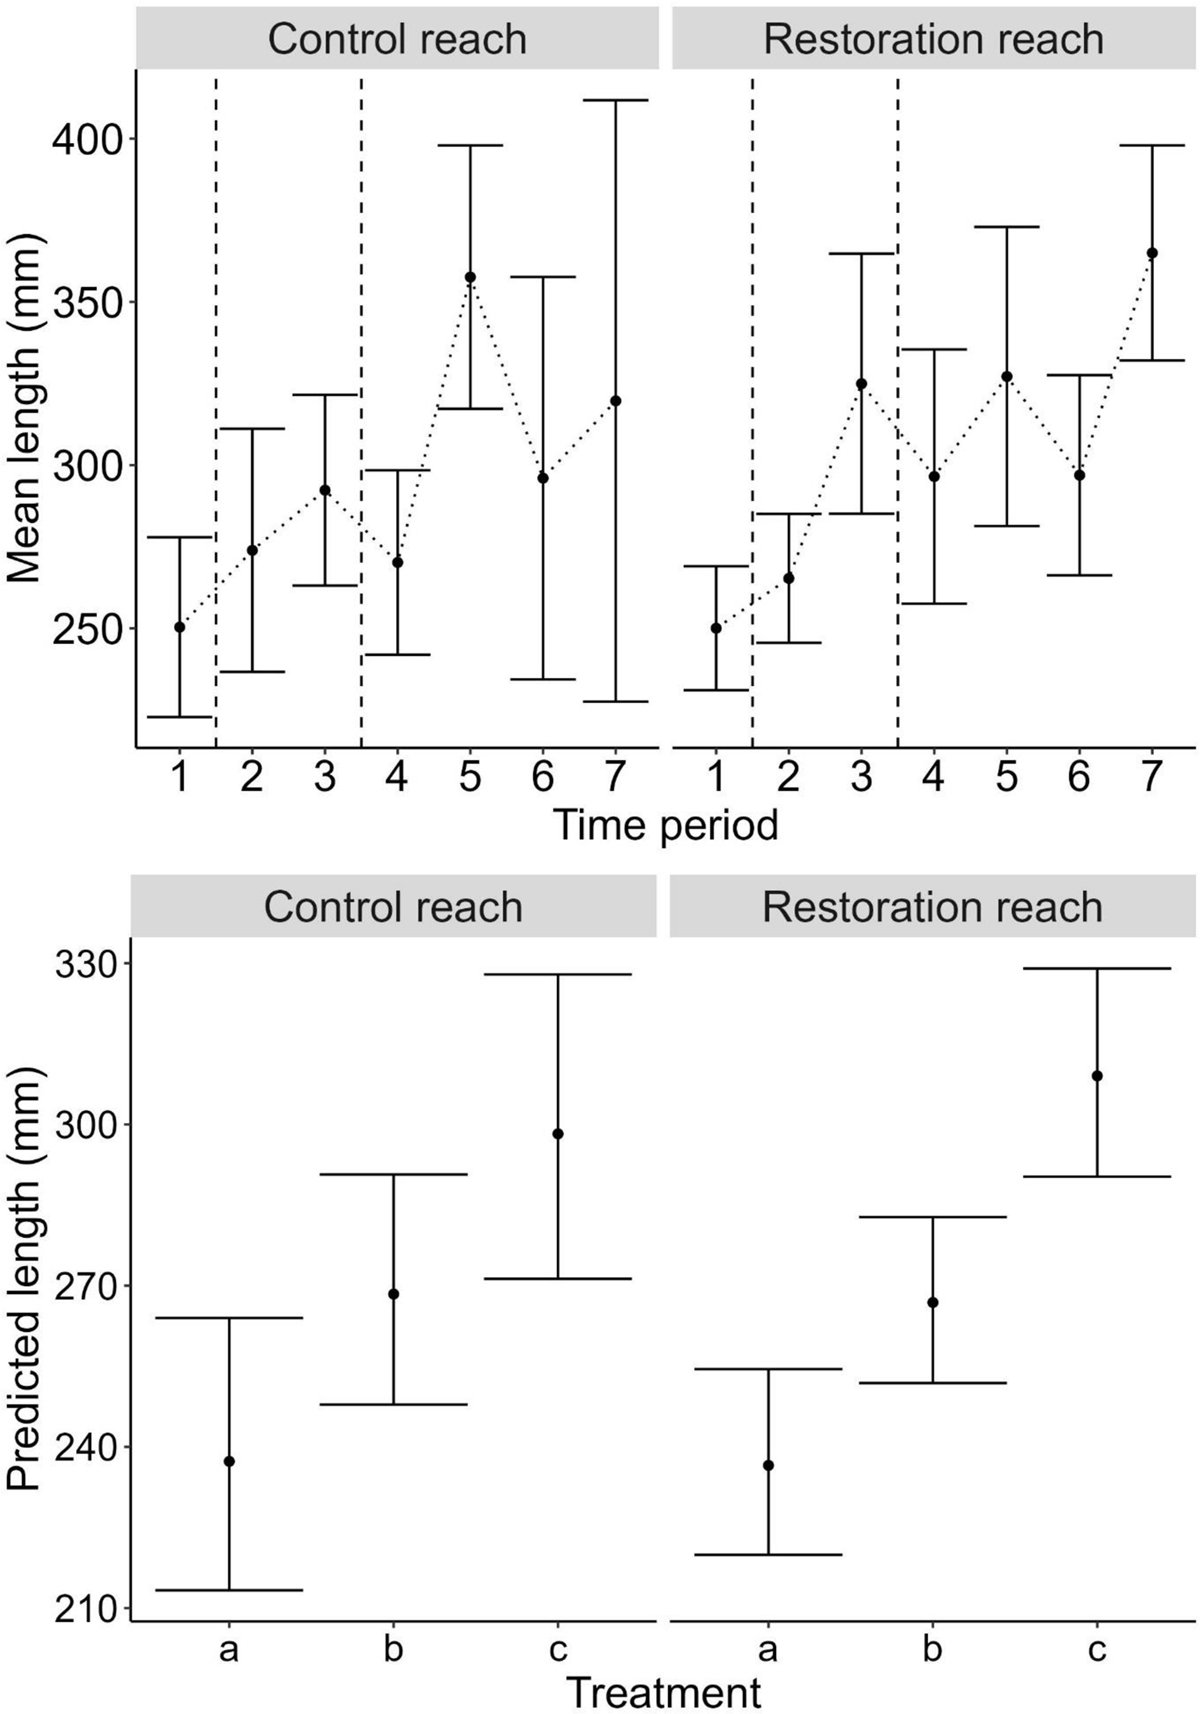
Plots showing changes in the length of European eel in the restoration and control reaches of the River Glaven during the study period. Top plot: line plot showing mean length with 95% confidence intervals in restoration and control reaches during pre-restoration (1), post-embankment removal (2–3) and post-re-meandering (4–7). Emanating vertical dotted lines denote embankment removal and re-meandering. Bottom plot: marginal effects plot from the linear model showing no significant impact of interaction of Reach and Treatment on eel length, where a = pre-restoration, b = post-embankment removal, and c = post-re-meandering. The error bars represent 95% confidence intervals of the estimated effects.
Current usage metrics show cumulative count of Article Views (full-text article views including HTML views, PDF and ePub downloads, according to the available data) and Abstracts Views on Vision4Press platform.
Data correspond to usage on the plateform after 2015. The current usage metrics is available 48-96 hours after online publication and is updated daily on week days.
Initial download of the metrics may take a while.