Fig. 4
Download original image
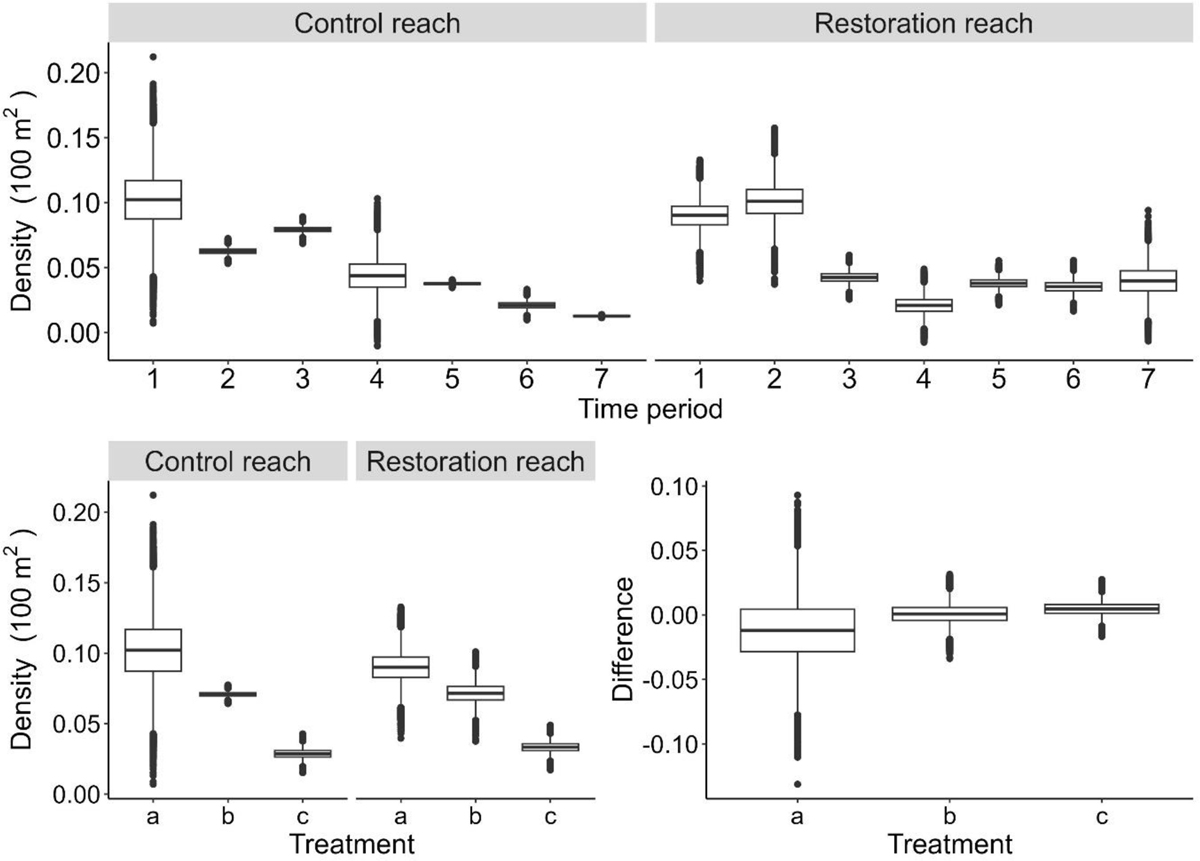
Boxplots showing changes in density of European eel in the restoration and control reaches of the River Glaven during the study period following a randomization approach. Top plot: boxplot showing bootstrapped density values during pre-restoration (1), post-embankment removal (2–3) and post-re-meandering (4–7). Bottom left plot: boxplot showing averaged bootstrapped densities per Treatment and Reach, where a = pre-restoration, b = post-embankment removal, and c = post-re-meandering. Bottom right plot: boxplot showing difference in bootstrapped densities between restoration and control reach per Treatment. Dark black horizontal line represents 50% of the data, light black horizonal lines represent 25% and 75% of the data (Interquartile Range − IQR) and light black vertical lines minimun and maximum data values in comparison to IQR. Dark black dots represent outliers.
Current usage metrics show cumulative count of Article Views (full-text article views including HTML views, PDF and ePub downloads, according to the available data) and Abstracts Views on Vision4Press platform.
Data correspond to usage on the plateform after 2015. The current usage metrics is available 48-96 hours after online publication and is updated daily on week days.
Initial download of the metrics may take a while.