Fig. 3
Download original image
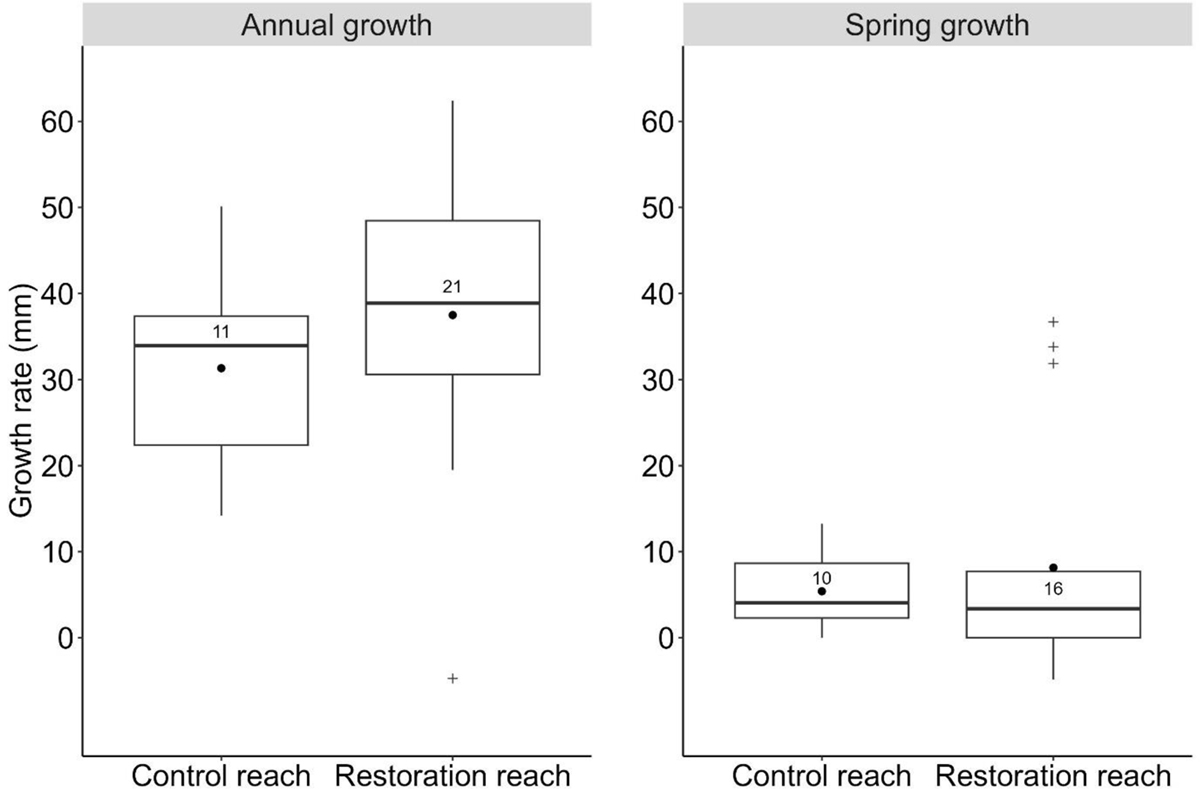
Spring growth (March–June 2009) and annual growth rate of two populations of European eel resident in the two adjacent reaches of the Hunworth restoration reach, calculated using length data of tagged and recaptured individuals between 2009 and 2012. Boxes represent all values between the 25th and 75th quartiles and show the median (—) and mean (•) for each category. Box plot whiskers represent minimum and maximum calculated growth increments for each population. Outliers (+) are also shown. n = number of individuals from which growth rate was calculated.
Current usage metrics show cumulative count of Article Views (full-text article views including HTML views, PDF and ePub downloads, according to the available data) and Abstracts Views on Vision4Press platform.
Data correspond to usage on the plateform after 2015. The current usage metrics is available 48-96 hours after online publication and is updated daily on week days.
Initial download of the metrics may take a while.