Fig. 5
Download original image
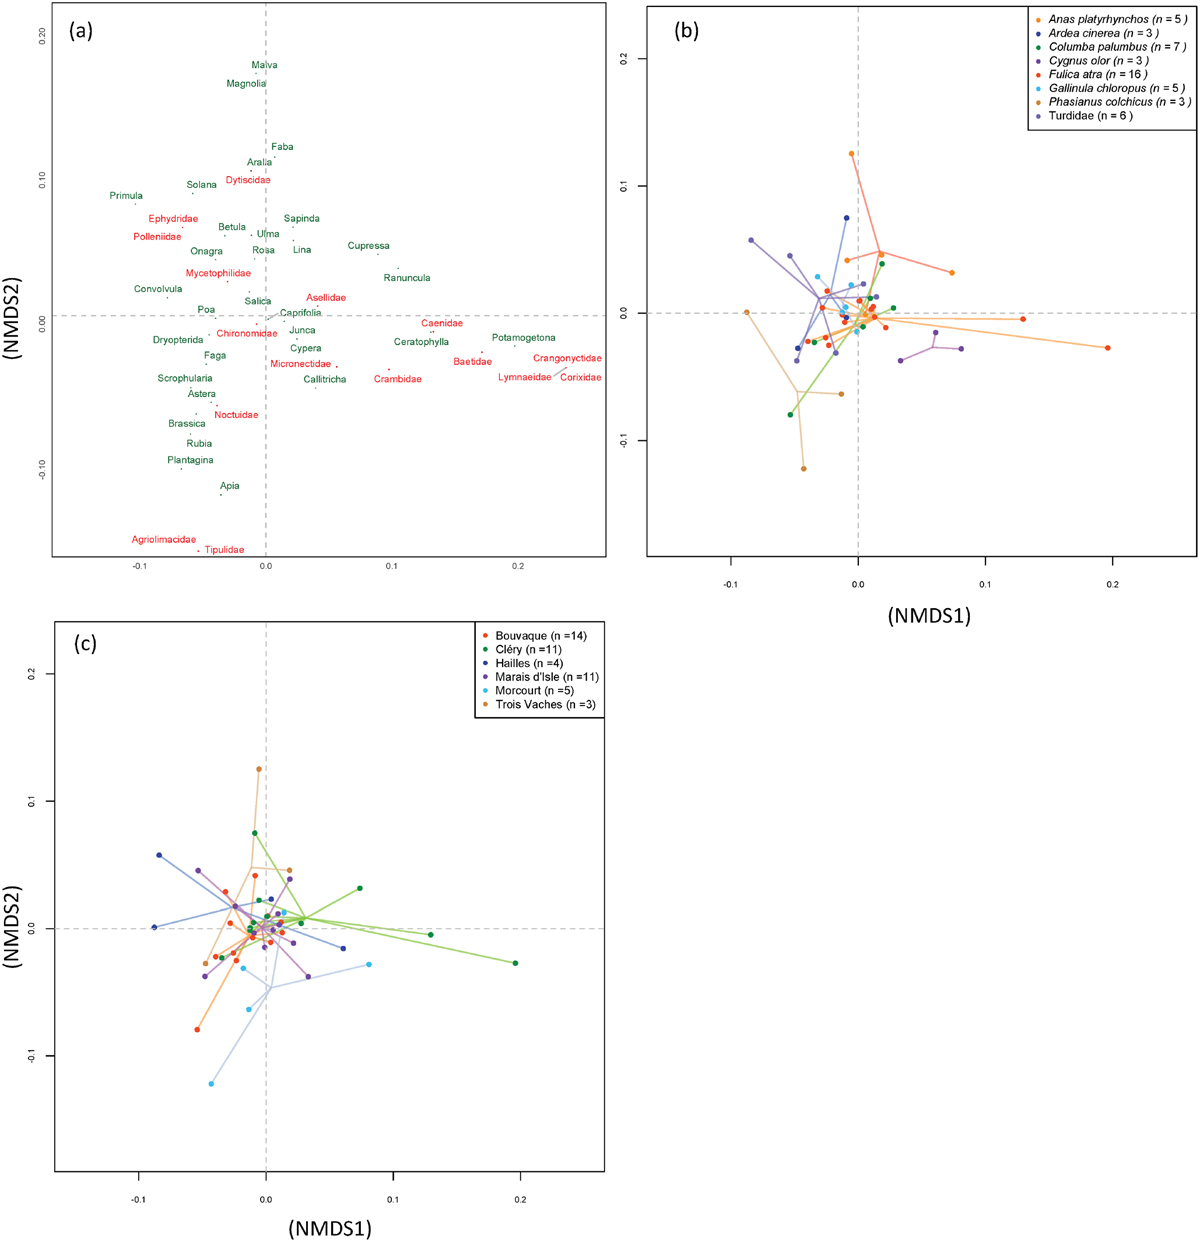
Similarity analysis of the diet composition among bird species and sampling sites through Non-metric Multidimensional Scaling (NMDS). Only species with at least three samples that provided valid data are represented. (a) Distribution plot in a two-dimensional space of the plant families (family name's ending “ceae” was removed from the graph to prevent label overlap) appearing in green, and invertebrate families appearing in red. Distribution plot of the samples by (b) species and (c) sites. The quality of the representation in space, or stress value, was 0.141. Numbers in brackets indicate the sample size.
Current usage metrics show cumulative count of Article Views (full-text article views including HTML views, PDF and ePub downloads, according to the available data) and Abstracts Views on Vision4Press platform.
Data correspond to usage on the plateform after 2015. The current usage metrics is available 48-96 hours after online publication and is updated daily on week days.
Initial download of the metrics may take a while.