Fig. 2
Download original image
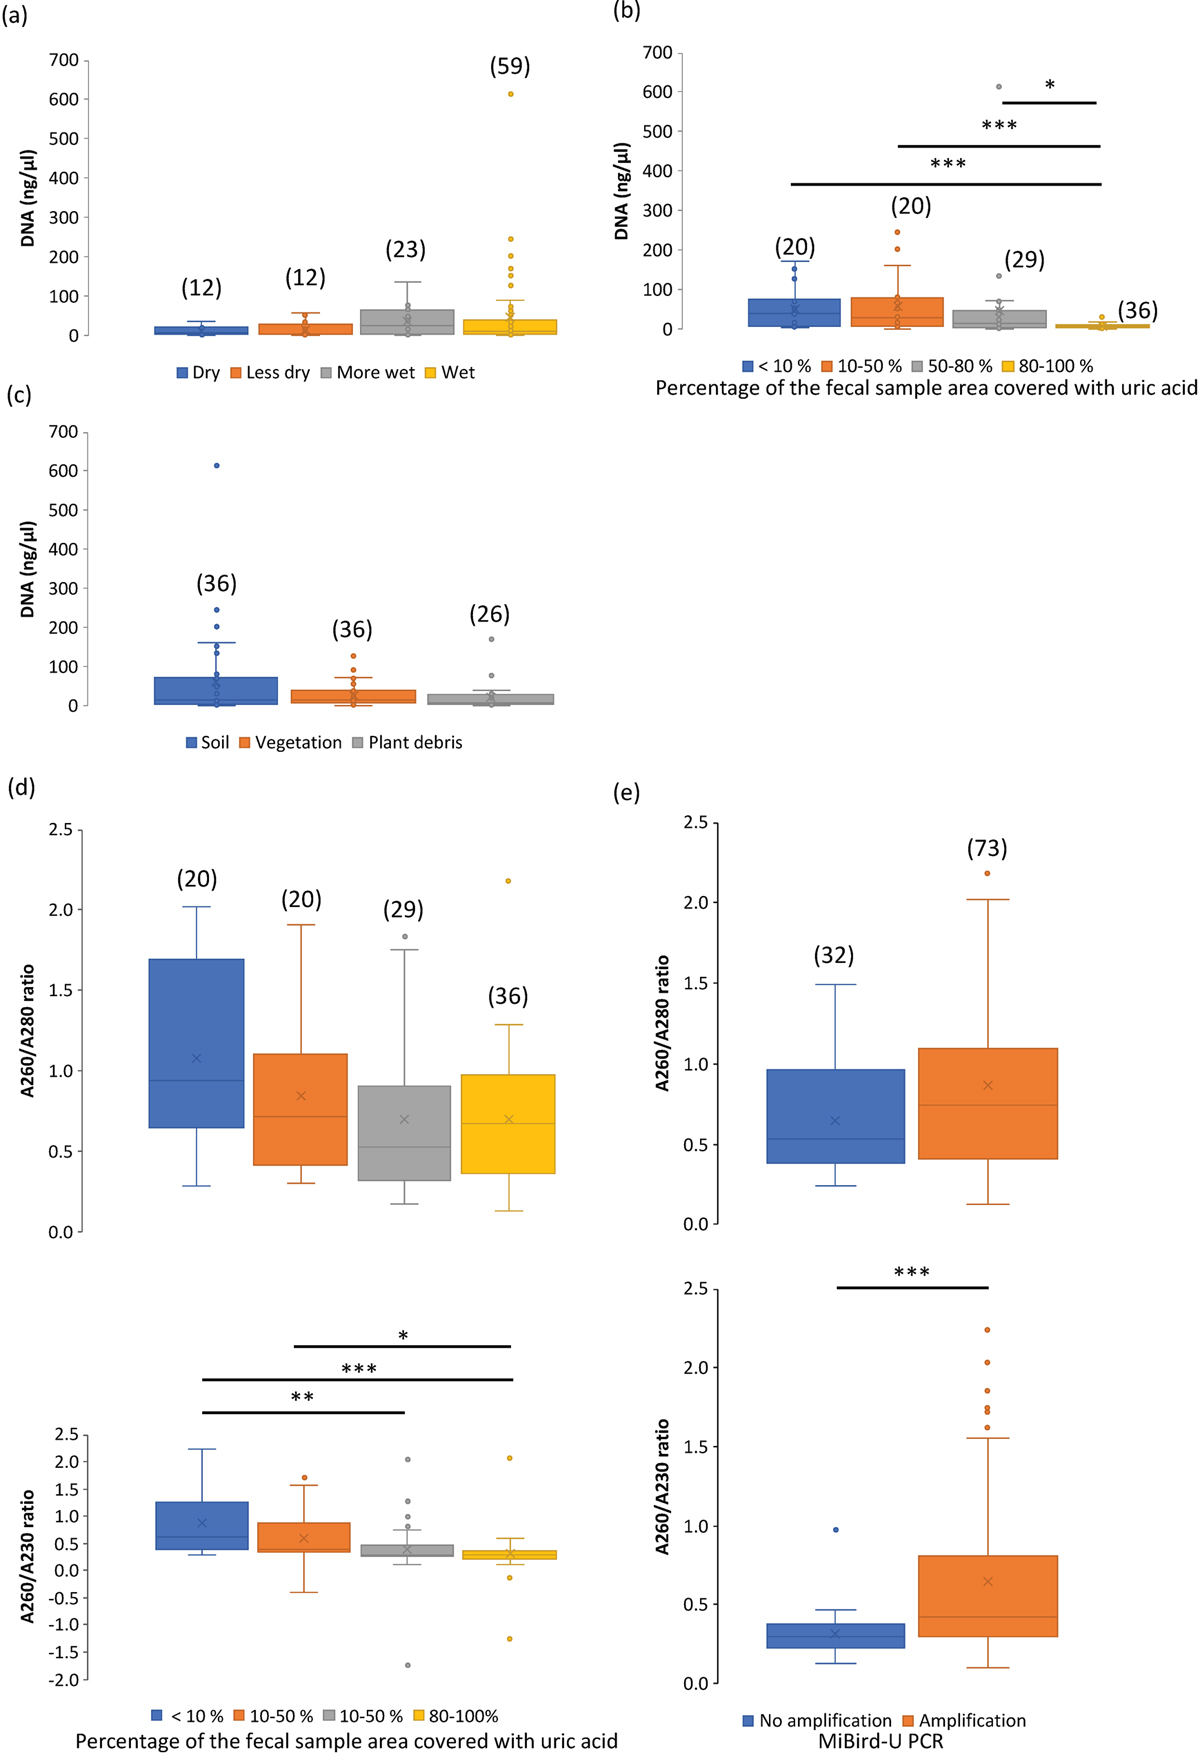
Comprehensive analysis of factors influencing DNA extraction and PCR results. Panels (a), (b) and (c) illustrate the impact of (a) sample freshness, (b) the presence of uric acid on the entire fecal surface, and (c) the dominant sampling substrate on DNA concentration, measured immediately after fecal sample extraction. The samples were categorized based on their “swollen” and “shiny appearance for fresh samples and “contracted” and “dull” for dry samples. Panel (d) depicts the relationship between DNA purity, assessed through absorbance ratios at 260 nm and 280 nm (upper panel), and 260 nm and 230 nm (lower panel), and the presence of uric acid on the fecal sample surface. Panel (e) shows the effect of DNA purity, assessed through absorbance ratios at 260 nm and 280 nm (upper panel), and 260 nm and 230 nm (lower panel) on MiBird-U PCR result. PCR products were analyzed by agarose gel electrophoresis. The numbers in brackets indicate the sample count. * p < 0.05, ** p < 0.01, *** p < 0.001, analyzed using the Wilcoxon rank-sum test.
Current usage metrics show cumulative count of Article Views (full-text article views including HTML views, PDF and ePub downloads, according to the available data) and Abstracts Views on Vision4Press platform.
Data correspond to usage on the plateform after 2015. The current usage metrics is available 48-96 hours after online publication and is updated daily on week days.
Initial download of the metrics may take a while.