Fig. 5

Download original image
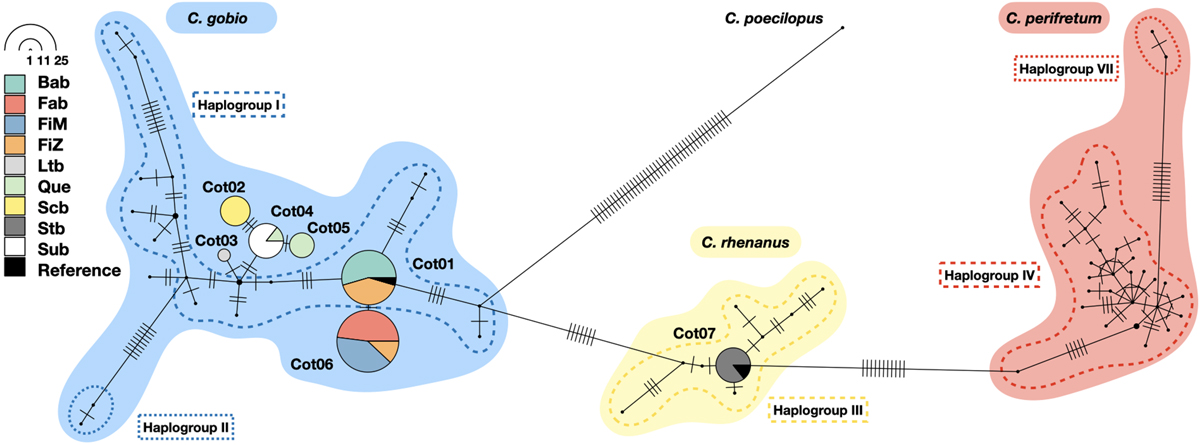
Network of sculpin (Cottus spp.) haplotypes. Pie charts represent haplotypes and their size shows the haplotype frequency. The colors of chart slices indicate the populations (cp. Tab. 1). The number of mutational steps between haplotypes is shown by the number of tick marks on connecting branches. Colored dashed and dotted lines mark the haplogroups I, II, III, IV and VII after Volckaert et al. (2002). Haplotype HTCot01, or Cot66 (Šlechtová et al., 2004), was not included in Volckaert et al. (2002), but was positioned in between group I haplotypes. Haplotype HTCot07 equals haplotype HV18 in haplogroup III. Colored background areas indicate species designations. Haplogroups I and II plus the haplotypes HTCot01 to HTCot06 from this study were considered as C. gobio. Haplogroup III, including haplotype HTCot07/HV18 was considered as C. rhenanus. Under C. perifretum we included haplogroups IV and VII.
Current usage metrics show cumulative count of Article Views (full-text article views including HTML views, PDF and ePub downloads, according to the available data) and Abstracts Views on Vision4Press platform.
Data correspond to usage on the plateform after 2015. The current usage metrics is available 48-96 hours after online publication and is updated daily on week days.
Initial download of the metrics may take a while.


