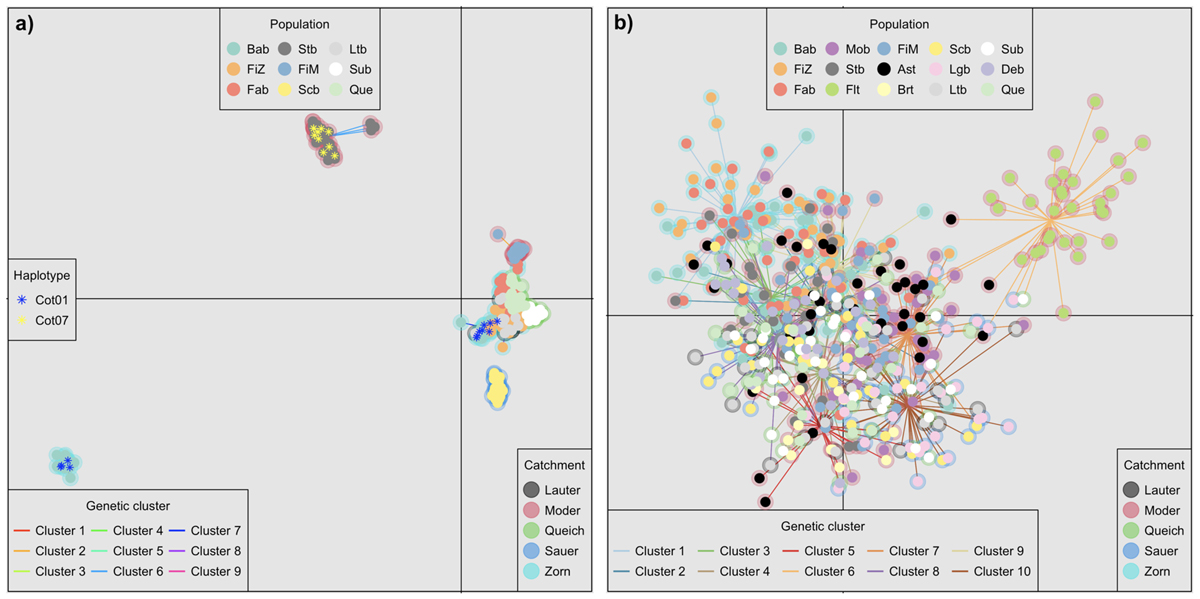
Fig. 4

Download original image
Discriminant Analyses of Principal Components (x-axis: PC 1, y-axis PC 2) of sculpin (Cottus spp., a) and brown trout (Salmo trutta, b). Lines between individuals and “group centers” show the genetic clusters. Larger/outer circles indicate the catchment and smaller/inner dots the population where the individual fish were sampled. Individual membership probabilities per cluster are shown in Fig. S4-1 and S4-2. For sculpin populations Bab and Stb additional asterisks show the mtDNA control region haplotypes. Haplotype HTCot01 was designated to C. gobio and HTCot07 to C. rhenanus (cp. Tab. S3-1).
Current usage metrics show cumulative count of Article Views (full-text article views including HTML views, PDF and ePub downloads, according to the available data) and Abstracts Views on Vision4Press platform.
Data correspond to usage on the plateform after 2015. The current usage metrics is available 48-96 hours after online publication and is updated daily on week days.
Initial download of the metrics may take a while.


