Fig. 4
Download original image
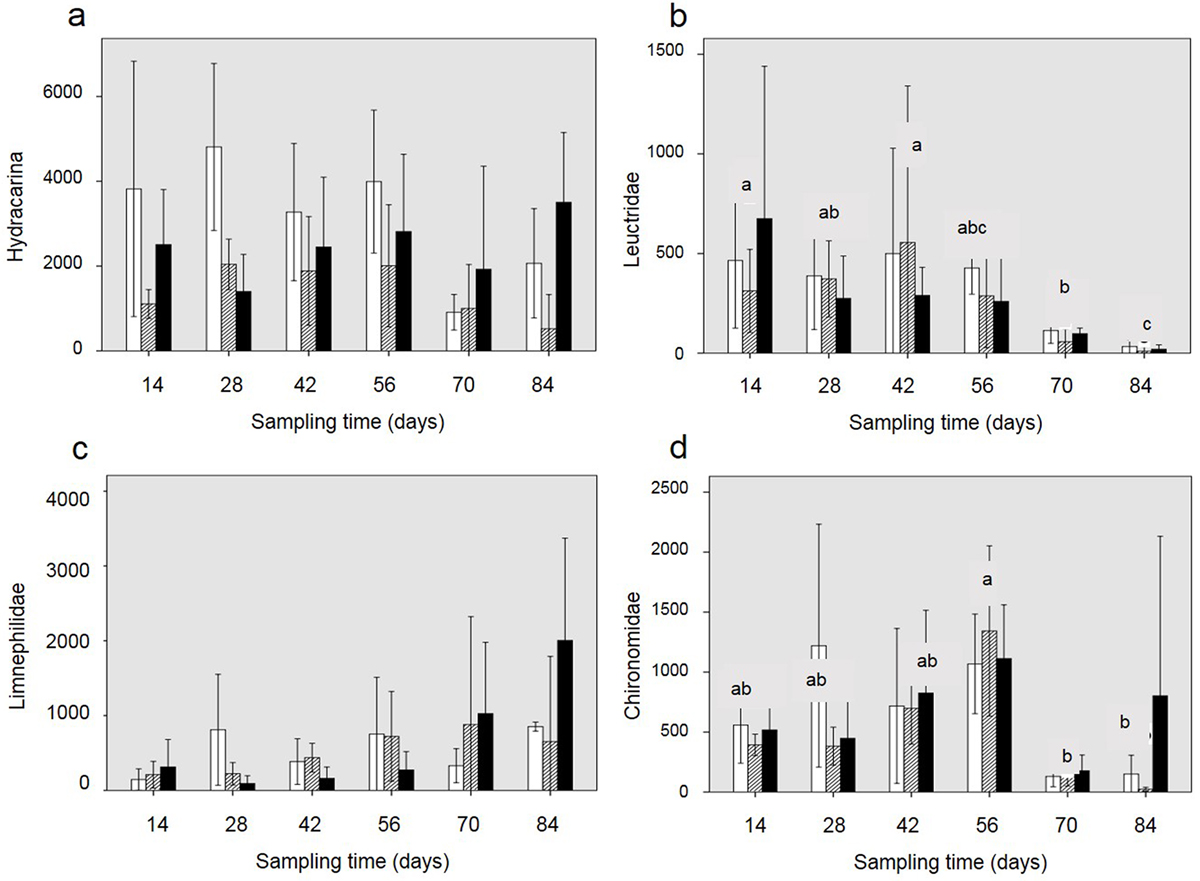
Temporal variation of abundance (ind m−2, mean ± 1 SD) of macroinvertebrates collected in the control (white), one-crayfish (grey) and two-crayfish (black) enclosures. Only graphs for taxa displaying significant effects are depicted: (a) hydracarina, (b) leuctridae, (c) limnephilidae and (d) chironomidae. Crayfish density treatments that significantly differed from each other are denoted with different lowercase letters over the bars (a, b, c), and combinations of these letters (ab, abc) indicate a lack of effects in relation to individual groups.
Current usage metrics show cumulative count of Article Views (full-text article views including HTML views, PDF and ePub downloads, according to the available data) and Abstracts Views on Vision4Press platform.
Data correspond to usage on the plateform after 2015. The current usage metrics is available 48-96 hours after online publication and is updated daily on week days.
Initial download of the metrics may take a while.