Fig. 1
Download original image
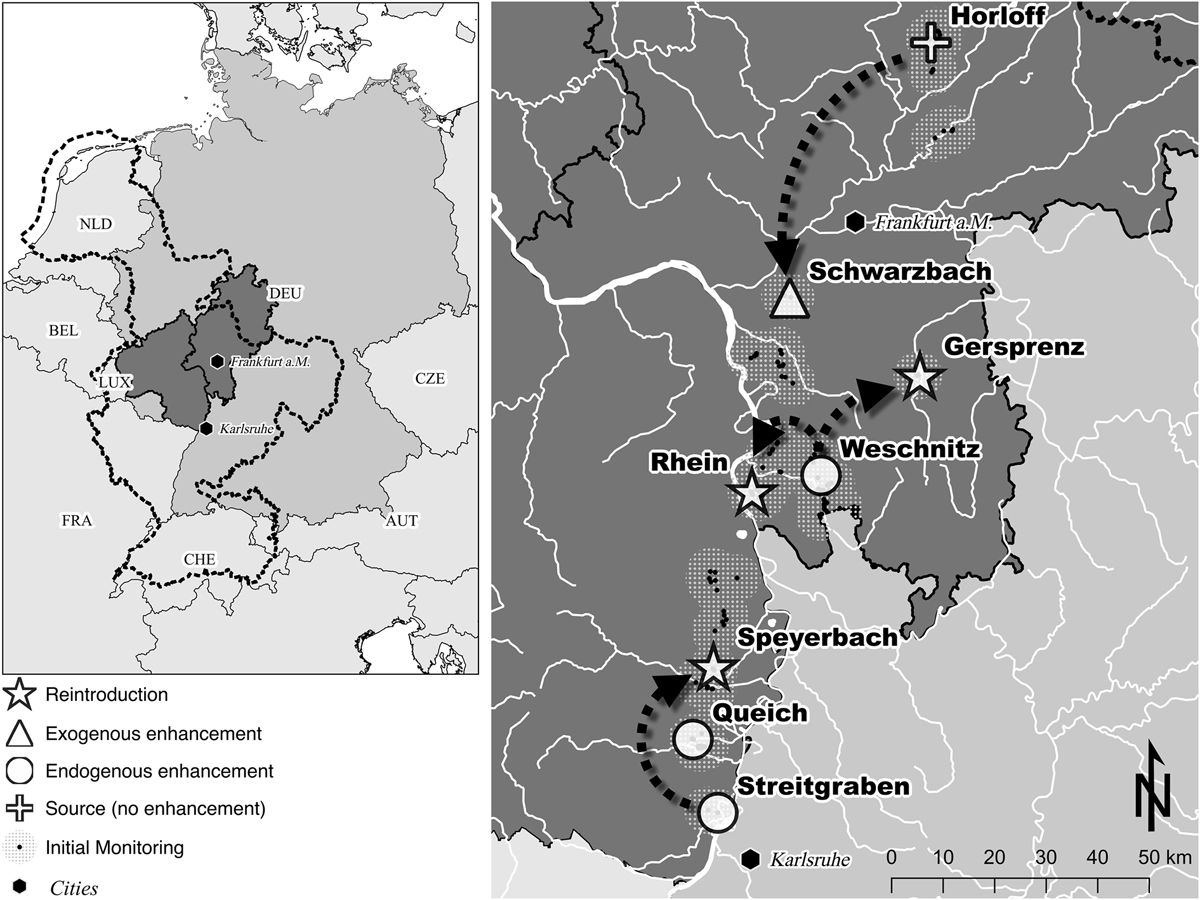
Map of the study area. Overview map on the left shows the location of the federal states of Rhineland-Palatinate and Hesse (dark grey) in Germany (grey) and Europe (light grey; GADM, 2012), including codes of the countries bordering Germany. The dotted black line indicates the international Rhine river basin district (European Environment Agency, 2011). Detailed map on the right shows the sectors investigated in the initial monitoring, catchments used for the different stocking measures (reintroduction, endogenous enhancement, exogenous enhancement) and the broodstock source used where no enhancement took place (Horloff). Black arrows indicate the broodstock origin used for reintroductions. White lines show main rivers (GADM, 2012).
Current usage metrics show cumulative count of Article Views (full-text article views including HTML views, PDF and ePub downloads, according to the available data) and Abstracts Views on Vision4Press platform.
Data correspond to usage on the plateform after 2015. The current usage metrics is available 48-96 hours after online publication and is updated daily on week days.
Initial download of the metrics may take a while.