| Issue |
Knowl. Manag. Aquat. Ecosyst.
Number 421, 2020
|
|
|---|---|---|
| Article Number | 35 | |
| Number of page(s) | 15 | |
| DOI | https://doi.org/10.1051/kmae/2020026 | |
| Published online | 21 July 2020 | |
Research Paper
Impact of anthropogenic transformations on the vegetation of selected abiotic types of rivers in two ecoregions (Southern Poland)
Impact des modifications anthropiques sur la végétation de certains types abiotiques de rivières dans deux écorégions (sud de la Pologne)
Institute of Biology, Biotechnology and Environmental Protection, Faculty of Natural Sciences, University of Silesia in Katowice, Bankowa 9, 40-007 Katowice, Poland
* Corresponding author: This email address is being protected from spambots. You need JavaScript enabled to view it.
Received:
23
March
2020
Accepted:
17
June
2020
Abstract
The quality of water in rivers is declining worldwide due to anthropogenic activities. This phenomenon may be exacerbated by climate change and population growth. We hypothesised that both physical and chemical parameters of water, which reflect the differences in the underlying geology and anthropogenic transformations, are the most important characteristics to explain the distribution of macrophytes in rivers. In the present study, we analysed the effect of anthropogenic transformation on the structure of macrophytes in eight rivers within the river basins of the Vistula and Oder Rivers (Southern Poland). A canonical correspondence analysis showed that conductivity, altitude, natural features of rivers and adjacent land use, which are indicated by the values of the Hydromorphological Diversity Index (WRH), and medium sand were the most important factors that affected the distribution of macrophytes. The eurytopic species, including invasive alien species, were negatively correlated with the WRH index and positively correlated with high conductivity. An increase in the conductivity led to a loss of vegetation diversity and caused the replacement of freshwater species with brackish or salt-resistant species. Salinity of 2.96–5.16 PSU decreased the number of macrophyte taxa by over 30% in the rivers as compared to salinity of 0.45–0.64 PSU. Because very few studies have investigated the effect of salinity on macrophytes, further research is needed to explain this phenomenon. We therefore suggest extensive use of hydromorphological indices in studies on the distribution of macrophytes in rivers.
Résumé
La qualité de l'eau des rivières diminue dans le monde entier en raison des activités anthropiques. Ce phénomène pourrait être exacerbé par le changement climatique et la croissance démographique. Nous avons émis l'hypothèse que les paramètres physiques et chimiques de l'eau, qui reflètent les différences dans la géologie sous-jacente et les transformations anthropiques, sont les caractéristiques les plus importantes pour expliquer la répartition des macrophytes dans les rivières. Dans la présente étude, nous avons analysé l'effet de la modification anthropique sur la structure des macrophytes dans huit rivières des bassins de la Vistule et de l'Oder (sud de la Pologne). Une analyse de correspondance canonique a montré que la conductivité, l'altitude, les caractéristiques naturelles des rivières et l'utilisation des terres adjacentes, qui sont indiquées par les valeurs de l'indice de diversité hydromorphologique (WRH), et le sable de taille moyenne étaient les facteurs les plus importants qui affectaient la distribution des macrophytes. Les espèces eurytopiques, y compris les espèces exotiques envahissantes, ont été négativement corrélées avec l'indice WRH et positivement corrélées avec une conductivité élevée. Une augmentation de la conductivité est liée à une perte de la diversité de la végétation et au remplacement des espèces d'eau douce par des espèces saumâtres ou résistantes au sel. Une salinité de 2,96 à 5,16 PSU a réduit le nombre de taxons de macrophytes de plus de 30 % dans les rivières par rapport à une salinité de 0,45 à 0,64 PSU. Comme très peu d'études ont porté sur l'effet de la salinité sur les macrophytes, des recherches supplémentaires sont nécessaires pour expliquer ce phénomène. Nous suggérons donc d'utiliser largement les indices hydromorphologiques dans les études sur la distribution des macrophytes dans les rivières.
Key words: Human impact / macrophytes / salinisation / hydromorphology / pollution
Mots clés : Impact humain / macrophytes / salinisation / hydromorphologie / pollution
© D. Halabowski and I. Lewin, Published by EDP Sciences 2020
 This is an Open Access article distributed under the terms of the Creative Commons Attribution License CC-BY-ND (https://creativecommons.org/licenses/by-nd/4.0/), which permits unrestricted use, distribution, and reproduction in any medium, provided the original work is properly cited. If you remix, transform, or build upon the material, you may not distribute the modified material.
1 Introduction
The quality of water in freshwater ecosystems is declining worldwide due to anthropogenic activities. This phenomenon may be exacerbated by climate change and population growth (Vörösmarty et al., 2000; Neubauer and Craft, 2009; Herbert et al., 2015). For example, organic pollution through excessive nutrient enrichment, which is associated with the development of agriculture, industries and cities, has increased primary production and eutrophication in these ecosystems. In addition, recent stressors such as de-icing the roads with salt (northern regions) and mining activity (worldwide) have affected the chloride level of freshwater ecosystems, which has exceeded the thresholds set for many flowing waters. Almost all rivers in Europe have been affected to different degrees by human activities (Schinegger et al., 2012), which has negatively impacted aquatic plant communities and consequently the ecosystem processes in these rivers (Grime, 1997; Vörösmarty et al., 2010). Therefore, it is important to conduct research on the impact of anthropogenic changes on macrophytes in flowing waters and on aquatic environment management during intensive urbanisation and progressive climate change.
Macrophytes influence the physical, chemical, geomorphological and hydrological characteristics of environments, and they play an important role in the structure and function of aquatic ecosystems by altering the regime of water movement. Aquatic plants interact with a wide range of organisms from microorganisms to vertebrates, for example, by providing a food source, habitat and refuge, and they also alter the water and sediment quality (e.g. Chambers et al., 1999; Engelhardt and Ritchie, 2001; Haslam, 2006; Chambers et al., 2008; Wood et al., 2017). Macrophytes play an important role in maintaining aquatic biodiversity and functioning of aquatic ecosystems. They reduce the concentration of phosphorus in water, thus preventing eutrophication by improving water quality (Engelhardt and Ritchie, 2001; Byers et al., 2006). Moreover, aquatic vegetation is one of the basic elements supporting the life of many organisms including humans by providing various ecosystem functions that serve life on our planet and regulate the geomorphological processes (Mucina et al., 2016). Because of their high productivity, easily dispersed propagules and broad ecological tolerance, several macrophyte species are recognised as one of the most invasive plants in the world (Pieterse and Murphy, 1993).
Many researchers consider living organisms as good indicators of the quality of aquatic ecosystems, because they reflect the current state of water even better than the measured physical and chemical parameters. Aquatic organisms reflect not only the current conditions of water but also the factors that have prevailed for a long time in the past. Macrophytes enable to assess the degree of degradation of flowing waters, primarily in terms of their trophy; they are also used to assess acidification and river degradation in a more holistic or integrative manner (Szoszkiewicz et al., 2010; Kaijser et al., 2019). Aquatic vegetation responds to changes in the levels of water, light, salinity, turbidity and toxic contaminants such as herbicides and heavy metals, and it also responds strongly to any changes in the hydromorphological parameters of rivers (Bis, 2008; Abati et al., 2016). However, very little is known about the effect of salinity on freshwater plants (Hintz and Relyea, 2019). Fluctuations in pollution level occur due to many factors such as changes in the concentration of pollutants, changes in the water flow rate in a river, the ability of rivers to self-purify, meteorological conditions and seasons. Surveys of the physical and chemical parameters of water (analytical methods for assessing water quality) enable to determine the quality and quantity of pollutants only at the time of testing, while biological surveys reflect the state of water over a longer period of time.
Macrophytes are constantly subjected to environmental pressure. Therefore, the average level of contamination throughout the growing season can be assessed on the basis of their sensitivity to the pollution of water (Szoszkiewicz et al., 2010). This implies that their occurrence reflects the effects of human pressure over an extended period of time (from months to even years). Aquatic plants are good indicators for monitoring any long-term changes (late warning indicators) in freshwater ecosystems (Aguiar et al., 2014). Therefore, they are used in the biological monitoring of the quality of the European aquatic environment in accordance with the guidelines of the European Union Water Framework Directive (EU WFD) (Directive, 2000). However, there is a gap in the knowledge on the hydromorphological fluctuations that affect the structural and functional responses of the individual macrophytes and plant communities in different abiotic types of rivers.
The novelty of the present survey is related to the environmental factors that influence the structure of macrophytes in rivers including the Bolina, which is currently the most salinised river in the world among the human-impacted rivers due to the discharge of underground coal mine water. For the first time, two numerical metrics, namely the Hydromorphological Diversity Index (WRH), which reflects several natural characteristics of rivers and the adjacent land use, and the Hydromorphological Transformation Index (WPH), are applied to assess the degree of human pressure in a catchment area in secondary salinised rivers with the discharge of underground coal mine water.
The objectives of our survey were to analyse the structure of macrophytes in human-impacted rivers including the secondary salinised rivers subjected to the pressure of the discharge of salty coal mine water to determine the most predictive environmental factors affecting the structure of vegetation and to assess the river habitats under different degrees of anthropogenic impact, including the bank and channel features, any modifications, land use and channel vegetation.
We hypothesised that both physical and chemical parameters of water, which reflect the differences in underlying geology and anthropogenic transformations, would be more predictive than the hydromorphological transformations in explaining the distribution of macrophytes in the surveyed rivers. We also present additional arguments for using aquatic plants to monitor the quality of flowing waters.
2 Materials and methods
2.1 Selection of the rivers and sampling sites
The survey was carried out in eight rivers within the river basins of the Vistula and Oder Rivers in southern Poland from spring to autumn 2017. Four abiotic types of rivers in terms of different degrees of anthropogenic transformations were selected on the basis of System A and B (Directive, 2000) (Fig. 1 and Supplementary Table S1):
-
abiotic type 5: mid-altitude siliceous streams with a fine particulate substratum, Central Plains, Ecoregion 14 (the Bolina and Centuria rivers);
-
abiotic type 6: mid-altitude calcareous streams with a fine particulate substratum on loess, Central Plains, Ecoregion 14 (the Mitręga and Mleczna rivers);
-
abiotic type 12: flysch streams, Carpathians, Ecoregion 10 (the Dziechcinka and Vistula rivers);
-
abiotic type 17: lowland sandy streams, Central Plains, Ecoregion 14 (the Korzenica and Wiercica rivers).
The selected rivers flow through one of the most urbanised and industrialised regions in Europe, i.e. Upper Silesia, as well as through the less human-impacted adjacent areas. The rivers that flow through the areas adjacent to Upper Silesia are subjected to the pressure of organic pollution mainly from agriculture, animal grazing, dam reservoirs or fishponds (the lower courses of the Wiercica and Centuria rivers). The mouth of the Korzenica River and the sources and the upper courses of the Centuria, Wiercica and Vistula rivers are located within the protected areas of Natura 2000 and other nature reserves. In contrast, the rivers that flow through Upper Silesia are subjected to strong and different types of human pressure, namely salty coal mine water (the Bolina and Mleczna rivers); communal sewage inflow (the Bolina, Mleczna and Mitręga rivers); and organic pollution that originates from agriculture, dam reservoirs, fishponds and animal grazing (the Korzenica, Mitręga and Mleczna rivers). In addition, the Bolina and Mleczna rivers and the lower courses of the Vistula and Dziechcinka rivers are regulated and heavily canalised, and their riverbeds are reinforced with concrete.
The sampling sites were selected in the lower and upper courses of all the studied rivers. The degree of human pressure for each sampling site was determined in preliminary surveys (site visits) in 2016, references (e.g. Lewin et al., 2018) and the reports on the ecological status of the rivers obtained from the Voivodeship Inspectorates of Environmental Protection, Katowice and Cracow, Poland as follows:
-
no impact (the Centuria and Vistula rivers − upper courses),
-
very small (the Wiercica River − upper course),
-
low (the Centuria and Korzenica rivers − lower courses),
-
small (the Mitręga River − lower course; the Dziechcinka River − upper course),
-
medium (the Mitręga River - upper course; the Wiercica River - lower course),
-
high (the Mleczna and Korzenica rivers − upper courses),
-
very high (the Bolina River − upper course; the Mleczna, Dziechcinka and Vistula rivers − lower courses),
-
extreme (the Bolina River − lower course).
 |
Fig. 1 Location of the study area and the sampling sites. |
2.2 Environmental surveys
The macrophytes were surveyed four times per year (once in spring, twice in summer and once in autumn). Only the aquatic plants growing in water or at least rooted in water were recorded. The plant species growing in 25 m2 patches of each vegetation were listed. These floristic lists were obtained three times at each sampling site during each survey four times per year. The macrophytes were identified to the species or genus level and the macroalgae to the genus level. The nomenclature of the vascular plants followed Mirek et al. (2002), while that of the mosses and liverworts followed Ochyra et al. (2003) and Klama (2006), respectively. A total of 192 phytosociological relevés were obtained using a modified 13-point Braun-Blanquet scale method. The percentage coverage of each macrophyte was estimated on a 1%, 2%, 5%, 10%, 20%, 30%, 40%, 50%, 60%, 70%, 80%, 90% or 100% scale on each vegetation patch (Chmura, 2014). The contribution of various growth forms of plants was analysed using six categories: macroalgae, aquatic bryophytes, vascular submerged plants (elodeids), vascular submerged plants with floating leaves (nymphaeids), vascular free-floating plants (pleustophytes) and vascular emergent plants (helophytes). The types of communities were determined for all the floristic lists based on the dominant forms of plant growth.
Water samples for analysing the physical and chemical properties were collected simultaneously while surveying the macrophytes. The electrical conductivity (EC), total dissolved solids (TDS), temperature, pH and dissolved oxygen were measured in the field using portable meters from Hanna Instruments and Elmetron. Salinity was measured using a Multi WTW and converted according to Piscart et al. (2005). Alkalinity, total hardness and the concentrations of calcium, magnesium, nutrients, iron, sulphates and chlorides were analysed in the laboratory according to the standard methods of Hermanowicz et al. (1999). The depth, width and flow velocity of the rivers were measured in the field according to Hauer and Lamberti (2007). The grain size composition of the bottom sediments was determined using both the sieve and aerometric methods. The analyses of the physical and chemical parameters of the water and bottom sediments were carried out four times for each sampling site. The depth of the watercourses was measured for each phytosociological relevé.
The hydromorphological survey was conducted based on the Hydromorphological Index for Rivers (HIR) method according to Szoszkiewicz et al. (2017a,b). HIR is used in hydromorphological studies of all fluvial habitats, including great lowland rivers, mountain streams and human-impacted urban rivers. The HIR method meets the requirements of the EU Water Framework Directive in terms of the assessment of the hydromorphological status of rivers. The HIR method is based on a field survey that requires the collection of several variables that describe the various hydromorphological characteristics of the studied river section. The field studies in the HIR method are supplemented by the analysis of Geographic Information Systems data and remote sensing materials. This enables a more complete characterisation of the studied river by assessing river continuity and profile, river gradient, land use, hydroengineering structures, hydrological regime, type and size of basin and river valley use. By using the HIR method, two numerical metrics are calculated, namely the Hydromorphological Diversity Index (WRH) and the Hydromorphological Transformation Index (WPH) (Szoszkiewicz et al., 2017a,b). The WRH index enables to assess the diversity of natural morphological features of the river and its valley by surveying three zones of the river (river channel, bank-top and river valley). The WRH index is calculated using qualitative and quantitative data on:
-
the river channel zone (variation in the river line and bed slope, heterogeneity of water flow and bottom sediment, natural morphological features of bottom and elements of banks, diversity of vegetation types in the river channel and the structure of bank vegetation);
-
the bank-top zone (the structure of riparian vegetation and the width of unmanaged riparian zone); and
-
the river valley zone (heterogeneity and natural land use, connectivity between the river and the valley).
The WPH index enables to assess the total degree of anthropogenic modification of both the river and its valley and the adjacent area including the presence and abundance of engineering structures, transformations of the channel profile and river enforcements. The WPH index is calculated using qualitative and quantitative data on:
-
transformation of the transverse section of the river channel;
-
hydroengineering structures; and
-
disturbances in connectivity between the river and the valley.
High values of the WPH index indicate strong human pressure on a river and the adjacent land use, while high values of the HIR and WRH indices indicate a large number of natural features of rivers and the adjacent land use (Szoszkiewicz et al., 2017a,b).
2.3 Numerical and statistical analyses
The significance of differences among the sampling sites in the rivers in terms of (1) median values of the environmental variables, (2) number of macrophyte taxa and (3) median values of various growth forms of plants was determined with the Kruskal–Wallis and Dunn's multiple comparison post hoc tests using Statistica version 13.1. If the values of the environmental variables show a normal distribution according to the test of normality, parametric tests should be used and the mean values should be considered (Fovler et al., 1998). However, in the case of non-normal distribution of these values, non-parametric tests should be used and the median values should be considered. In our survey, the values of the environmental variables showed non-normal distribution according to the Lilliefors test of normality, which justified the use of a non-parametric test. Therefore, the median values were considered for analysis instead of the mean values.
TWINSPAN (two-way analysis of indicator species), a standard method for classifying the plant communities, was performed using WinTWINS and JUICE 7.0 software to determine their correspondence to the references (Matuszkiewicz, 2008; Ratyńska et al., 2010) for Poland. The syntaxonomic status of the species was adopted following Matuszkiewicz (2008) and Ratyńska et al. (2010). The relationship between the taxonomic composition of the macrophytes and the environmental variables was evaluated using CANOCO for Windows version 4.5 (Ter Braak and Šmilauer, 2002). By using the biological data, a detrended correspondence analysis (DCA) was performed, and the length of the gradient was assessed to select the appropriate types of ordination methods. The maximum gradient length exceeded 4 SD (standard deviation), and therefore, a unimodal direct ordination method, namely canonical correspondence analysis (CCA) with forward selection, was used to reduce the large set of environmental variables. The macrophyte taxa that occurred at fewer than 10% of the sampling sites were excluded from the statistical analyses following a preliminary exploration of their influence in the initial DCA analysis (McCune and Grace, 2002). Both the biological and environmental data were log-transformed. The statistical significance of the relationship between the biological data and the environmental variables was evaluated using the Monte Carlo permutation test (499 permutations) (Ter Braak and Šmilauer, 2002).
3 Results
3.1 Differentiation of the habitat conditions
The flysch streams at a high altitude were characterised by a high gradient and extremely low values of the parameters related to salinity and total hardness as well as a low concentration of nutrients compared to those of the other types of rivers (Tabs. 1 and 2). The highest values of total hardness; concentration of nutrients and sulphates; and parameters related to salinity, including an extremely high conductivity of up to 46 600 µS cm‑1 and 7160 µS cm‑1, were recorded in the Bolina and Mleczna rivers, respectively. The lowest temperature was recorded in the Centuria River, which along with the flysch streams, showed the highest flow velocity. Conversely, the highest temperature and the lowest flow velocity were recorded for the Bolina, Mleczna and Korzenica rivers. The mid-altitude calcareous streams with a fine particulate substratum on loess (the Mleczna and Mitręga rivers) showed relatively low concentrations of dissolved oxygen in water. The highest concentration of iron was recorded in the Korzenica River (Tab. 2).
The highest values of the HIR index were obtained for the least human-impacted sections of the rivers (the Centuria and Wiercica rivers, the lower course of the Korzenica River and the upper courses of the Dziechcinka and Vistula rivers). The lowest values of the HIR index were obtained for the most human-modified sections of rivers (the Bolina and Mleczna rivers, the upper course of the Korzenica River and the lower courses of the Dziechcinka, Vistula and Mitręga rivers) (Tab. 2). The WRH index showed high values for the Centuria and Wiercica rivers and for the upper courses of the Dziechcinka and Vistula rivers. Moreover, the WPH index showed high values for the Bolina, Mleczna and Mitręga rivers and for the lower courses of the Dziechcinka and Vistula rivers (Tab. 2).
The Kruskal–Wallis and Dunn's multiple comparison post hoc tests revealed significant differences between the studied rivers in the median values of salinity; conductivity; TDS; concentrations of chlorides, sulphates, iron, ammonium, nitrites, phosphates, calcium and magnesium; alkalinity; total hardness; temperature; flow velocity; width and depth of the river bed; and all the fractions of the bottom sediments (Tabs. 1 and 2).
The physical and chemical parameters of the water of the studied rivers (ranges) and the results of the Kruskal–Wallis and Dunn's multiple comparison post hoc tests (superscripts a,b,c,d,e,f,g,h above a whisker denote significant differences between the rivers). Abbreviations: a − the Bolina River, b − the Centuria River, c − the Mitręga River, d − the Mleczna River, e − the Dziechcinka River, f − the Vistula River, g − the Korzenica River, h − the Wiercica River.
Spatial variables, the morphology of the riverbed, the values of the hydromorphological indices, the characteristics of the bottom sediments and the results of the Kruskal–Wallis and Dunn's multiple comparison post hoc tests (superscripts a,b,c,d,e,f,g,h denote significant differences between the rivers). Abbreviations: see Table 1.
3.2 Differentiation of vegetation among the rivers
A total of 76 macrophyte taxa were recorded in the investigated rivers: 10 macroalgae taxa, 19 bryophyte taxa (4 liverwort taxa and 15 moss species) and 47 taxa of vascular plants (15 elodeids, 2 nymphaeids, 2 pleustophytes and 28 helophytes). Among them, two invasive alien species were recorded, namely Impatiens glandulifera in the upper course of the Dziechcinka River and Elodea canadensis in the lower courses of the Centuria, Mleczna, Vistula and Wiercica rivers and in the Mitręga and Korzenica rivers. In addition, several rare and legally protected macrophyte species were also found, namely Cochlearia polonica (the Centuria River − upper course), Ranunculus fluitans (the Wiercica River − lower course) and the bryophyte species Thamnobryum alopecurum (the Wiercica River − upper course) (Regulation, 2014).
The number of macrophyte taxa ranged from 1 (the Bolina River) to 12 (the Centuria and Wiercica Rivers). The rivers contaminated with salty mine water (the Bolina and Mleczna rivers) showed the lowest median number of macrophyte taxa. The Kruskal–Wallis and Dunn's multiple comparison post hoc tests revealed significant differences in the median number of taxa between the rivers (Fig. 2). Macroalgae were found in all the rivers. The percentage coverage of macroalgae was as much as 30–40% of the surfaces in the most human-impacted sections of the rivers (the Bolina, Mleczna and Mitręga rivers) (Fig. 3a). Bryophytes dominated mainly in the flysch streams (the Dziechcinka and Vistula rivers) (Fig. 3b). The percentage coverage of elodeids was more than 80% in the mid-altitude calcareous streams with a fine particulate substratum on loess (the Mitręga and Mleczna rivers) (Fig. 3c). The highest percentage coverage of nymphaeids and pleustophytes was recorded for the lowland sandy streams (the Korzenica and Wiercica rivers) (Fig. 3d and e). In contrast, pleustophytes were not found in the flysch streams and the Bolina River.
Fifteen communities were recorded from all the rivers, and the number of plant communities ranged from one to three in some rivers (Tab. 3). A total of 192 floristic lists were grouped into four types of plant communities according to the dominant forms of plant growth: bryophyte-dominated communities (28 floristic lists), elodeid-dominated communities (72 floristic lists), helophyte-dominated communities (76 floristic lists) and macroalgae-dominated communities (16 floristic lists).
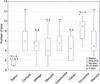 |
Fig. 2 Box-and-whisker plot showing the number of macrophyte taxa. *An asterisk above a whisker denotes significant differences between the rivers. Abbreviations: a − the Bolina River, b − the Centuria River, c − the Mitręga River, d − the Mleczna River, e − the Dziechcinka River, f − the Vistula River, g − the Korzenica River, h − the Wiercica River. |
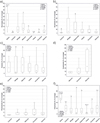 |
Fig. 3 Box-and-whisker plot showing (a) the percentage of macroalgae coverage, (b) the percentage of bryophyte coverage, (c) the percentage of elodeid coverage, (d) the percentage of nymphaeid coverage, (e) the percentage of pleustophyte coverage and (f) the percentage of helophyte coverage in the studied rivers. *An asterisk above a whisker denotes significant differences between the rivers. Abbreviations: see Figure 2. |
Plant communities in the studied rivers. Abbreviations: BOL − the Bolina River, CEN − the Centuria River, MIT − the Mitręga River, MLE − the Mleczna River, DZI − the Dziechcinka River, VIS − the Vistula River, KOR − the Korzenica River, WIE − the Wiercica River.
3.3 Diversity of vegetation in relation to the habitat conditions
A CCA based on the macrophyte data and environmental variables showed that the first two axes explained 18.4% of the variance in the biological data and 70.2% of the variance in the biological data and environment relationships. Conductivity, altitude, values of the WRH index and a particle fraction of 0.5–0.25 mm (medium sand) of the bottom sediments were predominantly associated (statistically significant according to the forward selection results) with the distribution of macrophytes (Fig. 4) and the types of plant communities (Fig. 5). The distribution of the red algae Lemanea sp.; mosses, for example, Hygrohypnum luridum, Sciuro-hypnum plumosum, Scapania undulata, Plagiomnium affine, Brachythecium rivulare, Platyhypnidium riparioides and Thamnobryum alopecurum; and the liverwort Chiloscyphus polyanthos or dicotyledonous Berula erecta was positively correlated with the altitude and natural features of the rivers as indicated by the values of the WRH index (Fig. 4). The distribution of most of the mono- and dicotyledons, for example, Callitriche sp., Sagittaria sagittifolia, Nuphar lutea, Sparganium emersum, S. erectum, Potamogeton natans and Veronica anagalis-aquatica, was correlated with lower altitude and substrate particles of 0.5–0.25 mm (medium sand). Some taxa, namely the algae Enteromorpha sp., the reed Phragmites australis and the fennel pondweed Potamogeton pectinatus, were associated with higher conductivity (Fig. 4). The occurrence of the types of plant communities was directly related to the distribution of the dominant plant species for each floristic list (Fig. 5). A significant relationship was observed between the taxonomic composition of the macrophytes and the environmental variables (Monte Carlo test of significance of the first canonical axis: P = 0.002, F-ratio = 21.108; test of significance of all of the canonical axes: P = 0.002, F-ratio = 16.640).
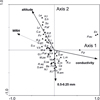 |
Fig. 4 Ordination diagram (biplot) based on the canonical correspondence analysis (CCA) of the macrophyte taxa and selected environmental variables. Abbreviations: B.e − Berula erecta, B.r − Brachythecium rivulare, Ba − Batrachyspermum sp., C.p − Chiloscyphus polyanthos, C.pn − Carex paniculata, C.r − C. rostrata, Ca − Callitriche sp., E.c − Elodea canadensis, En − Enteromorpha sp., F.a − Fontinalis antipyretica, G.f − Glyceria fluitans, G.m − G. maxima, H.l − Hygrohypnum luridum, L.m − Lemna minor, L.r −Leptodictyum riparium, Le − Lemanea sp., Ly − Lyngbya sp., M.a − Marchantia polymorpha, M. pa − Myosotis palustris, N.l − Nuphar lutea, P.af − Plagiomnium affine, P.ar − Phalaris arundinacea, P.au − Phragmites australis, P.c − Potamogeton crispus, P.n − P. natans, P.p − P. pectinatus, P.r − Platyhypnidium riparioides, R.am − Rorippa amphibia, R.aq − Ranunculus aquatilis, R.f − R. fluitans, R.s − R. sclerantus, R.fl − Riccia fluitans, R.p − Rhizonium punctatum, S.em − Sparganium emersum, S.er − S. erectum, S.h − Sciuro-hypnum plumosum, S.s − Scirpus sylvaticus, S.sa − Sagittaria sagittifolia, S.u − Scrophularia umbrosa, Su − Scapania undulata, T.a − Thamnobryum alopecurum, Ul − Ulothrix sp., V.a − Veronica anagalis-aquatica, V.b − V. beccabunga, Va − Vaucheria sp. |
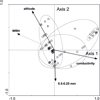 |
Fig. 5 Ordination diagram (biplot) based on the canonical correspondence analysis (CCA) of the types of plant communities and selected environmental variables. Abbreviations: B − bryophyte-dominated communities, E − elodeid-dominated communities, H − helophyte-dominated communities, M − macroalgae-dominated communities. |
4 Discussion
In the present study, the CCA showed that conductivity and the parameters related to salinity of water significantly impacted the distribution of macrophytes in the rivers. In winter in the northern regions, salt pollution of rivers is caused by de-icing of roads; however, this problem may also occur in summer (Kelly et al., 2008; Todd and Kaltenecker, 2012). In contrast, the drainage of underground hard coal mines followed by the discharge of salty mine water into settling ponds or directly into rivers is a serious problem of secondary salinisation, which occurs throughout the year. The Bolina River, currently the most salinised in the world among the rivers impacted by the discharge of hard coal mine water, is one example of such watercourses. The extraction of hard coal from mines has decreased due to depletion of hard coal deposits or the lack of profitability as well as due to climate change. Unfortunately, for many reasons, it is necessary to further drain the salt mine water to the surface despite the cessation of coal extraction (Strozik, 2017; Halabowski et al., 2019). It is expected that coal mining will increase once again because the demand for electricity is still growing (Cañedo-Argüelles et al., 2013). This human activity leads to a high salinisation of river habitats such as the Bolina River at levels even up to 33.55 PSU, which is much higher than that in the Baltic Sea and is similar to that in the North Sea. The salinisation of inland water by the discharge of coal mine water is a global phenomenon, which is comparable to heavy pollution of some rivers with salt and naturally saline rivers in warm regions, excluding the coastal zone (e.g. Arle and Wagner, 2013; Szöcs et al., 2014; Ladrera et al., 2017; Lewin et al., 2018; Zhao et al., 2018, Halabowski et al., 2020). Increased salinity has a negative impact on the abiotic and biotic characteristics of freshwater ecosystems (Williams, 2001; Herbert et al., 2015). The chronic salinity of inland water leads to the loss of biodiversity and the replacement of freshwater species with brackish or salt-resistant species (Hart et al., 1991; van den Brink and van der Velde, 1993; James et al., 2003; Nielsen et al., 2003; Halabowski et al., 2018; Sowa et al., 2019). In the Bolina River, we recorded only two plant communities, namely Phragmitetum australis, one of the most widespread in the world, and the algae community Enteromorphetum compresae, which is often reported as a community associated with the contaminated coastal regions of the Baltic Sea (see Ratyńska et al., 2010). This result is justified because salinity interferes with the uptake of water and essential ions by macrophytes and causes direct toxic effects resulting from the accumulation of ions in the cells, which consequently leads to their death. The mechanisms of the exclusion or secretion of excess ions from the cells are metabolically expensive, and therefore, ionic stress occurs. This phenomenon decreases flowering, growth, biomass, reproduction, leaf size and the ability to compete and contributes to the development of diseases, eventually leading to a change in the composition of plant communities towards species with greater salinity tolerance (James and Hart, 1993; Kozlowski, 1997; Munns and Tester, 2008; Herbert et al., 2015). The changes in plant communities caused by an increase in salinity affect the biogeochemistry of the bottom sediments primarily by altering the production of organic matter, the composition and activity of other organisms, and consequently, in the regeneration and availability of nutrients (Reddy and DeLaune, 2008; Herbert et al., 2015). For example, Hopfensperger et al. (2014) showed that a salinity of 2–7 PSU, which was observed during the growth season, did not significantly affect the vegetation in North Carolina (USA). Our results showed that water salinity of 2.96–5.16 PSU in the lower course of the Mleczna River, which was recorded during the growth season, decreased the number of macrophyte taxa by over 30% as compared to salinity of 0.45–0.64 PSU in the upper course of the Mleczna River. Increased sedimentation in rivers under the influence of saline mine water causes the formation of unstable sediments of coal dust, which further decreases macrophyte diversity. Only the most tolerant species, namely Potamogeton pectinatus and Phragmites australis, can take root and stabilise in this sediment (Haslam, 2006). In contrast, other freshwater aquatic plants have reduced root development in water with salt concentration of 1000 mg dm‑3 (Nielsen et al., 2003). Eurytopic species, including the invasive alien species Elodea canadensis, were present among the identified aquatic plants in the lower course of the Mleczna River. However, it is likely that the turbidity of water observed in the Mleczna River and the dominance of P. pectinatus could have caused the low percentage coverage of this invasive alien species (Haslam, 2006). This result showed that the salt concentration ranged from 2050 to 3570 mg dm‑3 TDS in the lower course of the Mleczna River throughout the entire sampling period. According to Zimmermann-Timm (2007), a salt concentration of 100 mg dm‑3 adversely affects the photosynthesis of E. canadensis. A 10-fold higher salt concentration limits its growth, while a concentration of 3000 mg dm‑3 reduces biomass production to approximately 50% and the ability to regenerate and colonise. However, these salt concentrations do not completely eliminate E. canadensis (Thouvenot et al., 2015; Thouvenot and Thiébaut, 2018). Increased salinity in water may promote the growth of non-native species that prefer clonal reproduction, thus giving them an advantage over native species, which leads to the persistence and expansion of alien species (e.g. Rahel and Olden, 2008; Robinson et al., 2012; Thouvenot et al., 2012). We recorded the maximum limit of chloride concentration that P. pectinatus can tolerate in the Mleczna River. Although we noted the optimal conditions for the chloride concentration range that P. pectinatus can tolerate in the Mleczna River, its unstable saltwater supply can quickly change these concentrations to unfavourable ones (Kaijser et al., 2019). According to Teeter (1965), at a chloride concentration of 1800 mg dm‑3 (similar values were recorded in the lower course of the Mleczna River), P. pectinatus begins to form tubers as a response to stress, and at 5500 mg dm‑3, the growth of this species is inhibited, while the species completely dies at a chloride concentration of 9000 mg dm‑3. According to McKee and Mendelssohn (1989), if the salinity increases, even the depleted flora of the lower course of the Mleczna River may disappear. Our results thus proved that long-term salinity affects this river because in Australia, long-term salinity of 0.6–0.9 g cm‑3 TDS caused the loss of 30% to 50% of the macrophyte species (Brock et al., 2005).
Similar to other large rivers such as the Darling, Murray and Murrumbidgee rivers in the Murray-Darling Basin of eastern Australia (Pittock and Connell, 2010), strongly transformed rivers (particularly those subjected to strong salinity) in the northern regions of Poland, such as the Bolina and Mleczna rivers, can provide a model for future surveys of these regions in terms of water scarcity, environmental degradation and climate change. In addition, research on macrophytes in strongly anthropogenically saline rivers and in rivers with little or no impact of human activity is important for assessing their salinity tolerance range. This is especially important for correctly assessing the ecological quality of flowing waters in terms of salinity (Kaijser et al., 2019).
The human impact that results from changes in the flow regime via hydromorphological transformations such as river regulation or the construction of dams and hydrotechnical installations is easily reflected in the diversity of river vegetation (Janauer and Dokulil, 2006). Our results showed that the response of macrophytes to habitat quality, which is expressed by the WRH index, was strong and that the degree of natural features in a riverbed was one of the most important factors that influenced the occurrence of aquatic plants in the studied rivers. Unfortunately, most studies have not assessed the impact of the hydromorphological quality on the occurrence of macrophytes in rivers, although some studies have revealed its significance (e.g. Baattrup-Pedersen and Riis, 1999; Hering et al., 2006; Szoszkiewicz et al., 2014; Gebler et al., 2018; Manolaki et al., 2020). However, most of these studies do not provide detailed description of the responses of individual macrophytes or aquatic plant communities to hydromorphological transformations, which are expressed by the hydromorphological indices. An exception was the research conducted by Manolaki et al. (2020) in which the individual response of indicator species to hydromorphological fluctuations was expressed as the stream subtypes (permanent flow streams and intermittent narrow streams). Most bryophyte species, e.g. Scapania undulata, Chiloscyphus polyanthos and Platyhypnidium riparioides, and vascular plants, e.g. Veronica beccabunga and Berula erecta, were associated with increased values of WRH. In contrast, several eurytopic taxa, e.g. Potamogeton pectinatus, Glyceria maxima and Sparganium erectum, including the invasive alien species E. canadensis, were negatively correlated with this index. Because some of the surveyed sections of the rivers were significantly shaded, e.g. the upper courses of the Mleczna, Wiercica, Dziechcinka and Vistula rivers, this phenomenon could bias the results (Vermaat and Debruyne, 2003). In addition, we recorded very high percentage coverage of helophytes and elodeids in the rivers divided by dam reservoirs, namely the Mitręga River and the lower course of the Wiercica River. This result can be explained by an increase in transparency and nutrients and a reduction in water level fluctuations that are caused by dam reservoirs (Stanford and Ward, 1979; Allan and Castillo, 2007). We observed similar disturbances in the rivers with a significant inflow of organic pollutants (the Mleczna and Korzenica rivers). Many previous studies have shown that the environmental variables associated with eutrophication are among the most important ones in explaining the distribution of macrophytes in rivers (e.g. Hering et al., 2006; Johnson et al., 2006; Szoszkiewicz et al., 2006, 2010; Jusik et al., 2015). In contrast, our results showed that even if the concentrations of nutrients in the river water are relatively high, other parameters such as salinity may play an important role in explaining the differences in macrophyte distribution in rivers. Therefore, in the light of many studies on the effect of nutrients on the distribution of macrophytes and the wide use of macrophytes for determining the degree of degradation of flowing waters in many countries, it is important to explain the lack of statistically significant correlations between them in our survey.
Attention should also be paid to the importance of flow velocity, the geology of the catchment and the bottom substrate (Janauer and Dokulil, 2006). We also considered other anthropogenic factors such as the organic pollution gradient, which was probably too low or may have reduced due to other variables. The shaded sampling sites (sections of rivers) may also affect the relationship between macrophytes and other environmental variables (Vermaat and Debruyne, 2003; Janauer and Dokulil, 2006). Some disturbances such as flow intermittence can interfere with the response of macrophytes to environmental factors; this might be due to the absence of species sensitive to these factors (Soria et al., 2019). Moreover, a higher diversity of vegetation is often observed on modified banks (ripraps) of watercourses rather than on unfortified banks (Wollny et al., 2019). Nevertheless, when selecting the sampling sites, we attempted to avoid the shaded sections of rivers wherever possible, which is validated by the frequently recorded macrophyte taxa in the studied rivers. According to Haslam (2006) and Janauer and Dokulil (2006), it can be stated that the negative correlation between the value of the WRH index and the distribution of E. canadensis, S. erectum, P. crispus and P. pectinatus, which are associated with eutrophic waters, indicates that the hydromorphological transformations are associated with organic pollution or that these four plant species respond similarly to these two factors. However, the number of oligotrophic taxa increased with an increase in the WRH index. Janauer and Dokulil (2006) indicated that most species that tolerate a high trophic level also tolerate increased salinity. Among these species, a perfect example is P. pectinatus, which is found in shallow saline lakes in Austria and Hungary (Dinka et al., 2004) and in the Mleczna River. Such preferences of some species may also explain the lack of a significant impact of the organic pollution gradient on the occurrence of macrophytes in the studied rivers.
The results of the CCA showed that the environmental factors reflecting spatial variables, i.e. altitude, and those reflecting geology, i.e. the type and grain size composition of the bottom sediments (medium sand), also significantly affected the occurrence of macrophytes. Many previous studies have also shown a significant effect of altitude and the granulometry of the bottom sediments on the occurrence of macrophytes (e.g. Jusik et al., 2015; Steffen et al., 2014; Szoszkiewicz et al., 2014; Szoszkiewicz et al., 2018). Our survey showed that the predominant bryophyte communities consisted almost exclusively of mosses and liverworts in the flysch streams. The low permeability of this type of bedrock implies that even small rainstorms may induce flash floods. Thus, plants with a different type of growth pattern are unable to survive for long in such environmental conditions. In addition to the altitude and quality of water, these streams were also characterised by the largest stream gradients and therefore by the most dynamic flow velocity, and their bottom sediments were formed by the largest fractions of stones and sometimes by rock outcrops. The rapid flow of water in these types of rivers is a key factor that shapes the vegetation (Haslam, 2006). These factors prevented the rooting of elodeids and helophytes, which were recorded only in the most human-impacted sections in the flysch streams. For example, because of its morphological structure, E. canadensis avoids mountain streams (Haslam, 2006). However, E. canadensis occurred in one of the sections of the flysch streams that had been subjected to strong human pressure (the lower course of the Vistula River). According to Westlake (1975), Janauer and Dokulil (2006) and Allan and Castillo (2007), the adverse physical and chemical conditions of water, including higher values of hardness, mainly result in the dominance of helophytes and elodeids. Although macroalgae communities dominated in the Bolina River, they were shaped by the saline-resistant taxa. In both the lowland sandy streams and rivers of abiotic types 5 and 6 (the Centuria and Mitręga rivers), which had been subjected to weaker human pressure, medium sand was dominant in the bottom sediments, which enabled the rooting and growth of the vascular plants. In addition, low flow velocity and dense vegetation formed by the helophytes and nymphaeids enabled pleustophytes to inhabit the surface of water in these rivers. Because macrophytes commonly occur in rivers, even in high mountains, Haslam (2006), Janauer and Dokulil (2006) and Szoszkiewicz et al. (2010, 2018) suggested that aquatic plants can be used to assess the quality of flowing waters. Our survey proved that macrophytes can respond not only to organic pollution but also to many other environmental factors including hydromorphological transformations. These results are consistent with the surveys of Bis (2008) and Szoszkiewicz et al. (2010, 2018). Thus, we suggest further research on the use of macrophytes for assessing the quality of flowing waters.
5 Conclusion
Our results confirm that many factors simultaneously influence the occurrence of macrophytes in human-impacted rivers. Factors related to geology (medium sand), geography (altitude), water pollution (conductivity) and habitat quality, which are highlighted by the values of the Hydromorphological Diversity Index (WRH), significantly affect the occurrence of aquatic plants in rivers. The CCA showed that the macrophyte species characteristic for oligotrophic waters are associated with the number of natural features of rivers, riverbeds and a low level of human pressure in the adjacent land use (positive correlation with the WRH index). On the contrary, eurytopic species, including the invasive alien species Elodea canadensis, were negatively correlated with the values of the WRH index and positively correlated with high conductivity. However, the occurrence of eurytopic species, including invasive alien macrophyte species, can only occur when there is tolerance/resilience to a particular factor, especially salinity. These results revealed that both the increase in conductivity caused by the discharge of underground coal mine water and the hydromorphological transformation of the rivers reflected by the values of the WRH index led to a loss of vegetation diversity and to the replacement of freshwater species with brackish or salt-resistant species.
As there are very few studies on the effects of salinity on aquatic plants, further research is needed to clarify this phenomenon. Furthermore, rivers with strong secondary salinity can serve as a model for studying the impact of climate change on aquatic biota. This result confirmed that even if the concentrations of nutrients in water are relatively high, the other parameters of water, for example, salinity, may play an important role in explaining the distribution of macrophytes, especially in secondary salinised rivers subjected to the pressure of the discharge of salty coal mine water. Our research showed the usefulness of the hydromorphological survey based on the appropriate indices to explain the macrophyte distribution in rivers (especially in human-impacted rivers). Therefore, we recommend the application of the hydromorphological survey based on the HIR (Hydromorphological Index for Rivers) method.
In addition, our results provide new data on the response of individual macrophytes and plant communities to hydromorphological transformations and on the response of river macrophytes to salinity (tolerance range) in rivers with strong secondary salinity as well as in rivers without the influence of human activity. These data can be used to manage flowing waters and the adjacent areas and can be important for assessing the ecological quality of these ecosystems.
It is extremely important to solve the problem of water salinity as it is one of the main factors that causes the loss of biodiversity in inland water worldwide. The phenomenon of salinisation of inland water will certainly be aggravated by climate change in some regions. Therefore, comprehensive and restrictive regulations and solutions are necessary not only for the European Union countries but also for the rest of the world to effectively manage the main pollution factors that adversely affect the biota in aquatic environment as well as the economic cost and impact on human health.
Supplementary Material
Supplementary Table S1. Access Supplementary Material
Acknowledgements
This research was partially supported by the Polish Ministry of Science and Higher Education Funding for Statutory Activities (Young Scientists 2018 grant). The authors are grateful to the Editor-in-Chief and the anonymous reviewers for their valuable suggestions and comments, which have significantly improved the quality of this manuscript. The authors are deeply indebted to Translmed Publishing Group (Bedford, NH, USA), a proofreading and copyediting company for correcting and improving the language of the manuscript. We would also like to thank Szymon Jusik, Ph.D. Eng., University of Life Science in Poznań, Poland, for confirming the taxonomic identification of the bryophytes, and Agnieszka Błońska, Ph.D., University of Silesia in Katowice, Poland, for her consultation on the research methodology.
References
- Abati S, Minciardi MR, Ciadamidaro S, Fattorini S, Ceschin S. 2016. Response of macrophyte communities to flow regulation in mountain streams. Environ Monit Assess 188: 1–12. [CrossRef] [PubMed] [Google Scholar]
- Aguiar FC, Segurado P, Urbanic G, Cambra J, Chauvin C, Ciadamidaro S, Dörflinger G, Ferreira J, Germ M, Manolaki P, Minciardi MR, Munné A, Papastergiadou E, Ferreira MT. 2014. Comparability of river quality assessment using macrophytes: a multi-step procedure to overcome biogeographical differences. Sci Total Environ 476: 757–767. [CrossRef] [PubMed] [Google Scholar]
- Allan JD, Castillo MM. 2007. Stream ecology: Structure and function of running waters. Dordrecht: Springer, 436 p. [Google Scholar]
- Arle J, Wagner F. 2013. Effects of anthropogenic salinisation on the ecological status of macroinvertebrate assemblages in the Werra River (Thuringia, Germany). Hydrobiologia 701: 129–148. [Google Scholar]
- Baattrup-Pedersen A, Riis T. 1999. Macrophyte diversity and composition in relation to substratum characteristics in regulated and unregulated Danish streams. Freshw Biol 42: 375–385. [Google Scholar]
- Bis B. 2008. Assessing the Ecological Status Assessment of Freshwaters. In: Voreadou C, ed. Freshwater Ecosystems in Europe − An Educational Approach. Natural History Museum of Crete, Selena Press, Heraklion, Greece, 56–59. [Google Scholar]
- Brock MA, Nielsen DL, Crosslé K. 2005. Changes in biotic communities developing from freshwater wetland sediments under experimental salinity and water regimes. Freshw Biol 50: 1376–1390. [Google Scholar]
- Byers EJ, Cuddington K, Jones CG, Talley TS, Hastings A, Lambrinos JG, Crooks JA, Wilson WG. 2006. Using ecosystem engineers to restore ecological systems. Trends Ecol Evol 21: 493–500. [CrossRef] [PubMed] [Google Scholar]
- Cañedo-Argüelles M, Kefford BJ, Piscart C, Prat N, Schäfer RB, Schulz C-J. 2013. Salinisation of rivers: an urgent ecological issue. Environ Pollut 173: 157–167. [Google Scholar]
- Chambers PA, DeWreede RE, Irlandi EA, Vandermeulen H. 1999. Management issues in aquatic macrophyte ecology: a Canadian perspective. Can J Bot 77: 471–487. [Google Scholar]
- Chambers PA, Lacoul P, Murphy KJ, Thomaz SM. 2008. Global diversity of aquatic macrophytes in freshwater. Hydrobiologia 595: 9–26. [Google Scholar]
- Chmura D. 2014. Phytocoenotic characteristics of secondary forest communities with contribution of Quercus rubra L. in the Silesian Upland. Acta Botanica Silesiaca 10: 17–40. [Google Scholar]
- Dinka M, Ágnoston-Szabó E, Berczik A, Kutrucz G. 2004. Influence of water level fluctuation on the spatial dynamic of the water chemistry at Lake Fertő/Neusiedler See. Limnologica 34: 48–56. [Google Scholar]
- Directive, 2000. Directive 2000/60/EC of the European Parliament and of the Council of 23 October 2000 establishing a framework for Community action in the field of water policy. Official Journal of the European Communities L327: 1–72. [Google Scholar]
- Engelhardt KAM, Ritchie ME. 2001. Effects of macrophyte species richness on wetland ecosystem functioning and services. Nature 411: 687–689. [CrossRef] [PubMed] [Google Scholar]
- Fovler J, Cohen L, Jarvis P. 1998. Practical statistics for field biology. England: Wiley, 272 p. [Google Scholar]
- Gebler D, Wiegleb G, Szoszkiewicz K. 2018. Integrating river hydromorphology and water quality into ecological status modelling by artificial neural networks. Water Res 139: 395–405. [CrossRef] [PubMed] [Google Scholar]
- Grime JP. 1997. Biodiversity and ecosystem function: the debate deepens. Science 277: 1260–1261. [Google Scholar]
- Halabowski D, Bielańska-Grajner I, Lewin I. 2019. Effect of underground salty mine water on the rotifer communities in the Bolina River (Upper Silesia, Southern Poland). Knowl Manag Aquat Ecosyst 420: 31. [CrossRef] [Google Scholar]
- Halabowski D, Lewin I, Buczyński P, Krodkiewska M, Płaska W, Sowa A, Buczyńska E. 2020. Impact of the discharge of salinised coal mine waters on the structure of the macroinvertebrate communities in an urban river (Central Europe). Water Air Soil Pollut 321: 5. [Google Scholar]
- Halabowski D, Sowa A, Krodkiewska M. 2018. Inland coal mine settling pond as a habitat for the brackish-water plant Ruppia maritima . Pol J Ecol 66: 301–308. [CrossRef] [Google Scholar]
- Hart BT, Bailey P, Edwards R, Hortle K, James K, McMahon A, Meredith C, Swadling K. 1991. A review of the salt sensitivity of the Australian fresh-water biota. Hydrobiologia 210: 105–144. [Google Scholar]
- Haslam SM. 2006. River plants: the macrophytic vegetation of watercourses. 2nd Revised edition. Cardigan: Forrest Text, 450 p. [Google Scholar]
- Hauer FR, Lamberti GA. 2007. Methods in stream ecology, 2nd edn. Amsterdam–Boston–Heidelberg–London–New York–Oxford–Paris–San Diego–San Francisco–Singapore–Sydney–Tokyo: Academic Press, Elsevier, 896 p. [Google Scholar]
- Herbert ER, Boon P, Burgin AJ, Neubauer SC, Franklin RB, Ardón M, Hopfensperger KN, Lamers LPM, Gell P. 2015. A global perspective on wetland salinization: ecological consequences of a growing threat to freshwater wetlands. Ecosphere 6: 1–43. [Google Scholar]
- Hering D, Johnson RK, Kramm S, Schmutz S, Szoszkiewicz K, Verdonschot PFM. 2006. Assessment of European streams with diatoms, macrophytes, macroinvertebrates and fish: a comparative metric-based analysis of organism response to stress. Freshw Biol 51: 1757–1785. [Google Scholar]
- Hermanowicz W, Dojlido J, Dożańska W, Koziorowski B, Zerbe J. 1999. Physical and chemical studies of water and wastewater. Warszawa: Arkady, 558 p. [Google Scholar]
- Hintz WD, Relyea RA. 2019. A review of the species, community, and ecosystem impacts of road salt salinisation in fresh waters. Freshw Biol 64: 1081–1097. [Google Scholar]
- Hopfensperger KN, Burgin AJ, Schoepfer VA, Helton AM. 2014. Impacts of saltwater incursion on plant communities, anaerobic microbial metabolism, and resulting relationships in a restored freshwater wetland. Ecosystems 17: 792–807. [Google Scholar]
- James K, Hart B. 1993. Effect of salinity on four freshwater macrophytes. Mar Freshw Res 44: 769–777. [Google Scholar]
- James KR, Cant B, Ryan T. 2003. Responses of freshwater biota to rising salinity levels and implications for saline water management: a review. Aust J Bot 51: 703–713. [CrossRef] [Google Scholar]
- Janauer GA, Dokulil M. 2006. Macrophytes and Algae in Running Waters. In Ziglio G, Siligardi M, Flaim G, eds. Biological Monitoring of Rivers. John Wiley & Sons, UK, 89–109. [CrossRef] [Google Scholar]
- Johnson RK, Hering D, Furse MT, Clarke KE. 2006. Detection of ecological change using multiple organism groups: metrics and uncertainty. Hydrobiologia 566: 115–137. [Google Scholar]
- Jusik S, Szoszkiewicz K, Kupiec JM, Lewin I, Samecka-Cymerman A. 2015. Development of comprehensive river typology based on macrophytes in the mountain-lowland gradient of different Central European ecoregions. Hydrobiologia 745: 241–262. [Google Scholar]
- Kaijser W, Kosten S, Hering D. 2019. Salinity tolerance of aquatic plants indicated by monitoring data from the Netherlands. Aquat Bot 158: 103129. [Google Scholar]
- Kelly VR, Lovett GM, Weathers KC, Findlay SEG, Strayer DL, Burns DJ, Likens GE. 2008. Long-term sodium chloride retention in a rural watershed: Legacy effects of road salt on streamwater concentration. Environ Sci Technol Lett 42: 410–415. [Google Scholar]
- Klama H. 2006. Systematic catalogue of Polish liverwort and hornwort taxa. In: Szweykowski J, ed. An annotated checklist of Polish liverworts and hornworts. Kraków: W. Szafer Institute of Botany PAS, 83–100. [Google Scholar]
- Kozlowski T. 1997. Responses of woody plants to flooding and salinity. Tree Physiology Monograph 1: 1–29. [Google Scholar]
- Ladrera R, Cañedo-Argüellesa M, Prat N. 2017. Impact of potash mining in streams: the Llobregat basin (northeast Spain) as a case study. J Limnol 76: 343–354. [Google Scholar]
- Lewin I, Halabowski D, Rymarski Z. 2018. The first records of the occurrence of a North American invader Gammarus tigrinus Sexton, 1939 in the tributaries of the upper Vistula River. Knowl Manag Aquat Ecosyst 419: 31. [CrossRef] [Google Scholar]
- Manolaki P, Kun G, Vieira C, Papastergiadou E, Riis T. 2020. Hydromorphology as a controlling factor of macrophytes assemblage structure and functional traits in the semi-arid European Mediterranean streams. Sci Total Environ 703: 134658. [CrossRef] [PubMed] [Google Scholar]
- Matuszkiewicz W. 2008. A guide for marking Poland's plant communities. In: Faliński JB, ed. Vademecum Geobotanicum 3. Warszawa: PWN, 1–537. [Google Scholar]
- McCune B, Grace JB. 2002. Analysis of ecological communities. Oregon, USA, Gleneden Beach: MjM Software Design, 300 p. [Google Scholar]
- McKee KL, Mendelssohn IA. 1989. Response of a freshwater marsh plant community to increased salinity and increased water level. Aquat Bot 34: 301–316. [Google Scholar]
- Mirek Z, Piękoś-Mirkowa H, Zając A, Zając M. 2002. Flowering plants and pteridophytes of Poland. A checklist. In: Mirek Z, ed. Biodiversity of Poland, 1. Kraków: W. Szafer Institute of Botany PAS, 1–442. [Google Scholar]
- Mucina L, Bültmann H, Dierßen K, Theurillat J-P, Raus T, Čarni A, Šumberová K, Willner W, Dengler J, Gavilán García R, Chytrý M, Hájek M, Di Pietro R, Iakushenko D, Pallas J, Daniëls FJA, Bergmeier E, Santos Guerra A, Ermakov N, Valachovič M, Schaminée JHJ, Lysenko T, Didukh YP, Pignatti S, Rodwell JS, Capelo J, Weber HE, Solomeshch A, Dimopoulos P, Aguiar C, Hennekens SM, Tichý L. 2016. Vegetation of Europe: hierarchical floristic classification system of vascular plant, bryophyte, lichen, and algal communities. Appl Veg Sci 19: 3–264. [Google Scholar]
- Munns R, Tester M. 2008. Mechanisms of salinity tolerance. Annu Rev Plant Biol 59: 651–681. [Google Scholar]
- Neubauer SC, Craft CB. 2009. Global change and tidal freshwater wetlands: Scenarios and impacts. In: Barendregt A, Whigham DF, Baldwin AH, ed. Tidal freshwater wetlands. Leiden: Backhuys Publishers, 253–266. [Google Scholar]
- Nielsen DL, Brock MA, Rees GN, Baldwin DS. 2003. Effects of increasing salinity on freshwater ecosystems in Australia. Aust J Bot 51: 655–665. [CrossRef] [Google Scholar]
- Ochyra R, Żarnowiec J, Bednarek-Ochyra H. 2003. Census Catalogue of Polish Mosses. In: Mirek Z, ed. Biodiversity of Poland, 3. Kraków: W. Szafer Institute of Botany PAS, 1–372. [Google Scholar]
- Pieterse AH, Murphy KJ. 1993. Aquatic weeds, 2nd ed. Oxford: Oxford University Press, 612 p. [Google Scholar]
- Piscart C, Moreteau J-C, Beisel J-N. 2005. Biodiversity and structure of macroinvertebrate communities along a small permanent salinity gradient (Meurthe River, France). Hydrobiologia 551: 227–236. [Google Scholar]
- Pittock J, Connell D. 2010. Australia demonstrates the planet's future: water and climate in the Murray-Darling Basin. Int J Water Resour Dev 26: 561–578. [Google Scholar]
- Rahel FJ, Olden JD. 2008. Assessing the effects of climate change on aquatic invasive species. Conserv Biol 22: 521–533. [Google Scholar]
- Ratyńska H, Wojterska M, Brzeg A. 2010. Multimedialna encyklopedia zbiorowisk roślinnych Polski ver. 1.1. Bydgoszcz: Instytut Edukacyjnych Technologii Informatycznych. [Google Scholar]
- Reddy KR, DeLaune RD. 2008. Biogeochemistry of wetlands: science and applications. Boca Raton: CRC Press, 800 p. [Google Scholar]
- Regulation, 2014. Rozporządzenie Ministra Środowiska z dnia 9 października 2014 r. w sprawie ochrony gatunkowej roślin. Available from http://prawo.sejm.gov.pl/isap.nsf/DocDetails.xsp?id=WDU20140001409 (Accessed 05.03.2020). [Google Scholar]
- Robinson RW, James EA, Boon PI. 2012. Population structure in the clonal, woody wetland plant Melaleuca ericifolia (Myrtaceae): an analysis using historical aerial photographs and molecular techniques. Aust J Bot 60: 9–19. [CrossRef] [Google Scholar]
- Schinegger R, Trautwein C, Melcher A, Schmutz S. 2012. Multiple human pressures and their spatial patterns in European running waters. Water Environ J 26: 261–273. [CrossRef] [PubMed] [Google Scholar]
- Soria M, Gutiérrez-Cánovas C, Bonada N, Acosta R, Rodríguez-Lozano P, Fortuño P, Burgazzi G, Vinyoles D, Gallart F, Latron J, Llorens P, Prat N, Cid N. 2019. Natural disturbances can produce misleading bioassessment results: Identifying metrics to detect anthropogenic impacts in intermittent rivers. J Appl Ecol 57: 283–295. [Google Scholar]
- Sowa A, Krodkiewska M, Halabowski D, Lewin I. 2019. Response of the mollusc communities to environmental factors along an anthropogenic salinity gradient. Sci Nat 106: 60. [CrossRef] [Google Scholar]
- Stanford JA, Ward JV. 1979. Stream regulation in North America. In: Stanford JA, Ward JV, ed. The ecology of Regulated Rivers. New York: Plenum Publishing Corporation, 215–236. [CrossRef] [Google Scholar]
- Steffen K, Leuschner C, Müller U, Wiegleb G, Becker T. 2014. Relationships between macrophyte vegetation and physical and chemical conditions in northwest German running waters. Aquat Bot 113: 46–55. [Google Scholar]
- Strozik G. 2017. Reduction of saline waters discharge from coal mines through filling and sealing of underground voids. World Scientific News 72: 498–512. [Google Scholar]
- Szöcs E, Coring E, Bäthe J, Schäfer RB. 2014. Effects of anthropogenic salinization on biological traits and community composition of stream macroinvertebrates. Sci Total Environ 468–469: 943–949. [PubMed] [Google Scholar]
- Szoszkiewicz K, Ferreira T, Korte T, Baattrup-Pedersen A, Davy-Bowker J, O'Hare M. 2006. European river plant communities: the importance of organic pollution and the usefulness of existing macrophyte metrics. Hydrobiologia 566: 211–234. [Google Scholar]
- Szoszkiewicz K, Jusik S, Adynkiewicz-Piragas M, Gebler D, Achtenberg K, Radecki-Pawlik A, Okruszko T, Gielczewski M, Pietruczuk K, Przesmycki M, Nawrocki P. 2017a. Podręcznik oceny wód płynących w oparciu o Hydromorfologiczny Indeks Rzeczny. Biblioteka Monitoringu Środowiska, Warszawa, 189 p. [Google Scholar]
- Szoszkiewicz K, Jusik S, Adynkiewicz-Piragas M, Gebler D, Achtenberg K, Radecki-Pawlik A, Okruszko T, Gielczewski M, Pietruczuk K, Przesmycki M, Nawrocki P. 2017b. Hydromorphological Index for Rivers (HIR). Hydromorphological assessment and classification method for running waters in Poland fulfilling standards of PN-EN 14614: 2008. Available from http://www.gios.gov.pl/images/dokumenty/pms/monitoring_wod/zadanie_6a_raport.pdf (Accessed 25.04.2020). [Google Scholar]
- Szoszkiewicz K, Jusik S, Lewin I, Czerniawska-Kusza I, Kupiec JM, Szostak M. 2018. Macrophyte and macroinvertebrate patterns in unimpacted mountain rivers of two European ecoregions. Hydriobiologia 808: 327–342. [CrossRef] [Google Scholar]
- Szoszkiewicz K, Zbierska J, Jusik S, Zgoła T. 2010. Macrophyte Method for River Assessment. A methodological manual on the assessment and classification of the ecological status of flowing waters based on aquatic plants. Poznań: Bogucki Wydawnictwo Naukowe, 81 p. [Google Scholar]
- Szoszkiewicz K, Ciecierska H, Kolada A, Schneider SC, Szwabińska M, Ruszczyńska J. 2014. Parameters structuring macrophyte communities in rivers and lakes − results from a case study in North-Central Poland. Knowl Manag Aquat Ecosyst 415: 08. [CrossRef] [Google Scholar]
- Teeter JW. 1965. Effects of sodium chloride on the sago pondweed. J Wildl Manage 29: 838–845. [Google Scholar]
- Ter Braak CJF, Šmilauer P. 2002. CANOCO reference manual and CanoDraw for Windows user's guide: software for canonical community ordination (version 4.5). Ithaca: Microcomputer Power, 500 p. [Google Scholar]
- Thouvenot L, Deleu C, Berardocco S, Haury J, Thiébaut G. 2015. Characterization of the salt stress vulnerability of three invasive freshwater plant species using a metabolic profiling approach. J Plant Physiol 175: 113–121. [CrossRef] [PubMed] [Google Scholar]
- Thouvenot L, Haury J, Thiébaut G. 2012. Responses of two invasive macrophyte species to salt. Hydrobiologia 686: 213–223. [Google Scholar]
- Thouvenot L, Thiébaut G. 2018. Regeneration and colonization abilities of the invasive species Elodea canadensis and Elodea nuttallii under a salt gradient: implications for freshwater invasibility. Hydrobiologia 817: 193–203. [Google Scholar]
- Todd AK, Kaltenecker MG. 2012. Warm season chloride concentrations in stream habitats of freshwater mussel species at risk. Environ Pollut 171: 199–206. [Google Scholar]
- van den Brink FWB, van der Velde G. 1993. Growth and morphology of four freshwater macrophytes under the impact of the raised salinity level of the Lower Rhine. Aquat Bot 45: 285–297. [Google Scholar]
- Vermaat JE, Debruyne RJ. 2003. Factors limiting the distribution of submerged waterplants in the lowland river Vecht (The Netherlands). Freshw Biol 30: 147–157. [Google Scholar]
- Vörösmarty CJ, Green P, Salisbury J, Lammers RB. 2000. Global water resources: vulnerability from climate change and population growth. Science 289: 284–288. [Google Scholar]
- Vörösmarty CJ, McIntyre PB, Gessner MO, Dudgeon D, Prusevich A, Green P, Glidden S, Bunn SE, Sullivan CA, Liermann CR. 2010. Global threats to human water security and river biodiversity. Nature 467: 555–561. [CrossRef] [PubMed] [Google Scholar]
- Westlake DF. 1975. Macrophytes. In: Whitton BA, ed. River Ecology. Berkeley, CA: University of California Press, 106–128. [Google Scholar]
- Williams WD. 2001. Anthropogenic salinisation of inland waters. Hydrobiologia 466: 329–337. [Google Scholar]
- Wollny JT, Otte A, Harvolk-Schöning S. 2019. Dominance of competitors in riparian plant species composition along constructed banks of the German rivers Main and Danube. Ecol Eng 127: 324–337. [Google Scholar]
- Wood KA, O'Hare MT, McDonald C, Searle KR, Daunt F, Stillman RA. 2017. Herbivore regulation of plant abundance in aquatic ecosystems. Biol Rev 92: 1128–1141. [CrossRef] [Google Scholar]
- Zhao Q, Guo F, Zhang Y, Yang Z, Ma S. 2018. Effects of secondary salinisation on macroinvertebrate functional traits in surface mining-contaminated streams, and recovery potential. Sci Total Environ 640–641: 1088–1097. [CrossRef] [PubMed] [Google Scholar]
- Zimmermann-Timm H. 2007. Salinisation of inland waters. In Lozan J, Grssl H, Hupfer P, Menzel L, Schönwiese C, eds. Water Uses and Human Impacts on the Water Budget. Verlag Wissenschaftliche Auswertungen/GEO, Hamburg, 133–136. [Google Scholar]
Cite this article as: Halabowski D, Lewin I. 2020. Impact of anthropogenic transformations on the vegetation of selected abiotic types of rivers in two ecoregions (Southern Poland). Knowl. Manag. Aquat. Ecosyst., 421, 35.
All Tables
The physical and chemical parameters of the water of the studied rivers (ranges) and the results of the Kruskal–Wallis and Dunn's multiple comparison post hoc tests (superscripts a,b,c,d,e,f,g,h above a whisker denote significant differences between the rivers). Abbreviations: a − the Bolina River, b − the Centuria River, c − the Mitręga River, d − the Mleczna River, e − the Dziechcinka River, f − the Vistula River, g − the Korzenica River, h − the Wiercica River.
Spatial variables, the morphology of the riverbed, the values of the hydromorphological indices, the characteristics of the bottom sediments and the results of the Kruskal–Wallis and Dunn's multiple comparison post hoc tests (superscripts a,b,c,d,e,f,g,h denote significant differences between the rivers). Abbreviations: see Table 1.
Plant communities in the studied rivers. Abbreviations: BOL − the Bolina River, CEN − the Centuria River, MIT − the Mitręga River, MLE − the Mleczna River, DZI − the Dziechcinka River, VIS − the Vistula River, KOR − the Korzenica River, WIE − the Wiercica River.
All Figures
|
Fig. 1 Location of the study area and the sampling sites. |
| In the text | |
|
Fig. 2 Box-and-whisker plot showing the number of macrophyte taxa. *An asterisk above a whisker denotes significant differences between the rivers. Abbreviations: a − the Bolina River, b − the Centuria River, c − the Mitręga River, d − the Mleczna River, e − the Dziechcinka River, f − the Vistula River, g − the Korzenica River, h − the Wiercica River. |
| In the text | |
|
Fig. 3 Box-and-whisker plot showing (a) the percentage of macroalgae coverage, (b) the percentage of bryophyte coverage, (c) the percentage of elodeid coverage, (d) the percentage of nymphaeid coverage, (e) the percentage of pleustophyte coverage and (f) the percentage of helophyte coverage in the studied rivers. *An asterisk above a whisker denotes significant differences between the rivers. Abbreviations: see Figure 2. |
| In the text | |
|
Fig. 4 Ordination diagram (biplot) based on the canonical correspondence analysis (CCA) of the macrophyte taxa and selected environmental variables. Abbreviations: B.e − Berula erecta, B.r − Brachythecium rivulare, Ba − Batrachyspermum sp., C.p − Chiloscyphus polyanthos, C.pn − Carex paniculata, C.r − C. rostrata, Ca − Callitriche sp., E.c − Elodea canadensis, En − Enteromorpha sp., F.a − Fontinalis antipyretica, G.f − Glyceria fluitans, G.m − G. maxima, H.l − Hygrohypnum luridum, L.m − Lemna minor, L.r −Leptodictyum riparium, Le − Lemanea sp., Ly − Lyngbya sp., M.a − Marchantia polymorpha, M. pa − Myosotis palustris, N.l − Nuphar lutea, P.af − Plagiomnium affine, P.ar − Phalaris arundinacea, P.au − Phragmites australis, P.c − Potamogeton crispus, P.n − P. natans, P.p − P. pectinatus, P.r − Platyhypnidium riparioides, R.am − Rorippa amphibia, R.aq − Ranunculus aquatilis, R.f − R. fluitans, R.s − R. sclerantus, R.fl − Riccia fluitans, R.p − Rhizonium punctatum, S.em − Sparganium emersum, S.er − S. erectum, S.h − Sciuro-hypnum plumosum, S.s − Scirpus sylvaticus, S.sa − Sagittaria sagittifolia, S.u − Scrophularia umbrosa, Su − Scapania undulata, T.a − Thamnobryum alopecurum, Ul − Ulothrix sp., V.a − Veronica anagalis-aquatica, V.b − V. beccabunga, Va − Vaucheria sp. |
| In the text | |
|
Fig. 5 Ordination diagram (biplot) based on the canonical correspondence analysis (CCA) of the types of plant communities and selected environmental variables. Abbreviations: B − bryophyte-dominated communities, E − elodeid-dominated communities, H − helophyte-dominated communities, M − macroalgae-dominated communities. |
| In the text | |
Current usage metrics show cumulative count of Article Views (full-text article views including HTML views, PDF and ePub downloads, according to the available data) and Abstracts Views on Vision4Press platform.
Data correspond to usage on the plateform after 2015. The current usage metrics is available 48-96 hours after online publication and is updated daily on week days.
Initial download of the metrics may take a while.