| Issue |
Knowl. Manag. Aquat. Ecosyst.
Number 421, 2020
Topical issue on Crayfish
|
|
|---|---|---|
| Article Number | 1 | |
| Number of page(s) | 10 | |
| DOI | https://doi.org/10.1051/kmae/2019042 | |
| Published online | 10 December 2019 | |
Research Paper
Morphological diversity of the stone crayfish − traditional and geometric morphometric approach
Diversité morphologique de l'écrevisse des torrents − approche morphométrique traditionnelle et géométrique
1
University of Zagreb, Faculty of Science, Department of Biology, Rooseveltov trg 6, 10000 Zagreb, Croatia
2
Oikon d.o.o. − Institut za primijenjenu ekologiju, Trg senjskih uskoka 1-2, 10000 Zagreb, Croatia
3
Varaždin City Museum, Entomological Department, Franjevački trg 10, 42000 Varaždin, Croatia
* Corresponding author: This email address is being protected from spambots. You need JavaScript enabled to view it.
Received:
24
July
2019
Accepted:
17
October
2019
Abstract
Austropotamobius torrentium is one of four native European crayfish species inhabiting Croatian freshwaters. Existence of eight divergent monophyletic mtDNA phylogroups was described within A. torrentium; six of them are distributed in Croatia, with the highest genetic diversity established in its northern-central Dinaric region. Recent small-scale study of the stone crayfish morphological variability indicated significant differences among different phylogroups. In the present study larger sample size, covering populations from five phylogroups, was analysed with the aim of determining whether there are morphological characteristics that reliably separate stone crayfish from different phylogroups. Aiming this, 245 stone crayfish were analysed through traditional (TM) and, for the first time, geometric morphometric (GM) analyses. Multivariate discriminant analyses included 24 TM characteristics per crayfish, while GM comprised analyses of 22 landmarks on the dorsal side of cephalon. Both methods revealed congruent results, and significant differences among phylogroups in analysed features were obtained, with the cephalon shape contributing the most to crayfish discrimination. Research confirmed that both approaches, combined with statistical methods, are useful in distinguishing and separating crayfish phylogroups. Findings of present study are compatible with the previous molecular findings; stone crayfish present several distinct evolutionary lineages whose species status are currently undefined and require urgent clarification.
Résumé
Austropotamobius torrentium est l'une des quatre espèces indigènes d'écrevisses européennes qui peuplent les eaux douces croates. L'existence de huit phylogroupes divergents d'ADNmt monophylétiques a été décrite chez A. torrentium ; six d'entre eux sont distribués en Croatie, avec la plus grande diversité génétique établie dans sa région dinarique nord-centre. Une étude récente à petite échelle de la variabilité morphologique de l'écrevisse des torrents a révélé des différences significatives entre les différents phylogroupes. Dans la présente étude, on a analysé des échantillons de plus grande taille, couvrant des populations de cinq phylogroupes, dans le but de déterminer s'il existe des caractéristiques morphologiques qui séparent de façon fiable les écrevisses des torrents des différents phylogroupes. Dans ce but, 245 écrevisses des torrents ont été analysées par des analyses traditionnelles (TM) et, pour la première fois, morphométriques géométriques (GM). Les analyses discriminantes à plusieurs variables comprenaient 24 caractéristiques TM par écrevisse, tandis que les analyses GM comprenaient des analyses de 22 repères sur la face dorsale du céphalon. Les deux méthodes ont révélé des résultats congruents, et des différences significatives entre les phylogroupes dans les traits analysés ont été obtenues, la forme du céphalon contribuant le plus à la discrimination des écrevisses. La recherche a confirmé que les deux approches, combinées à des méthodes statistiques, sont utiles pour distinguer et séparer les phylogroupes d'écrevisses. Les résultats de la présente étude sont compatibles avec ceux des études moléculaires précédentes ; les écrevisses des torrents présentent plusieurs lignées évolutives distinctes dont le statut d'espèce n'est pas encore défini et nécessite une clarification urgente.
Key words: Austropotamobius torrentium / Generalized Procrustes Analysis / landmark / multivariate discriminant analysis / semilandmark
Mots clés : Austropotamobius torrentium / Analyse procrustéenne généralisée / points de repère / analyse discriminante multivariée / marques de semi-marques
© L. Lovrenčić et al., Published by EDP Sciences 2019
 This is an Open Access article distributed under the terms of the Creative Commons Attribution License CC-BY-ND (https://creativecommons.org/licenses/by-nd/4.0/), which permits unrestricted use, distribution, and reproduction in any medium, provided the original work is properly cited. If you remix, transform, or build upon the material, you may not distribute the modified material.
1 Introduction
The stone crayfish Austropotamobius torrentium (Schrank, 1803) is one of four native European crayfish species inhabiting streams and smaller rivers at higher altitudes of both the Black Sea and the Adriatic Sea basins in Croatian freshwater ecosystems (Maguire et al., 2011). In the last few decades, noticeable declines of stone crayfish populations have been recorded across its distribution range in Europe (Weinländer and Füreder, 2009; Kouba et al., 2014). In Croatia, losses are mainly caused by anthropogenic pressure onto the stone crayfish habitats (fragmentation, waterbody engineering), presence and spread of non-native invasive crayfish species and diseases they transmit (e.g. crayfish plague), as well as climate changes (Maguire et al., 2018). Therefore, the stone crayfish is considered a threatened species, protected by national (NN 80/13, 144/13) and international legislation (Appendix III of the Bern Convention, Appendices II and V of the Habitat Directive (92/43/EEC and 97/62/EU)). Efficient protection of existing populations requires development of conservation and management plans based on the sound knowledge of species, including information on genetics and morphology (Peay, 2009; Souty-Grosset and Reynolds, 2009).
Previous molecular-phylogenetic research based on mtDNA by Trontelj et al. (2005) indicated that the stone crayfish should be considered a species complex. Later, Klobučar et al. (2013) discovered the existence of at least seven divergent monophyletic phylogroups within A. torrentium, with the highest genetic diversity recorded in the Dinaric region of Croatia, while recently Pârvulescu et al. (2019) described another phylogroup endemic to the Romanian Apuseni region. Moreover, latest analyses of meristic and morphometric features of several stone crayfish populations, belonging to different phylogroups, indicated their significant differences and point to necessity of additional analyses that would cover bigger sample size and wider area (Maguire et al., 2017). Following that idea, a new Austropotamobius crayfish species was just described (Pârvulescu et al., 2019).
In this study we included larger sample size, complementing data set from Maguire et al. (2017) covering populations from five out of seven previously described mtDNA phylogroups (Klobučar et al., 2013). Also, apart from traditional morphometry, we used, for the first time geometric morphometrics on A. torrentium. Geometric morphometrics (GM) is a method with a growing application in different organisms' studies (Caumul and Polly, 2005; Cardini et al., 2007; Becking et al., 2016). It proved itself as a powerful tool in detecting differences in morphology within and among species (Lawing and Polly, 2010). Up till now, in the freshwater crayfish research, GM has been applied in the studies on the white-clawed crayfish (Austropotamobius pallipes (Lereboullet, 1858)) (Scalici et al., 2010; Scalici and Bravi, 2012), red swamp crayfish (Procambarus clarkii (Girard, 1852)) (Malavé et al., 2018), rusty crayfish (Perry et al., 2013) and two Cambarus species (Cambarus halli Hobbs, 1968 and Cambarus englishi Hobbs & Hall, 1972) (Helms et al., 2015).
The aim of this study was to verify if there are significant differences among stone crayfish belonging to different phylogroups, as previous preliminary results indicated (Maguire et al., 2017). Further, the intention was to find which traditional morphometric features discriminate the best different phylogroups. Another objective was to validate if landmark-based GM analyses are suitable for detecting differences in shape among different A. torrentium phylogroups. Finally, the goal was to verify if results of the two methods (traditional and geometric morphometrics) yield congruent results. We expected that morphology of stone crayfish differs among different phylogroups and that results obtained by the two methods are congruent and compatible with the previous molecular findings.
2 Materials and methods
2.1 Sampling
Prior to field work, all of the required permits (working in protected areas, studying strictly protected species) were obtained from the Ministry of Environmental Protection and Energy of the Republic of Croatia. Crayfish were collected from 15 localities covering populations from five previously described mtDNA phylogroups: Gorski Kotar (GK); Žumberak, Plitvice and Bjelolasica (ŽPB); Lika and Dalmatia (LD), Banovina (BAN) and central and south-eastern Europe (CSE) (Trontelj et al., 2005; Klobučar et al., 2013) (Tab. 1, Fig. 1). Sampling was performed by hand during the night or with hand-made traps (Maguire et al., 2002) placed along banks of the stream and left in the water overnight. All captured crayfish specimens were identified to the species level and their sex was determined. Only adult (total length > 5 cm (Huber and Schubart, 2005; Maguire and Klobučar, 2011)), uninjured, intermolt crayfish were examined and measured; 245 individuals were included into traditional morphometric (TM) analyses, and out of them 209 into geometric morphometric (GM) analyses. Discrepancy in the number is due to the fact that some of the landmark positions on some of the crayfish were indistinct, so those crayfish were omitted from the GM analyses.
List of samples; mtDNA phylogroups sensu Klobučar et al. (2013); (Banovina (BAN), Lika and Dalmatia (LD), Gorski Kotar (GK), Žumberak, Plitvice and Bjelolasica (ŽPB), and central and south-eastern Europe (CSE)) with sampled localities (streams) and number of stone crayfish per group (total, and number of males and females).
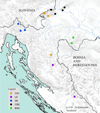 |
Fig. 1 Map of the study area with sampling sites produced in ArcGIS 10.3 program package. Different colours represent different phylogroups sensu Klobučar et al. (2013); ŽPB − Žumberak, Plitvice and Bjelolasica; LD − Lika and Dalmacija; GK − Gorski Kotar; CSE − Central and south-eastern Europe; BAN − Banovina |
2.2 Traditional morphometric analyses
In order to perform traditional morphometric analyses, we measured 24 morphometric characteristics per each crayfish, using a digital calliper with precision of 0.01 mm; 21 were taken from Sint et al. (2005); claw width (CLW), claw length (CLL), claw height (CLH), length of the claw finger (CFL), length of the claw palm (CPL), rostrum width (ROW), rostrum length (ROL), head width (HEW), head length (HEL), areolar width (ARW), areolar length (ARL), abdomen width (ABW), abdomen height (ABH), abdomen length (ABL), telson width (TEW), telson length (TEL), width of the carapace at the hind edges (CEW), carapace height (CPH), carapace width (CPW), width at the cervical groove (CGW), and total length (TL); and extra three included cephalothorax length (CEF), apex length and width (APL and APW, respectively). Bilateral characteristics were recorded on the right body side because it was proven that bilateral characteristics are symmetrical and show no differences between the two body sides (Maguire et al., 2017). Further, all of the measured morphometric characteristics were normalised by dividing their value with the corresponding postorbital length (POL = HEL + ARL) to avoid comparison of different sized crayfish that could lead to false results (Chambers et al., 1979; Palma and Andrade, 2002; Sint et al., 2005). Since t-test showed that males and females differed significantly in characteristics describing claws and abdomen, the two sexes were analysed separately (Sint et al., 2007; Berger et al., 2017; Maguire et al., 2017; Vlach and Valdmanová, 2015). Observed differences are consequence of sexual dimorphism that is characteristic of crayfish and appears upon crayfish attein sexual maturity (Grandjean et al., 1997; Streissl and Hödl, 2002; Vlach and Valdmanová, 2015). Analyses were performed in Microsoft Excel (version 2010) and Statistica 13 (StatSoft. Inc). ANOVA with Bonferroni post-hoc test was applied to verify if there were differences among phylogroups in the measured morphometric characteristics. The multivariate discriminant analysis (MDA) was conducted in order to analyse differentiation of phylogroups based on their morphometric characteristics, and to select morphometric characteristics that made the most significant contribution to separation of crayfish belonging to different phylogroups. The results of the canonical discriminant analysis were visualised by scatterplots for the two discriminant functions.
2.3 Geometric morphometric analyses
Geometric morphometric (GM) method was applied for a detailed analysis of shape variations of crayfish cephalon, especially focussing on the shape of the rostrum and apex. Data for both sexes were merged because no significant differences were found between the two sexes in log-transformed centroid sizes (t = 0.416; p = 0.677) what is in accordance with previous GM studies by Scalici et al. (2010) on A. pallipes (A. torrentium sister species) which revealed lack of sexual dimorphism in GM variables. In order to perform landmark-based morphometrics analyses, a digital picture of the dorsal side of each crayfish cephalon was obtained by scanning cephalon portion of each animal on the Epson Perfection V600 Photo scanner. Each specimen was positioned with dorsal side downwards in a water basin placed on flatbed scanner, while the area of interest (cephalon) was kept parallel to scanner by hand. Images were scaled to cm scale. GM analyses were performed using TPS series (Rohlf, 2015) and MorphoJ (Klingenberg, 2011). The location of 22 equally distributed two-dimensional specific measuring points (12 landmarks − LM and 10 semilandmarks − SM) on the dorsal side of the crayfish cephalon were digitised using software TpsDig2 (Rohlf, 2015) (Fig. 2). Position of LMs and SMs was modified according to Scalici et al. (2010) and Scalici and Bravi (2012). Semilandmarks were used to describe variation in the shape of rostrum apex and were treated as equivalent to landmarks when computing superimposition. They were defined as equally distant points between corresponding landmarks as described in Zelditch et al. (2004). Digitalisation of the LM and SM was made in the same order on each picture, after setting a scale factor. Each specimen was subjected to Generalized Procrustes Analysis (GPA), a procedure that separates the form of an organism into two components, centroid size and shape, by eliminating the non-shape variation resulting from positioning, orientation and scaling (Rohlf and Slice, 1990; Bookstein, 1991). Procrustes coordinates represent shape variables, while centroid size represents size variable independent of shape; it equals the square root of the sum of squared distances of each landmark from their centroid (Zelditch et al., 2004). The measurement error is important when analysing shape in GM, due to possible errors in the landmark and semilandmark digitisation (Klingenberg and McIntyre, 1998; Klingenberg et al., 2002). In order to evaluate the significance of measurement error, a sample of 50 randomly picked individuals was digitised twice by the same operator. Procrustes ANOVA was conducted to access the measurement error by comparing the mean square values of the individual variation with the mean square values of the digitised Error 1.
The patterns of shape variation among five A. torrentium phylogroups were examined by carrying out a canonical variate analysis (CVA). Since our aim was to analyse if stone crayfish from different phylogroups differ significantly in the shape, we chose performing CVA over PCA (principle component analysis). It is recommended to use PCA when variation among individuals is analysed, whereas CVA is suggested to be used for describing differences between groups (Zelditch et al., 2004). Variation and changes in shape described by CVA were graphically depicted in the form of wireframe to visualise the differentiation of the crayfish belonging to different phylogroups.
In order to establish correlation between TM and GM distances, Mantel test was conducted (Mantel, 1967) in XLSTAT ver. 2019, implemented in Excel, using 9999 permutations. For TM distance matrix, Euclidian distances for measured morphometric characteristics among phylogroups were calculated, while for GM distance matrix we used Procrustes distances among phylogroups.
A level of significance of 1% (P < 0.01) was used in all statistical analyses.
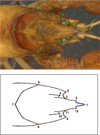 |
Fig. 2 Position of the landmarks and semilandmarks on the dorsal side of stone crayfish. Above − original scan with 12 landmarks (red dots) and 10 semilandmarks (blue lines); Under − drawing 12 landmarks (red dots) and 10 semilandmarks (blue dots) |
3 Results
3.1 Traditional morphometry
Traditional morphometry (TM) analyses included 245 crayfish from 15 populations assigned to five phylogroups, of which 89 were females and 156 males. Results of ANOVA displayed significant differences between phylogroups in the measured morphometric characteristics, for both males (F = 4.01; P < 0.01) and females (F = 3.35; P < 0.01) (details are not shown), therefore we proceeded with multivariate discriminant analysis. MDA revealed that morphometric characteristics with the highest discriminatory impact (highest loadings in discriminant functions) for males were those describing claws (CLL, CPL, CLH) and head region (ROW, CGW) (Tab. 2), while for females they included claws (CLL, CLH), head (ROL, HEL and APW) and abdomen (TEW, ABW and CEW) (Tab. 3). Stepwise analysis revealed high number of correctly classified males and females per phylogroups: 89.81% of males and 86.36% of females were classified correctly (Tab. 4).
Canonical variate analyses were performed on populations classified in five a priori defined phylogroups: LD, GK, ŽPB, BAN and CSE. Scatter plots for the discriminant functions (roots) are shown in Figure 3a (males) and b (females). The first discriminant function discriminated well males belonging to the phylogroups ŽPB and LD from males belonging to the phylogroups GK, CSE and BAN (Fig. 3a). The first discriminant function was marked with high negative loadings for CLL, CGW and ROW and with high positive loadings for CPL and APW, therefore the smaller the values of CLL and ROW, the more likely males belong to the phylogroups ŽPB or LD, and the higher the values of CPL and APW, the more likely males belong to the phylogroups GK, CSE and/or BAN. The second discriminant functions discriminated to some extant males from the phylogroups ŽPB and GK from the rest. Since second discriminant function was marked with high negative loadings for CLL and high positive loadings for CLH and APW, we may assume the smaller the values of CLL, the more likely males belong to the phylogroups ŽPB or GK, and the higher the values of CLH and APW, the more likely males belong to the phylogroups LD, CSE and/or BAN.
For females, the first discriminant function (root1) discriminated individuals belonging to the phylogroup LD and ŽPB from those belonging to GK, BAN and CSE (Fig. 3b). The first discriminant function was marked with high negative loadings for CLL and TEW or ARW and with high positive loadings for ROL and CPH. Accordingly, it can be presumed the smaller the values of CLL and TEW or ARW the more likely females belong to the phylogroups CSE, BAN and/or GK, and the higher the values of ROL and CPH, the more likely females belong to the phylogroups LD and/or ŽPB. The third discriminant function (root3) discriminated females belonging to phylogroups GK from the rest. Since the third discriminant function was marked with high negative loadings for TL and CLH and with high positive loadings for CLL and ABW, we may say the smaller the values of TL and CLH the less likely females belong to the phylogroup GK, while the higher the values of CLL and ABW the more likely females belong to the phylogroup GK.
Standardized canonical discriminant function coefficients for morphometric characteristics of A. torrentium males classified in five phylogroups (LD, GK, ŽPB, BAN and CSE) sensu Klobučar et al. (2013); for each discriminant function (root1-root4).
Standardized canonical discriminant function coefficients for morphometric characteristics of A. torrentium females classified in five phylogroups (LD, GK, ŽPB, BAN and CSE) sensu Klobučar et al. (2013); for each discriminant function (root1-root4).
Percentages of correctly classified individuals of A. torrentium based on the function of the corresponding discriminant analyses for males (% males) and females (% females); Lika and Dalmatia (LD), Gorski Kotar (GK), Žumberak, Plitvice and Bjelolasica (ŽPB), Banovina (BAN) and central and south-eastern Europe (CSE).
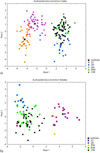 |
Fig. 3 Discrimination of the different phylogroups of a) males of A. torrentium by the two discriminant function (Root 1/Root 2) and b) females of A. torrentium by the first and third discriminant functions (Root 1/Root 3). Different colour dots represent different phylogroups: green dots − Banovina (BAN), black dots − central and south-eastern Europe (CSE), blue dots − Gorski Kotar (GK), purple dots − Lika and Dalmatia (LD), orange dots − Žumberak, Plitvice and Bjelolasica (ŽPB) |
3.2 Geometric morphometrics
Geometric morphometric analyses included 209 crayfish from 15 populations belonging to five previously described mtDNA phylogroups. Generalized Procrustes Analysis revealed the centroid size as size variables and Procrustes coordinates as shape variables. The Procrustes ANOVA was applied to assess the measurement error, and results showed that the mean square for individual variation exceeded the measurement error; therefore it was negligible (Tab. 5).
Results of CVA showed the differentiation among five A. torrentium phylogroups caused by the cephalon shape variation (Fig. 4). The first two canonical variates (CV1 and CV2) explained 71.41% of the total variation of the cephalon shape; CV1 accounted for 45.95% of the variability while the CV2 accounted for 25.46% of the variability. The CV1 and CV2 mostly separated phylogroups ŽPB, GK, LD, while there was an overlapping between the phylogroups BAN and CSE. The cephalon shape, as quantified by Procrustes distances, differed between the phylogroups (Tab. 6). The highest values of the Procrustes distances were obtained between the phylogroups ŽPB and BAN (0.0599), followed by ŽPB and CSE (0.0548), while the lowest values of Procrustes distances were observed between CSE and BAN (0.0210), and CSE and LD (0.0269). All Procrustes distances between the phylogroups were statistically significant with p-values lower than 0.01.
Morphological variability of cephalon was mainly visible in the anterior part, while the posterior area was less variable in the shape (Fig. 4). Shape changes that contribute to the distinction among crayfish from different phylogroups were visible in the apical part of the cephalon, particularly in the rostrum apex, rostrum base and width of the lateral edge of the head. Shape changes along +CV1 are characterised by general widening of the rostrum, shortening (LM 7) and narrowing (LM 6 and 8) of the head, shifting of the lateral edge of the head towards its apical part (LM 5 and 9), and elongation of the apex (SM 1-2 and 1-12). These characteristics were present in the majority of the specimens belonging to the phylogroup GK, CSE, BAN and partly ŽPB. In contrast, −CV1 was related to reduction of rostrum size and length, elongation (LM 7) and widening (LM 6 and 8) of the head, shifting of the lateral edge of the head towards its distal part (LM 5 and 9), and shortening of the apex (SM 1-2 and 1-12). These morphological characteristics were generally present in the phylogroup LD and partly in the phylogroup ŽPB. Shape changes along +CV2 were characterised by larger head, narrower elongated rostrum (LM 2-3 and 11-12 and SM 13-17 and 18-22), and longer apex (SM 1-2 and 1-12). Shape changes along −CV2 were characterised by wider and shorter rostrum (LM 2- 3 and 11-12; SM 13-17 and 18-22), less robust head and shorter apex (SM 1-2 and 1-12). These morphological characteristics were generally pronounced in the crayfish from the phylogroup ŽPB, GK and partly LD.
The Mantel test showed significant correlation between TM and GM distance matrices (r = 0.756, p = 0.007).
Measurement error assessed by performing Procrustes ANOVA on centroid size and shape of stone crayfish. Sums of squares (SS) and mean squares (MS) are in units of Procrustes distances.
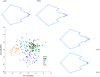 |
Fig. 4 Cephalon shape variation among the phylogroups of A. torrentium revealed by canonical variate analysis. Scatter plott of the two first canonical variate axes (CV1 and CV2) with associated wireframe representation depicting shape changes among phylogroups along positive and negative extremes of the axes. The light blue wireframes represent average cephalon shape, while the dark blue wireframes represent most extreme shape changes. Different colour dots represent different phylogroups: green dots − Banovina (BAN), black dots − central and south-eastern Europe (CSE), blue dots − Gorski Kotar (GK), purple dots − Lika and Dalmatia (LD), orange dots − Žumberak, Plitvice and Bjelolasica (ŽPB). |
Procrustes distances between the phylogroups of A. torrentium (above diagonal, bold) with p-values from permutation tests (10,000 permutation rounds) (below diagonal); Banovina (BAN), central and south-eastern Europe (CSE), Gorski Kotar (GK), Lika and Dalmatia (LD), Žumberak, Plitvice and Bjelolasica (ŽPB).
4 Discussion
This study aimed to determine morphological characteristics which separate stone crayfish belonging to different mtDNA phylogroups through analyses of traditional morphometric features, and for this species for the first time through geometric morphometric approach. Also, the goal was to verify if the two methods yield congruent results, and if results of morphometry are consistent with the results obtained in previous molecular research (Klobučar et al., 2013). Overall, results of morphometry were in agreement with results obtained in previous molecular research (Klobučar et al., 2013) and established significant differences in morphology among stone crayfish from different phylogroups, with characteristics of cephalon (both TM and GM) and claws (TM) contributed the most to their divergence.
Majority of recent studies on the freshwater crayfish morphological variability were based on the statistical analyses of morphometric characteristics using traditional morphometrics. Analyses of large number of morphological characteristics per specimen, in combination with multivariate statistical analyses, enabled the identification of statistically significant differences between populations of the same species, e.g. A. pallipes (Ghia et al., 2006; Bertocchi et al., 2008), A. leptodactylus (Deniz et al., 2010; Maguire and Dakić, 2011; Benzer et al., 2017), A. torrentium (Sint et al., 2006; Maguire et al., 2017), A. astacus (Đuretanović et al., 2017) as well as between different crayfish species (Sint et al., 2006, 2007; Larson et al., 2012).
Application of geometric morphometric approach in freshwater crayfish studies was not frequently used (Scalici et al., 2010; Scalici and Bravi, 2012; Helms et al., 2015; Malavé et al., 2018).
Various studies on the crustaceans showed that this group of animals displays great morphological diversity and plasticity (Wills, 1998; García-Dávila et al., 2006; Oda et al., 2007; Stillman et al., 2008; Tanaka, 2009; Zimmermann et al., 2011; Yampolsky et al., 2014). The variations in their phenotype could be a consequence of adaptation to the environment (Zimmermann et al., 2011; Yampolsky et al., 2014) or genetic factors (Atashbar et al., 2016; Hidayani et al., 2018). Likewise, freshwater crayfish exhibit intraspecific morphometric variation that reflects environmental influence (Sint et al., 2005, 2006; Ghia et al., 2006; Haddaway et al., 2012; Perry et al., 2013; Rudolph et al., 2016) or genetic background (Sint et al., 2007; Cataudella et al., 2010; Maguire et al., 2017; Pârvulescu, 2019) or probably combination of both (Baric et al., 2005a, 2005b; Bertocchi et al. et al., 2008; Mathews et al., 2008; Helms et al., 2015; Berger et al., 2017).
Former molecular phylogenetic and phylogeographic research of the stone crayfish based on the mtDNA revealed existence of at least seven (Klobučar et al., 2013) or eight (Pârvulescu et al., 2019) highly divergent monophyletic phylogroups within A. torrentium, with the highest genetic diversity recorded in the north-central Dinarids in Croatia. Especially high distances were obtained for phylogroups ZV, GK, ŽPB and LD. Since at that time there was no sufficiently stable diagnostic feature that would reliable distinguish crayfish from different phylogroups, it was suggested that they represent cryptic species (Klobučar et al., 2013). Resolving status of cryptic species is a challenge that requires, beside molecular techniques, morphological approach (Mound et al., 2010; Larson et al., 2012; Singhal et al., 2018). In a small scale preliminary morphometric study of A. torrentium populations originating from three phylogroups (ZV, GK and ŽPB) Maguire et al. (2017) revealed the characteristics that clearly separate crayfish in a similar way as molecular methods. Current study included larger number of populations per phylogroup, and it covered five out of seven (eight) phylogroups.
Analyses of variance for both sexes displayed significant differences in morphometric characteristics among crayfish belonging to different phylogroups what is in accordance with previous research by Maguire et al. (2017). Similarly to results of previous studies (Sint et al., 2005, 2007; Maguire et al., 2017; Mijošek et al., 2017), males differ in more TM characteristics than females. Multivariate discriminant analyses, for both sexes, distinguished characteristics describing claws, head and rostrum (Tabs. 3 and 4) as characteristic that separate populations/phylogroups the best what confirmed results of previous study (Maguire et al., 2017). Percentage of correctly classified female and male stone crayfish per phylogroup was relatively high (from 50 to 100%; Tab. 4) and similar to values obtained in other studies (Sint et al., 2007; Maguire et al., 2017). Misclassification of some of individuals could have been a consequence of paucity of samples caused by limited sampling in certain areas (e.g. males in BAN and females in ŽPB) (Larson et al., 2012). Scatterplots of canonical analyses, for both sexes, displayed relatively well separation of individuals from different phylogroups (Fig. 3a and b), what is concordant with previous findings (Maguire et al., 2017). Differentiation between individuals from different phylogroups by CVA and high values of correctly classified males and females per phylogroup indicated clear morphological differentiation of phylogroups and supported the use of traditional morphometrics in phylogroups delimitation.
Geometric morphometrics analyses were applied previously on A. torrentium's sister species A. pallipes in order to study allometry during ontogenesis (Scalici and Gibertini, 2009; Scalici et al., 2010) and systematic relations of A. pallipes species complex (Scalici and Bravi, 2012). In the present study, significant variation in cephalon shape of A. torrentium was observed by GM, and successful intraspecific delimitation, based on morphological variation, was obtained (Fig. 4). Each of the five phylogroups showed a significantly different cephalon shape. The variation was noticeable on the anterior part of the crayfish body, especially rostrum, while the posterior part of the head was less variable in shape, what is consistent with the findings by Bertocchi et al. (2008); Larson et al. (2012) or Rudolph et al. (2016). Results of CVA showed clear separation of phylogroups ŽPB, GK and LD, while there was an overlapping between the phylogroups BAN and CSE. Geometric morphometrics, as a new approach in the research of the stone crayfish morphological features, demonstrate itself as an improvement and complement to TM studies as well as useful in the future population genetics and ecological research of the stone crayfish phylogroups.
Results of both TM and GM canonical discriminant analyses showed congruent topologies: separation among phylogroups, with exception of an overlap of the crayfish from the phylogroups BAN and CSE, which coincides with the results of molecular phylogenetic research of stone crayfish (Klobučar et al., 2013). Further, the results of Mantel test established significant correlation between distances obtained by the two approaches. Correlations between TM and GM were already recorded for different organisms (e.g. crustaceans (Malavé et al., 2018; de Melo and Masunari, 2017), honeybees (Tofilski, 2008), cichlids (Parsons et al., 2003), oaks (Viscosi et al., 2009)).
Overall, our results confirmed traditional and geometric morphometrics as useful tools for identification and delimitation of stone crayfish phylogroups and highlighted the urgent need for taxonomic revision of stone crayfish phylogroups status. At the same time, obtained results draw attention to the importance of thorough knowledge about species, including genetics, morphology and ecology, that are necessary for development of proper conservation plans. Application of scientifically based results in conservation measures could help preservation of evolutionary potential and heritage, as well as enable insight into historical biogeography of the species.
Acknowledgements
Authors would like to thank Matej Vucić and Andrea Rezić for their suggestions and help, and to Adam P. Maguire for the language editing. This research was funded by the Croatian Science Foundation (CLINEinBIOta − IP-2016-06-2563) and Leona Lovrenčić through ESF (DOK-2018-01-9589). The authors declare that they have no conflict of interest. All applicable international, national, and/or institutional guidelines for the care and use of animals were followed. All procedures performed in this study were in accordance with the ethical standards of the institution and all required permissions were obtained from Ministry of Environmental Protection and Energy of the Republic of Croatia (UP/I-612-07/18-48/148).
References
- Atashbar B, Agh N, Manaffar R, Van Stappen G. 2016. Morphometric and preliminary genetic characteristics of Branchinecta orientalis populations from Iran (Crustacea: Anostraca). Zootaxa 4109: 31–45. [CrossRef] [PubMed] [Google Scholar]
- Baric S, Höllrigl A, Füreder L, Dalla Via J. 2005a. Mitochondrial and microsatellite DNA analyses of Austropotamobius pallipes populations in South Tyrol (Italy) and Tyrol (Austria). Bull Fr Pêche Piscic 376–377: 599–612. [CrossRef] [Google Scholar]
- Baric S, Höllrigl A, Petutschnig J, Kerschbamer C, Dalla Via J. 2005b. Update of the molecular phylogeny of the Austropotamobius pallipes species complex by including specimens from South Tyrol (Italy) and Carinthia (Austria). Bull Fr Pêche Piscic 376–377: 627–636. [CrossRef] [Google Scholar]
- Becking LE, de Leeuw CA, Knegt B, Maas DL, de Voogd NJ, Abdunnur Suyatna IPK. 2016. Highly divergent mussel lineages in isolated Indonesian marine lakes. PeerJ 4: DOI 10.7717/peerj.2496. [Google Scholar]
- Benzer SS, Benzer R, Gunal C. 2017. Artificial neural networks approach in morphometric analysis of crayfish (Astacus leptodactylus) in Hirfanlı Dam Lake. Biologia 72: 527–535. [Google Scholar]
- Berger C, Štambuk A, Maguire I, Weiss S, Füreder L. 2017. Integrating genetics and morphometrics in species conservation − a case study on the stone crayfish, Austropotamobius torrentium . Limnologica 69: 28–38. [Google Scholar]
- Bertocchi S, Brusconi S, Gherardi F, Buccianti A, Scalici M. 2008. Morphometrical characterization of the Austropotamobius pallipes species complex. J Nat Hist 42: 2063–2077. [Google Scholar]
- Bookstein FL. 1991. Morphometric Tools for Landmark Data: Geometry and Biology. Cambridge: Cambridge University Press, 456 p. [Google Scholar]
- Cardini A, Jansson A-U, Elton S. 2007. A geometric morphometric approach to the study of ecogeographical and clinal variation in vervet monkeys. J Biogeogr 34: 1663–1678. [Google Scholar]
- Caumul R, Polly PD. 2005. Phylogenetic and environmental components of morphological variation: skull, mandible, and molar shape in marmots (Marmota, Rodentia). Evolution 59: 2460–2472. [PubMed] [Google Scholar]
- Cataudella R, Paolucci M, Delaunay C, Ropiquet A. 2010. Genetic variability of Austropotamobius italicus in the Marches region: Implications for conservation. Aquat Conserv Mar Freshw Ecosyst 2: 261–268. [CrossRef] [Google Scholar]
- Chambers CL, Payne JF, Kennedy ML. 1979. Geographic variation in the Dwarf Crayfish, Cambarellus puer Hobbs (Decapoda, Cambaridae). Crustaceana 36: 39–55. [Google Scholar]
- de Melo MS, Masunari S. 2017. Sexual dimorphism in the carapace shape and length of the freshwater palaemonid shrimp Macrobrachium potiuna (Müller, 1880) (Decapoda: Caridea: Palaemonidae): geometric and traditional morphometric approaches. Anim Biol 67: 93–103. [CrossRef] [Google Scholar]
- Deniz (Bök) TD, Harlıoğlu MM, Deval MC. 2010. A study on the morphometric characteristics of Astacus leptodactylus inhabiting the Thrace region of Turkey. Knowl Manag Aquat Ecosyst 397: 05. [CrossRef] [Google Scholar]
- Đuretanović S, Jaklič M, Milošković A, Radajković N, Radenković, Simić V, Magure I. 2017. Morphometric variations among Astacus astacus populations from different regions of the Balkan Peninsula. Zoomorphology 136: 19–27. [Google Scholar]
- García-Dávila CR, Magalhães C, Guerrero JCH. 2006. Morphometric variability in populations of Palaemonetes spp. (Crustacea, Decapoda, Palaemonidae) from the Peruvian and Brazilian Amazon Basin. Iheringia Série Zool 95: 327–334. [CrossRef] [Google Scholar]
- Ghia D, Nardi PA, Negri A, et al. 2006. Syntopy of A. pallipes and A. italicus: genetic and morphometrical investigation. Bull Fr Pêche Piscic 380–381: 1001–1018. [CrossRef] [Google Scholar]
- Grandjean F, Romain D, Avila-Zarza C, Bramard M, Souty-Grosset C, Mocquard JP. 1997. Morphometry, sexual dimorphism and size at maturity of the white-clawed crayfish Austropotamobius pallipes pallipes (Lereboullet) from a wild French population at Deux-Sèvres (Decapoda, Astacidea). Crustaceana 70: 31–44. [Google Scholar]
- Haddaway NR, Mortimer RJG, Christmas M, Grahame JW, Dunn AM. 2012. Morphological diversity and phenotypic plasticity in the threatened British white-clawed crayfish (Austropotamobius pallipes). Aquat conserv 22: 220–231. [Google Scholar]
- Helms BS, Vaught RC, Suciu SK, Santos SR. 2015. Cryptic diversity within two endemic crayfish species of the Southeastern US revealed by molecular genetics and geometric morphometrics. Hydrobiologia 755: 283–298. [Google Scholar]
- Hidayani AA, Trijuno DD, Fujaya Y, Tauhid Umar M. 2018. The morphology and morphometric characteristics of the male swimming crab (Portunus pelagicus) from the East Sahul Shelf, Indonesia. Aquac Aquar Conserv Legis 11: 1724–1736. [Google Scholar]
- Huber MGJ, Schubart CD. 2005. Distribution and reproductive biology of Austropotamobius torrentium in Bavaria and documentation of a contact zone with the alien crayfish Pacifastacus leniusculus . Bull Fr Pêche Piscic 376–377: 759–776. [CrossRef] [Google Scholar]
- Klingenberg CP, McIntyre GS. 1998. Geometric morphometrics of developmental instability: analyzing patterns of fluctuating asymmetry with procrustes methods. Evolution 52: 1363–1375. [PubMed] [Google Scholar]
- Klingenberg CP, Barluenga M, Meyer A. 2002. Shape analysis of symmetric structures: quantifying variation among individuals and asymmetry. Evolution 56: 1909–1920. [PubMed] [Google Scholar]
- Klingenberg CP. 2011. MorphoJ: an integrated software package for geometric morphometrics. Mol Ecol Resour 11: 353–357. [Google Scholar]
- Klobučar GIV, Podnar M, Jelić M, et al. 2013. Role of the Dinaric Karst (western Balkans) in shaping the phylogeographic structure of the threatened crayfish Austropotamobius torrentium . Freshwater Biol 58: 1089–1105. [CrossRef] [Google Scholar]
- Kouba A, Petrusek A, Kozák P. 2014. Continental-wide distribution of crayfish species in Europe: update and maps. Knowl Manag Aquat Ecosyst 413: 1–31. [Google Scholar]
- Larson ER, Abbott CL, Usio N, et al. 2012. The signal crayfish is not a single species: Cryptic diversity and invasions in the Pacific Northwest range of Pacifastacus leniusculus . Freshw Biol 57: 1823–1838. [Google Scholar]
- Lawing AM, Polly PD. 2010. Geometric morphometrics: recent applications to the study of evolution and development. J Zool 280: 1–7. [Google Scholar]
- Maguire I, Erben R, Klobučar GIV, Lajtner J. 2002. Year cycle of Austropotamobius torrentium (Schrank) in streams on Medvednica mountain (Croatia). Bull Fr Pêche Piscic 367: 943–957. [CrossRef] [Google Scholar]
- Maguire I, Dakić L. 2011. Comparative analyses of Astacus leptodactylus morphological characteristics from Croatia and Armenia. Biologia 66: 491–498. [Google Scholar]
- Maguire I, Jelić M, Klobučar G. 2011. Update on the distribution of freshwater crayfish in Croatia. Knowl Manag Aquat Ecosyst 401: 31–41. [Google Scholar]
- Maguire I, Klobučar G. 2011. Size structure, maturity size, growth and condition index of stone crayfish (Austropotamobius torrentium) in North-West Croatia. Knowl Manag Aquat Ecosyst 401: 12. [CrossRef] [Google Scholar]
- Maguire I, Marn N, Klobučar G. 2017. Morphological evidence for hidden diversity in the threatened stone crayfish Austropotamobius torrentium (Schrank, 1803) (Decapoda: Astacoidea: Astacidae) in Croatia. J Crustac Biol 37: 7–15. [CrossRef] [Google Scholar]
- Maguire I, Klobučar G, Žganec K, Jelić M, Lucić A, Hudina S. 2018. Recent changes in distribution pattern of freshwater crayfish in Croatia − threats and perspectives. Knowl Manag Aquat Ecosyst 419: 1–12. [Google Scholar]
- Malavé BM, Styga JM, Clotfelter ED. 2018. Size, shape, and sex-dependent variation in force production by crayfish chelae. J Morphol 279: 312–318. [CrossRef] [PubMed] [Google Scholar]
- Mantel N. 1967. The detection of disease clustering and a generalized regression approach. Cancer Res 27: 209–220. [Google Scholar]
- Mathews LM, Adams L, Anderson E, Basile M, Gottardi E, Buckholt MA. 2008. Genetic and morphological evidence for substantial hidden biodiversity in a freshwater crayfish species complex. Mol Phylogenet Evol 48: 126–135. [Google Scholar]
- Mijošek T, Jelić M, Mijošek V, Maguire I. 2017. Molecular and morphometric characterisation of the invasive signal crayfish populations in Croatia. Limnologica 63: 107–118. [Google Scholar]
- Mound LA, Wheeler GS, Williams DA. 2010. Resolving cryptic species with morphology and DNA; thrips as a potential biocontrol agent of Brazilian peppertree, with a new species and overview of Pseudophilothrips (Thysanoptera). Zootaxa 2432: 59–68. [Google Scholar]
- Oda S, Hanazato T, Fujii K. 2007. Change in phenotypic plasticity of a morphological defence in Daphnia galeata (Crustacea: Cladocera) in a selection experiment. J Limnol 66: 142–152. [Google Scholar]
- Palma J, Andrade JP. 2002. Morphological study of Diplodus sargus, Diplodus puntazzo, and Lithognathus mormyrus (Sparidae) in the Eastern Atlantic and Mediterranean Sea. Fish Res 57: 1–8. [Google Scholar]
- Parsons KJ, Beren W, Robinson TH. 2003. Getting into Shape: An Empirical Comparison of Traditional Truss-Based Morphometric Methods with a Newer Geometric Method Applied to New World Cichlids. Environ Biol Fish 67: 417–431. [CrossRef] [Google Scholar]
- Pârvulescu L, Pérez-Moreno JL, Panaiotu C, et al. 2019. A journey on plate tectonics sheds light on European crayfish phylogeography. Ecol Evol 9: 1957–1971. [Google Scholar]
- Pârvulescu L. 2019. Introducing a new Austropotamobius crayfish species (Crustacea, Decapoda, Astacidae): A Miocene endemism of the Apuseni Mountains, Romania. Zool Anz 279: 94–102. [Google Scholar]
- Peay S. 2009. Invasive non-indigenous crayfish species in Europe: Recommendations on managing them. Knowl Managt Aquatic Ecosyst 394−395: 03. [CrossRef] [EDP Sciences] [Google Scholar]
- Perry WL, Jacks AM, Fiorenza D, Young M, Kuhnke R. 2013. Effects of water velocity on the size and shape of rusty crayfish, Orconectes rusticus . Freshw Sci 32: 1398–1409. [Google Scholar]
- Rohlf FJ, Slice D. 1990. Extensions of the Procrustes Method for the Optimal Superimposition of Landmarks. Syst Zool 39: 40–59. [Google Scholar]
- Rohlf FJ. 2015. The tps series of software. Hystrix 26: 1–4. [Google Scholar]
- Rudolph E, Colihueque N, Yañez M. 2016. Morphological and genetic analysis in morphologically divergent river and lake specimens of the freshwater crayfish Samastacus spinifrons (Philippi, 1882) (Decapoda, Parastacidae). Crustaceana 89: 877–899. [Google Scholar]
- Scalici M, Gibertini G. 2009. Sexual dimorphism and ontogenetic variation in the carapace of A. pallipes (Lereboullet, 1858). Ital J Zool 76: 179–188. [CrossRef] [Google Scholar]
- Scalici M, Macale D, Gibertini G. 2010. Allometry in the ontogenesis of Austropotamobius pallipes species complex (Decapoda: Astacidae): The use of geometric morphometrics. Ital J Zool 77: 296–302. [CrossRef] [Google Scholar]
- Scalici M, Bravi R. 2012. Solving alpha-diversity by morphological markers contributes to arranging the systematic status of a crayfish species complex (Crustacea, Decapoda). J Zool Syst Evol Res 50: 89–98. [Google Scholar]
- Singhal S, Hoskin CJ, Couper P, Potter S, Moritz C. 2018. A Framework for Resolving Cryptic Species: A Case Study from the Lizards of the Australian Wet Tropics. Syst Biol 67: 1061–1075. [CrossRef] [PubMed] [Google Scholar]
- Sint D, Dalla Via J, Füreder L. 2005. Morphological variations in Astacus astacus L. and Austropotamobius pallipes (Lereboullet) populations. Bull Fr Pêche Piscic 376–377: 637–652. [CrossRef] [Google Scholar]
- Sint D, Dalla Via J, Füreder L. 2006. The genus Austropotamobius in the Ausserfern Region (Tyrol, Austria) with an overlap in the distribution of A. torrentium and A. pallipes populations. Bull Fr Pêche Piscic 380–381: 1029–1040. [CrossRef] [Google Scholar]
- Sint D, Dalla Via J, Füreder L. 2007. Phenotypical characterization of indigenous freshwater crayfish populations. J Zool 273: 210–219. [Google Scholar]
- Souty-Grosset C, Reynolds JD. 2009. Current ideas on methodological approaches in European crayfish conservation and restocking procedures. Knowl Manag Aquat Ecosyst 394–395: 01. [CrossRef] [Google Scholar]
- Stillman JH, Colbourne JK, Lee CE, et al. 2008. Recent advances in crustacean genomics. Integr Comp Biol 48: 852–868. [CrossRef] [PubMed] [Google Scholar]
- Streissl F, Hödl W. 2002. Growth, morphometrics, size at maturity, sexual dimorphism and condition index of Austropotamobius torrentium Schrank. Hydrobiologia 477: 201–208. [Google Scholar]
- Tanaka G. 2009. Adaptive modifications of carapace outlines in the Cytheroidea (Ostracoda: Crustacea). Biol J Linn Soc 97: 810–821. [CrossRef] [Google Scholar]
- Tofilski A. 2008. Using geometric morphometrics and standard morphometry to discriminate three honeybee subspecies. Apidologie 39: 558–563. [CrossRef] [EDP Sciences] [Google Scholar]
- Trontelj P, Machino Y, Sket B. 2005. Phylogenetic and phylogeographic relationships in the crayfish genus Austropotamobius inferred from mitochondrial COI gene sequences. Mol Phylogenet Evol 34: 212–226. [Google Scholar]
- Viscosi V, Lepais O, Gerber S, Fortini P. 2009. Leaf morphological analyses in four European oak species (Quercus) and their hybrids: A comparison of traditional and geometric morphometric methods. Plant Biosyst 143: 564–574. [Google Scholar]
- Vlach P, Valdmanová L. 2015. Morphometry of the stone crayfish (Austropotamobius torrentium) in the Czech Republic: allometry and sexual dimorphism. Knowl Manag Aquat Ecosyst. 416: 16. [CrossRef] [EDP Sciences] [Google Scholar]
- Weinländer M, Füreder L. 2009. The continuing spread of Pacifastacus leniusculus in Carinthia (Austria). Knowl Manag Aquat Ecosyst 394–395: 17. [CrossRef] [Google Scholar]
- Wills MA. 1998. A phylogeny of recent and fossil Crustacea derived from morphological characters. In Fortey A, Thomas RH, eds. Arthropod Relationships. Dordrecht: Springer, 189–209. [CrossRef] [Google Scholar]
- Yampolsky LY, Schaer TMM, Ebert D. 2014. Adaptive phenotypic plasticity and local adaptation for temperature tolerance in freshwater zooplankton. Proc Biol Sci 81: 20132744. [Google Scholar]
- Zelditch ML, Swiderski DL, Sheets HD, Fink WL. 2004. Geometric morphometrics for biologists: a primer. San Diego: Elsevier Academic Press, 443. [Google Scholar]
- Zimmermann G, Bosc P, Valade P, Cornette R, Ameziane N, Debat V. 2011. Geometric morphometrics of carapace of Macrobrachium australe (Crustacea: Palaemonidae) from Reunion Island. Acta Zool 93: 492–500. [Google Scholar]
Cite this article as: Lovrenčić L, Pavić V, Majnarić S, Abramović L, Jelić M, Maguire I. 2020. Morphological diversity of the stone crayfish − traditional and geometric morphometric approach. Knowl. Manag. Aquat. Ecosyst., 421, 1.
All Tables
List of samples; mtDNA phylogroups sensu Klobučar et al. (2013); (Banovina (BAN), Lika and Dalmatia (LD), Gorski Kotar (GK), Žumberak, Plitvice and Bjelolasica (ŽPB), and central and south-eastern Europe (CSE)) with sampled localities (streams) and number of stone crayfish per group (total, and number of males and females).
Standardized canonical discriminant function coefficients for morphometric characteristics of A. torrentium males classified in five phylogroups (LD, GK, ŽPB, BAN and CSE) sensu Klobučar et al. (2013); for each discriminant function (root1-root4).
Standardized canonical discriminant function coefficients for morphometric characteristics of A. torrentium females classified in five phylogroups (LD, GK, ŽPB, BAN and CSE) sensu Klobučar et al. (2013); for each discriminant function (root1-root4).
Percentages of correctly classified individuals of A. torrentium based on the function of the corresponding discriminant analyses for males (% males) and females (% females); Lika and Dalmatia (LD), Gorski Kotar (GK), Žumberak, Plitvice and Bjelolasica (ŽPB), Banovina (BAN) and central and south-eastern Europe (CSE).
Measurement error assessed by performing Procrustes ANOVA on centroid size and shape of stone crayfish. Sums of squares (SS) and mean squares (MS) are in units of Procrustes distances.
Procrustes distances between the phylogroups of A. torrentium (above diagonal, bold) with p-values from permutation tests (10,000 permutation rounds) (below diagonal); Banovina (BAN), central and south-eastern Europe (CSE), Gorski Kotar (GK), Lika and Dalmatia (LD), Žumberak, Plitvice and Bjelolasica (ŽPB).
All Figures
|
Fig. 1 Map of the study area with sampling sites produced in ArcGIS 10.3 program package. Different colours represent different phylogroups sensu Klobučar et al. (2013); ŽPB − Žumberak, Plitvice and Bjelolasica; LD − Lika and Dalmacija; GK − Gorski Kotar; CSE − Central and south-eastern Europe; BAN − Banovina |
| In the text | |
|
Fig. 2 Position of the landmarks and semilandmarks on the dorsal side of stone crayfish. Above − original scan with 12 landmarks (red dots) and 10 semilandmarks (blue lines); Under − drawing 12 landmarks (red dots) and 10 semilandmarks (blue dots) |
| In the text | |
|
Fig. 3 Discrimination of the different phylogroups of a) males of A. torrentium by the two discriminant function (Root 1/Root 2) and b) females of A. torrentium by the first and third discriminant functions (Root 1/Root 3). Different colour dots represent different phylogroups: green dots − Banovina (BAN), black dots − central and south-eastern Europe (CSE), blue dots − Gorski Kotar (GK), purple dots − Lika and Dalmatia (LD), orange dots − Žumberak, Plitvice and Bjelolasica (ŽPB) |
| In the text | |
|
Fig. 4 Cephalon shape variation among the phylogroups of A. torrentium revealed by canonical variate analysis. Scatter plott of the two first canonical variate axes (CV1 and CV2) with associated wireframe representation depicting shape changes among phylogroups along positive and negative extremes of the axes. The light blue wireframes represent average cephalon shape, while the dark blue wireframes represent most extreme shape changes. Different colour dots represent different phylogroups: green dots − Banovina (BAN), black dots − central and south-eastern Europe (CSE), blue dots − Gorski Kotar (GK), purple dots − Lika and Dalmatia (LD), orange dots − Žumberak, Plitvice and Bjelolasica (ŽPB). |
| In the text | |
Current usage metrics show cumulative count of Article Views (full-text article views including HTML views, PDF and ePub downloads, according to the available data) and Abstracts Views on Vision4Press platform.
Data correspond to usage on the plateform after 2015. The current usage metrics is available 48-96 hours after online publication and is updated daily on week days.
Initial download of the metrics may take a while.