| Issue |
Knowl. Manag. Aquat. Ecosyst.
Number 419, 2018
|
|
|---|---|---|
| Article Number | 19 | |
| Number of page(s) | 11 | |
| DOI | https://doi.org/10.1051/kmae/2018010 | |
| Published online | 27 March 2018 | |
Research Paper
Shaping of macroinvertebrate structures in a small fishless lowland stream exposed to anthropopressure, including the environmental conditions
Variations des structures des macroinvertébrés dans un petit cours d'eau de plaine sans poissons exposé à la pression anthropique influant les conditions environnementales
General Zoology Department, Faculty of Biology, University of Szczecin,
Felczaka 3c street,
71-412
Szczecin, Poland
* Corresponding author: This email address is being protected from spambots. You need JavaScript enabled to view it.
Abstract
In studies of abiotic and biotic factors influencing macroinvertebrate assemblages, there is always the problem of which factor – fish predation or environmental conditions – has the strongest impact on the invertebrates and whether the impact is positive or negative. The aim of our study was to determine the impact on the structures of macrozoobenthos in a small field watercourse exerted by abiotic conditions, with the concurrent lack of predators and varied intensity of anthropopressure. During the entire study period, the presence of 49 taxa of macroinvertebrates was recorded. The highest number of taxa and value of biodiversity was observed in the upper part of the watercourse, and subsequently decreased down the stream, reaching the lowest value at the sites located near the outlet. The tributaries significantly differed between each other in the number of taxa. In the tributary carrying water from wetland, a much higher number of taxa was noted than in the tributary carrying municipal water where the density achieved a significantly higher value of individuals than the remaining sites. The most limiting factors for the abundance of the investigated taxa were the oxygen concentration, nutrients and ammonia.
Résumé
Dans les études sur les facteurs abiotiques et biotiques qui influencent les assemblages de macroinvertébrés, il y a toujours le problème de savoir quel facteur − prédation des poissons ou conditions environnementales − a l'impact le plus fort sur les invertébrés et si l'impact est positif ou négatif. Le but de notre étude était de déterminer l'impact, sur les structures du macrozoobenthos dans un petit cours d'eau de plaine, des conditions abiotiques, avec absence concomitante de prédateurs, et l'intensité variable de la pression anthropique. Pendant toute la période d'étude, la présence de 49 taxons de macroinvertébrés a été observée. Le nombre le plus élevé de taxons et la valeur de la biodiversité la plus élevée ont été observés dans la partie supérieure du cours d'eau et ont ensuite diminué le long du cours d'eau, pour atteindre la valeur la plus faible aux sites situés près de l'exutoire. Les affluents différaient considérablement les uns des autres quant au nombre de taxons. Dans l'affluent transportant l'eau d'une zone humide, on a observé un nombre beaucoup plus élevé de taxons que dans l'affluent transportant de l'eau domestique, où la densité a atteint une valeur significativement plus élevée d'individus que dans les autres sites. Les facteurs les plus limitants de l'abondance des taxons étudiés étaient la concentration d'oxygène, les nutriments et l'ammoniac.
Key words: Macroinvertebrates / small streams / environmental conditions / anthropopressure
Mots clés : Macroinvertébré / petits cours d'eau / conditions environnementales / pression anthropique
© T. Krepski and R. Czerniawski, Published by EDP Sciences 2018
 This is an Open Access article distributed under the terms of the Creative Commons Attribution License CC-BY-ND (http://creativecommons.org/licenses/by-nd/4.0/), which permits unrestricted use, distribution, and reproduction in any medium, provided the original work is properly cited. If you remix, transform, or build upon the material, you may not distribute the modified material.
1 Introduction
Small field watercourses are a common component of the landscape of Central and Eastern Europe. These watercourses flow into larger rivers or lakes, often affecting the abiotic and biotic conditions in their recipient water bodies (Wohl, 2017). Small watercourses are a unique type of environment, completely different from that found in other parts of the catchment area (Wohl, 2017). They can constitute sites of permanent existence of resident fauna, or be a transitional shelter for migratory fauna (Williams et al., 2003; Wohl, 2017). They can also constitute a refuge for fauna colonizing lower parts of the catchment area, currently often subject to maintenance activities. Small watercourses are a difficult research subject, as they are under strong influence of local factors disrupting their functioning, such as convective storms, fires or landslides (Wohl, 2017).
Depending on whether the investigated watercourse is a natural stream or a drainage ditch, its impact on the recipient water body can be different. Drainage ditches, due to their anthropogenic nature, are obviously a more frequent research subject than small streams (Verdonschot et al., 2011; Leslie et al., 2012; Verdonschot and Verdonschot, 2014; Whatley et al., 2014; Leslie and Lamp, 2017). Small watercourses, natural and artificial, present significant differences. Simon and Travis (2011) reported that water in streams affected by drainage ditches, as well as drainage ditches themselves, have a higher biodiversity than natural streams, although no significant taxonomic differences between the two environments have been demonstrated. However, Williams et al. (2003) in drainage ditches recorded the lowest diversity of all investigated environments, including small streams. As can be noted, the evolution of benthic structures in small streams depends on the local environmental conditions.
Relatively many studies are also conducted in larger rivers (Brabender et al., 2016; Rico et al., 2016; Leitner et al., 2017). Among studies of macroinvertebrates in small streams, the most common topic has been the impact of environmental factors on the benthic structure (Souto et al., 2011; Zhang et al., 2014; Kakouei et al., 2017), as well the top-down and bottom-up relationships (Nyström et al., 2003).
In small watercourses, in which predatory fish that effectively restrict the components of macrozoobenthos are present, it is difficult to determine the exact effect exerted on the investigated organisms by environmental conditions. For example, Choe et al. (2014) showed that in the examined regulated watercourse, predatory fish can be the main limiting factor for certain groups of invertebrates. On the other hand, Nicola et al. (2010) found that the structures of benthic macroinvertebrates are shaped primarily by water chemism, rather than by the presence of predatory fish. The aim of our study was to determine the impact on the structures of macrozoobenthos in a small field watercourse exerted by abiotic conditions, with the concurrent lack of fish and varied intensity of anthropopressure.
2 Material and methods
2.1 Area of study
The study was conducted in a small watercourse subjected to a strong anthropopressure (NW Poland, GPS coordinates: N 53° 13′ 15″, E 15° 45′ 50″). The length of the watercourse is approx. 1 km. The waters of the catchment area are wetlands on the right bank, and fields and meadows on the left bank. The investigated watercourse flows into Lake Grażyna (area around the Drawa National Park), through which the river Drawa flows. In order to conduct the study, six sites located in the main watercourse were established (following the direction of the water flow, within an average distance of approx. 0.2 km from each other) and one in each tributary (Fig. 1). The left tributary (LT) originated from the nearby wetland of approx. 20 m2, while the right tributary (RT) was a wastewater discharge. Below the mouth of the watercourse into the lake, a net with a mesh of 2.0 mm was installed, spanning from the bottom to 0.5 m above the water surface. The grid was cleaned every day. In April and July, an attempt of a catch was conducted in the watercourse using a generator (Hans Grassl ELT60 II, Germany). Fish were not found in either of the two months.
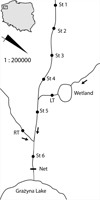 |
Fig. 1 Study area. |
2.2 Sampling methods
Samples were taken from all sites, every month from March to October of 2009 and 2010. The samples were collected using a dragnet of 0.20 × 0.35 m, scraping off a fragment of the bottom of 1 m in length. Measurements of temperature, pH and conductivity of water, as well as oxygen concentration were conducted using a CX-401 versatile device by Elmetron (Poland). The content of N–NO2, N–NO3, N–NH3 and NTOT, PO4 and PTOT was measured using a DR-850 colorimeter manufactured by Hach Lange (USA). At each site in the watercourse, water current velocity was measured using an OTT electromagnetic water flow sensor (Germany). To calculate flow, the width and depth of the watercourse were additionally measured. The percentage of bottom coverage by macrophytes was determined visually.
2.3 Statistical analysis
Biodiversity of macroinvertebrates at the investigated sites was determined using the Shannon–Weaver index. The identified taxa were grouped into classes of dominance following Biesiadka and Kowalik (1980), where: Eudominants: abundance >10%; dominants: 5.01–10%, subdominants: 2.01–5%; recedents: <2%. In order to demonstrate taxonomic similarity between sites, the Jaccard index was used.
In order to determine statistically significant differences in the mean abundance of taxa, overall abundance, biodiversity and number of taxa, the Scheffe post-hoc test was used (Statistica 12).
In order to determine the influence of the abiotic and biotic variables of the stream on the abundance of macroinvertebrates, taxa that reached a frequency of 50% and higher, and simultaneously a dominance ratio of 2% and higher, were taken into account. To conduct calculations, The Canonical Correspondence Analysis (CCA) with the forward selection procedure of variables by permutation test (ANOVA) was used. Vegan 1.15.1 software was used to perform CCA analyses.
3 Results
3.1 Environmental factors
The largest change in the morphology of the watercourse was observed in width, which varied from less than 1 m (the source section) to over 3.5 m (the lower section). Both tributaries were morphologically similar. There were also differences in water temperature at the sampled sites. The left tributary, which receives warmer waters from the floodplain, affected the water temperature at the S5. However, this influence was smaller at the site 6. The right tributary carried water of similar temperature to the waters of the main watercourse. In the case of nutrients concentration, the largest load was observed on the right tributary, where the highest ammonia values (1.64 mg l−1) were present. Moreover, the following values were noted: total nitrogen of 2.66 mg l−1, phosphate concentration of 2.77 mg l−1 and total phosphorus of 7.25 mg l−1. These values exceed several times the nutrients concentration observed in the main watercourse or on the left tributary. The detailed values of the abiotic and biotic parameters at the investigated sites are presented in Table 1.
Mean value and SD of abiotic and biotic factors observed on the sampling sites. O2–oxygen dissolved, Cond − conductivity, NO3–nitrates, NO2–nitrites, NH3–ammonia, NTOT − total amount of nitrogen, PO4–phosphates, PTOT − total amount of phosphorus, Chla − chlorophyll a, Bottom − type of bottom: S − sandy, M − muddy, Veget − bottom cover by macrophytes, Macrophytes: most common macrophytes on site (ST − number of site, LR − Left Tributary, RT − Right Tributary).
3.2 Macroinvertebrates structures
During the entire study period, the presence of 49 taxa of macroinvertebrates was recorded (Tab. 2). There were significant differences in the number of taxa between the investigated sites. The highest number of taxa was observed at site 2, and subsequently decreased down the watercourse, reaching the lowest value at site 6 (Fig. 2, Tab. 3). The tributaries significantly differed between each other in the number of taxa. In the left tributary, a much higher number of taxa was noted than in the right tributary.
In the case of density, only on the right tributary achieved a significantly higher value of individuals per m2 than the remaining sites (Fig. 3, Tab. 3).
There were some significant differences in the Shannon–Weaver biodiversity index between the investigated sites. Generally, the lowest biodiversity index was observed in the lower section of the stream (Fig. 4. Tab. 3). It increased from site 1 to site 3, where it reached the highest value, and then decreased to site 6. The lowest value was observed in the right tributary.
Among the recorded taxa were 3 eudominants (Chironomidae, Asellidae and Gammaridae), 2 dominants (Sphaeriidae and Lumbriculidae), one subdominant (Culicidae) and 2 recedents (Baetidae and Limnephilidae) (Tab. 4). The absolutely permanent taxa included 18 families, but only 10 of them were present at each site (Tab. 5). 6 taxa were permanent, 12 taxa were accessory and 13 taxa were recognized as accidental.
List of taxa identified on sites.
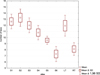 |
Fig. 2 Mean + SD values of number of taxa founded on examined sites (ST − number of site, LR − Left Tributary, RT − Right Tributary). |
Statistically significant differences in number of taxa, density and biodiversity between the sampling sites. The symbol>indicates the index is significantly higher on examined sites of column than the sites of the row. > means 0.05>p ≥ 0.01; >> means 0.01>p ≥ 0.001; >>> means p < 0.001 (ST − number of site, LR − Left Tributary, RT − Right Tributary).
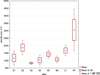 |
Fig. 3 Mean + SD values of total individuals per m2 on the examined sites (ST − number of site, LR − Left Tributary, RT − Right Tributary). |
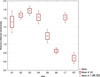 |
Fig. 4 Mean + SD values of Shannon-Wienner biodiversity index on the examined sites (ST − number of site, LR − Left Tributary, RT − Right Tributary). |
Dominant class of macroinvertebrates on sampling sites.
Frequency of taxa which were present in at least half of the sites.
3.3 Shaping the macroinvertebrate structures in the stream
The Jaccard's coefficient divided the sampling sites into 3 taxonomically similar groups (Fig. 5): the first group including site 6 and in the right tributary; the second group including sites 2, 3, 4 and the left tributary, and the third group including sites 1 and 5. Apart from the third group, sampling sites of the other two groups were located near to each other.
The results of the statistical analysis ANOVA showed that the largest difference in the abundance of macroinvertebrates between the examined sites was noted for 14 families (Tab. 6): Sphaeriidae, Lymnaeidae, Lumbriculidae, Nematoda, Erpobdellidae, Gammaridae, Asellidae, Beatidae, Limnephilidae, Dytiscidae, Chironomidae, Culilicdae Ptychopteridae and Sciomyzidae (p > 0.05).
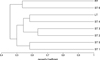 |
Fig. 5 The Jaccard's Coeffiicient shows taxonomic similarity of the examined sites (ST − number of site, LR − Left Tributary, RT − Right Tributary). |
Statistically significant differences in the mean abundance of taxa between the sampling sites. The symbol>indicates the mean abundance of taxa is significantly higher on examined sites of column than the sites of the row. > means 0.05 > p ≥ 0,01; >> means 0.01 > p ≥ 0.001; >>> means p < 0.001 (ST − number of site, LR − Left Tributary, RT − Right Tributary).
3.4 Influence of environmental conditions
The first axis of Canonical Corresponding Analysis (CCA) explained 20.9% of relationship between the occurrence of macroinvertebrates and environmental factors, while the second axis explained 9.7% (Fig. 6). There was a strong correlation of biogenic compounds (such as total phosphorus and phosphates content, total nitrogen and ammonia content) with the first axis. An equally strong correlation, but opposite to that of nutrients, was observed for the oxygen concentration. Moreover, the amount of chlorophyll a was strongly correlated with the second axis. In the case of macroinvertebrates, the CCA divided the organisms into 4 groups. The 1st group one gathered ubiquitous organisms, such as: Culicidae, Ptychopteridae, Nematoda and Chironomidae. These group of organisms showed very small correlation with the first axis. The 2nd group with Nemouridae, Leptoceridae, Gyrinidae and Gammaridae, was strongly correlated with the second axis, similarly to chlorophyll a. In the 3rd group there was one taxon: Crambidae, which was also correlated with the first axis, similarly to the 1st group, but with the opposite vector, similarly to oxygen concentration. The 4th group included organisms without any clear trends: Sciomyzidae, Psychodidae, Lumbriculidae, Dytiscidae, Baetidae, Simuliidae, Asellidae, Ceratopogonidae, Limnephilidae, Glossiphoenidae, Lymnaeidae, Sphaeriidae and Erpobdellidae. CCA divided the sites in three groups (Fig. 7). The first group were the sites located in the first section of the watercourse (S1–S4). The second group were the site located in the left tributary and the sites below them. To the last group one site was assigned—the right tributary—with the lowest oxygen concentration and the highest nutrients concentration.
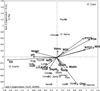 |
Fig. 6 The Canonical Corresponding Analysis (CCA) − the macroinvertebrates ordination. Spha − Sphaeriidae, Lymna − Lymnaeidae, Lumb − Lumbriculidae, Nema − Nematoda, Erpo − Erpobdellidae, Glossi − Glossiphoniidae, Gamma − Gammaridae, Aselli − Asellidae, Baeti − Beatidae, Lepto − Leptophlebiidae, Nemo − Nemouridae, Cramb − Crambidae, Limne − Limnephilidae, Dyti − Dytiscidae, Gyrini − Gyrinidae, Cerato − Ceratopogonidae, Chirono − Chironomidae, Culici − Culicidae, Psycho − Psychodidae, Ptycho − Ptychopteridae, Scio − Sciomyzidae, Simulii − Simuliidae, O2–oxygen dissolved, Cond − conductivity, NO3–nitrates, NO2–nitrites, NH3–ammonia, NTOT − total amount of nitrogen, PO4–phosphates, PTOT − total amount of phosphorus, Chla − chlorophyll a, Veloc − velocity, Disch − discharge, Temp − water temperature, Cond − conductivity, Veget − % bottom covered by macrophytes. |
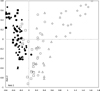 |
Fig. 7 The Canonical Corresponding Analysis (CCA) − the sites ordination. ■ − Site 1, ● Site − 2, ♦ − Site 3, ▲ − Site 4, ○ − Site 5, Δ − Site 6, □ − Left Tributary, ◊ − Right Tributary. |
4 Discussion
At the investigated sites, high diversity of the physico-chemical and biotic properties was observed. This was probably primarily due to the terrain type and the area through which the watercourse flowed, as well as the intensity of anthropopressure.
Considering all studies by Williams et al. (2003), in which they proved that ditches and streams are characterized by the smallest number of macroinvertebrate taxa, we made an assumption that in such a small, regulated and partially polluted stream we would find a low number of macroinvertebrate taxa. However, the results were much higher than we had expected. This relatively high diversity of macroinvertebrates can be explained mainly by the lack of predatory fish, the large amount of biogenic compounds and the relatively large number of samples taken.
In studies of abiotic and biotic factors influencing macroinvertebrate assemblages, there is always the problem of which factor—fish predation or environmental conditions—has the strongest impact on the invertebrates and whether the impact is positive or negative. Multiple authors provide different answers, and in the opinion of many of them, it mostly depends on the type of reservoir. For example, Nicola et al. (2010) claimed that in streams, benthic communities are most affected by water chemistry, and less by fish predation. On the other hand, Williams and Taylor (2003) found a significant influence of fish predations on the density and taxonomic structure of invertebrates in isolated pools of an intermittent stream. Moreover, Bonneau and Scarnecchia (2015) found that Cyprinus carpio can cause impoverishment of the macroinvertebrate taxa richness in streams. In our earlier paper regarding food selectivity of juvenile trout in small streams (Domagała et al., 2015), we found that the investigated fish preyed on selected groups of invertebrates, not necessarily those most abundant. All the above facts allow a conclusion that more accurate biotic and abiotic factors for benthos can be obtained, when these effects are examined separately.
In the investigated fishless stream, a large number of taxa was considered as absolutely permanent, yet most of them had a low abundance—even <1% of all organisms. Accordingly, it seems that with the absence of fish, invertebrates can spread unhindered. However, while the absence of fish allows a potential spread of macroinvertebrates, there are some environmental factors that limit the abundance of macroinvertebrate taxa. Among the factors taking for consideration in this study, it seems that the most limiting for the abundance of the investigated taxa were those that reached extreme values at the sites.
The use of CCA allowed us to determine that such factors were the oxygen concentration, nutrients and ammonia. In our study, we observed the lowest oxygen concentration and the highest amount of nutrients and ammonia in the right tributary, which supplied waste water. This tributary had the strongest influence on macroinvertebrate structures in the main watercourse, and was followed by the left tributary in which only water temperature was slightly higher than at the remaining sites. Despite the difference in water temperature between the left tributary and at the sites above it, and the fact that the watercourses came from various sources, there was no significant difference in the number of taxa, density and biodiversity between the left tributary and the sites situated above its outlet. Following the above statements and CCA results, the oxygen concentration and biogenic matter were the most important chemical factors shaping the macroinvertebrate communities in a fishless, regulated stream. It seems that physical and morphological factors, because of their homogeneity, were less important. Oxygen, as the main biogenic element, is often mentioned as an important determinant of invertebrate presence (Souto et al., 2011, Wynne and Linnane, 2009, Zhang et al., 2014). Based on the CCA results, the most favourable oxygen conditions during the whole period of study were observed at the first four sites of the watercourse, where the biodiversity reached the highest values.
In the investigated watercourse, a small scale of the River Continuum Concept (RCC) (Vannote et al., 1980) is reflected, even though it was developed for large scale areas. The model assumes that as the watercourse flows, accumulation of biogenic compounds and decrease in the biodiversity of benthic macroinvertebrates occur. The last section of the watercourse and the right tributary carrying wastewater presented the lowest values of biodiversity and number of taxa. Moreover, in the right tributary, the highest values of density were observed, caused by a high abundance of ubiquitous taxa, such as Chironomidae or Nematoda, and larvae breathing atmospheric oxygen (Culicidae and Ptychopteridae) that were also abundant below the mouth. Both the tributaries and changes in morphology affected variations in the structures of macroinvertebrates in the small watercourse.
Of course, there are other factors, such as the exact bottom structure, type and amount of macrophytes (Traversetti et al., 2015), or amount of heavy metals (Malaj et al., 2012), that could shed a bit more light on the shaping of benthic structures in this type of streams. For example, Graça et al. (2015) in their experiment showed that the differences in the benthos from sites with a less grainy bottom and sites with a more grainy bottom are visible only in the taxa composition and not in the quantity of taxa and abundance. This observation is also reflected in this study. We observed that the sites located in the upper section of the watercourse (ST 1, ST 2, ST 3 and ST 4) differed primarily in the type of bottom and the structure of macrophytes, while no significant differences were demonstrated in the number of taxa biodiversity and density of the benthos at these sites.
Thus, small watercourses, due to their size and the uniqueness of local conditions, as well as variability of environmental conditions often dependent on human-made transformation (Wohl, 2017), are a difficult research subject. Based on the results of this study, it can be concluded that aquatic macroinvertebrates in small fishless watercourses can spread in an uninterrupted manner. Physico-chemical conditions limit mainly the abundance of organisms. Among the abiotic parameters taken into account, the oxygen concentration in water and biogenic elements affected the most the abundance of benthic structures. Wastewater supplied by one tributary affected the benthic structures below its mouth in the recipient more strongly than water from field wetlands supplied by another tributary.
Despite the attempt to describe the topic in a comprehensive manner, there are still unanswered questions, such as what is the impact of the vegetation on the benthic structure in small fishless watercourses, or what is the impact of the graininess of the bottom on the occurrence of aquatic invertebrates. It is therefore necessary to conduct further studies of the evolution of macrozoobenthic structures in small watercourses if the ecological dependencies in this type of environment are to be thoroughly understood.
References
- Biesiadka E, Kowalik W. 1980. Water mites (Hydracarina) of the western Bieszczady mountains. 1. Stagnant waters. Acta hydrobiol 22: 279–289. [Google Scholar]
- Bonneau JL, Scarnecchia DL. 2015. Response of benthic macroinvertebrates to carp (Cyprinus carpio) biomanipulation in three tributaries of a eutrophic, Great Plains reservoir, USA. Trans Kans Acad Sci 118: 13–26. [CrossRef] [Google Scholar]
- Brabender M, Weitere M, Anlanger C, Brauns M. 2016. Secondary production and richness of native and non-native macroinvertebrates are driven by human-altered shoreline morphology in a large river. Hydrobiologia 776: 51–65. [CrossRef] [Google Scholar]
- Choe LJ, Jung SW, Kim DG, Baek MJ, Kang HJ, Lee CY, Bae YJ. 2014. Temporal changes in benthic macroinvertebrates and their interactions with fish predators after restoration in the Cheonggyecheon, a downtown stream in Seoul, Korea. Entomol Res 44: 338–348. [CrossRef] [Google Scholar]
- Domagała J, Krepski T, Czerniawski R, Pilecka-Rapacz M. 2015. Prey availability and selective feeding of sea trout (Salmo trutta L., 1758) fry stocked in small forest streams. J Appl Ichthyol 31: 375–380. [CrossRef] [Google Scholar]
- Graça MAS, Ferreira WR, Firmiano K, França J, Callisto M. 2015. Macroinvertebrate identity, not diversity, differed across patches differing in substrate particle size and leaf litter packs in low order, tropical Atlantic forest streams. Limnetica 34: 29–40. [Google Scholar]
- Kakouei K, Kiesel J, Kail J, Pusch M, Jähnig SC. 2017. Quantitative hydrological preferences of benthic stream invertebrates in Germany. Ecol Indic 79: 163–172. [CrossRef] [Google Scholar]
- Leitner P, Hauer C, Graf W. 2017. Habitat use and tolerance levels of macroinvertebrates concerning hydraulic stress in hydropeaking rivers − a case study at the Ziller River in Austria. Sci Total Environ 575: 112–118. [CrossRef] [PubMed] [Google Scholar]
- Leslie AW, Lamp WO. 2017. Taxonomic and functional group composition of macroinvertebrate assemblages in agricultural drainage ditches. Hydrobiologia 787: 99–110. [CrossRef] [Google Scholar]
- Leslie AW, Smith RF, Ruppert DE, Bejleri K, McGrath JM, Needelman BA, Lamp WO. 2012. Environmental factors structuring benthic macroinvertebrate communities of agricultural ditches in Maryland. Environ Entomol 41: 802–812. [CrossRef] [Google Scholar]
- Malaj E, Grote M, Schäfer RB, Brack W, Von Der Ohe PC. 2012. Physiological sensitivity of freshwater macroinvertebrates to heavy metals. Environ Toxicol Chem 31: 1754–1764. [CrossRef] [PubMed] [Google Scholar]
- Nicola GG, Almodóvar A, Elvira B. 2010. Effects of environmental factors and predation on benthic communities in headwater streams. Aquat Sci 72: 419–429. [CrossRef] [Google Scholar]
- Nyström P, McIntosh AR, Winterbourn MJ. 2003. Top-down and bottom-up processes in grassland and forested streams. Oecologia 136: 596–608. [CrossRef] [PubMed] [Google Scholar]
- Rico A, Van den Brink PJ, Leitner P, Graf W, Focks A. 2016. Relative influence of chemical and non-chemical stressors on invertebrate communities: a case study in the Danube River. Sci Total Environ 571: 1370–1382. [CrossRef] [PubMed] [Google Scholar]
- Simon TN, Travis J. 2011. The contribution of man-made ditches to the regional stream biodiversity of the new river watershed in the Florida panhandle. Hydrobiologia 661: 163–177. [CrossRef] [Google Scholar]
- Souto RMG, Facure KG, Pavanin LA, Jacobucci GB. 2011. Influence of environmental factors on benthic macroinvertebrate communities of urban streams in Vereda habitats, Central Brazil. Acta Limnologica Brasiliensia 23: 293–306. [CrossRef] [Google Scholar]
- Traversetti L, Ceschin S, Manfrin A, Scalici M. 2015. Co-occurrence between macrophytes and macroinvertebrates: towards a new approach for the running waters quality evaluation? J Limnol 74: 133–142. [Google Scholar]
- Vannote RL, Minshall GW, Cummins KW, Sedell JR, Cushing CE. 1980. The River Continuum concept. Can J Fish Aquat Sci 37: 130–137. [Google Scholar]
- Verdonschot RCM, Keizer-Vlek HE, Verdonschot PFM. 2011. Biodiversity value of agricultural drainage ditches: a comparative analysis of the aquatic invertebrate fauna of ditches and small lakes. Aquatic Conserv: Mar Freshw Ecosyst 21: 715–727. [CrossRef] [Google Scholar]
- Verdonschot RCM, Verdonschot PFM. 2014. Shading effects of free-floating plants on drainage-ditch invertebrates. Limnology 15: 225–235. [CrossRef] [Google Scholar]
- Whatley MH, Van Loon EE, Van Dam H, Vonk JA, Van Der Geest HG, Aadmiraal W. 2014. Macrophyte loss drives decadal change in benthic invertebrates in peatland drainage ditches. Freshwater Biol 59: 114–126. [CrossRef] [Google Scholar]
- Williams LR, Taylor CM. 2003. Influence of fish predation on assemblage structure of macroinvertebrates in an intermittent stream. T Am Fish Soc 132: 120–130. [CrossRef] [Google Scholar]
- Williams P, Whitfield M, Biggs J, Bray S, Fox G, Nicolet P, Sear D. 2003. Comparative biodiversity of rivers, streams, ditches and ponds in an agricultural landscape in Southern England. Biol Conserv 115: 329–341. [Google Scholar]
- Wohl E. 2017. The significance of small streams. Front Earth Sci 11: 447–456. [CrossRef] [Google Scholar]
- Wynne CA, Linnane SM. 2009. An investigation of macrophyte and macroinvertebrate communities in lowland sites on the rivers of Milltown (Muckno Mill) lake catchment, Co. Monaghan, Ireland. Verh Internat Verein Limnol 30: 1133–1136. [Google Scholar]
- Zhang Y, Zhang J, Wang L, Lu D, Cai D, Wang B. 2014. Influences of dispersal and local environmental factors on stream macroinvertebrate communities in Qinjiang River, Guangxi, China. Aquat Biol 20: 185–194. [CrossRef] [Google Scholar]
Cite this article as: Krepski T, Czerniawski R. 2018. Shaping of macroinvertebrate structures in a small fishless lowland stream exposed to anthropopressure, including the environmental conditions. Knowl. Manag. Aquat. Ecosyst., 419, 19.
All Tables
Mean value and SD of abiotic and biotic factors observed on the sampling sites. O2–oxygen dissolved, Cond − conductivity, NO3–nitrates, NO2–nitrites, NH3–ammonia, NTOT − total amount of nitrogen, PO4–phosphates, PTOT − total amount of phosphorus, Chla − chlorophyll a, Bottom − type of bottom: S − sandy, M − muddy, Veget − bottom cover by macrophytes, Macrophytes: most common macrophytes on site (ST − number of site, LR − Left Tributary, RT − Right Tributary).
Statistically significant differences in number of taxa, density and biodiversity between the sampling sites. The symbol>indicates the index is significantly higher on examined sites of column than the sites of the row. > means 0.05>p ≥ 0.01; >> means 0.01>p ≥ 0.001; >>> means p < 0.001 (ST − number of site, LR − Left Tributary, RT − Right Tributary).
Statistically significant differences in the mean abundance of taxa between the sampling sites. The symbol>indicates the mean abundance of taxa is significantly higher on examined sites of column than the sites of the row. > means 0.05 > p ≥ 0,01; >> means 0.01 > p ≥ 0.001; >>> means p < 0.001 (ST − number of site, LR − Left Tributary, RT − Right Tributary).
All Figures
|
Fig. 1 Study area. |
| In the text | |
|
Fig. 2 Mean + SD values of number of taxa founded on examined sites (ST − number of site, LR − Left Tributary, RT − Right Tributary). |
| In the text | |
|
Fig. 3 Mean + SD values of total individuals per m2 on the examined sites (ST − number of site, LR − Left Tributary, RT − Right Tributary). |
| In the text | |
|
Fig. 4 Mean + SD values of Shannon-Wienner biodiversity index on the examined sites (ST − number of site, LR − Left Tributary, RT − Right Tributary). |
| In the text | |
|
Fig. 5 The Jaccard's Coeffiicient shows taxonomic similarity of the examined sites (ST − number of site, LR − Left Tributary, RT − Right Tributary). |
| In the text | |
|
Fig. 6 The Canonical Corresponding Analysis (CCA) − the macroinvertebrates ordination. Spha − Sphaeriidae, Lymna − Lymnaeidae, Lumb − Lumbriculidae, Nema − Nematoda, Erpo − Erpobdellidae, Glossi − Glossiphoniidae, Gamma − Gammaridae, Aselli − Asellidae, Baeti − Beatidae, Lepto − Leptophlebiidae, Nemo − Nemouridae, Cramb − Crambidae, Limne − Limnephilidae, Dyti − Dytiscidae, Gyrini − Gyrinidae, Cerato − Ceratopogonidae, Chirono − Chironomidae, Culici − Culicidae, Psycho − Psychodidae, Ptycho − Ptychopteridae, Scio − Sciomyzidae, Simulii − Simuliidae, O2–oxygen dissolved, Cond − conductivity, NO3–nitrates, NO2–nitrites, NH3–ammonia, NTOT − total amount of nitrogen, PO4–phosphates, PTOT − total amount of phosphorus, Chla − chlorophyll a, Veloc − velocity, Disch − discharge, Temp − water temperature, Cond − conductivity, Veget − % bottom covered by macrophytes. |
| In the text | |
|
Fig. 7 The Canonical Corresponding Analysis (CCA) − the sites ordination. ■ − Site 1, ● Site − 2, ♦ − Site 3, ▲ − Site 4, ○ − Site 5, Δ − Site 6, □ − Left Tributary, ◊ − Right Tributary. |
| In the text | |
Current usage metrics show cumulative count of Article Views (full-text article views including HTML views, PDF and ePub downloads, according to the available data) and Abstracts Views on Vision4Press platform.
Data correspond to usage on the plateform after 2015. The current usage metrics is available 48-96 hours after online publication and is updated daily on week days.
Initial download of the metrics may take a while.