| Issue |
Knowl. Manag. Aquat. Ecosyst.
Number 427, 2026
Freshwater ecosystems management strategies
|
|
|---|---|---|
| Article Number | 15 | |
| Number of page(s) | 8 | |
| DOI | https://doi.org/10.1051/kmae/2026008 | |
| Published online | 01 May 2026 | |
Research Paper
The long-term change in phytoplankton nutrient limitation following external nutrient loading reduction in a subtropical shallow lake
1
Key Laboratory of Lake and Watershed Science for Water Security, Nanjing Institute of Geography and Limnology, Chinese Academy of Sciences, Nanjing, PR China
2
University of Chinese Academy of Sciences, Beijing, PR China
3
Department of Ecoscience, Aarhus University, Aarhus, Denmark
4
Sino-Danish Center for Education and Research, Beijing, PR China
5
Institute for Ecological Research and Pollution Control of Plateau Lakes, Yunnan University, Kunming, PR China
6
Department of Ecology, Jinan University, Guangzhou, Guangdong, PR China
* Corresponding author: This email address is being protected from spambots. You need JavaScript enabled to view it.
Received:
27
October
2025
Accepted:
9
April
2025
Abstract
Eutrophication caused by excess inputs of nitrogen (N) and phosphorus (P) is a global environmental problem for lakes. External nutrient control may change the relative influence of N and P on phytoplankton biomass. For Lake Wuli, a subtropical shallow lake in China, suffering from severe eutrophication since the early 1980s, a restoration program aimed to control external nutrient loading was implemented in 2002. Long-term data (1998–2019) revealed that annual mean phytoplankton biomass (Chl a concentration), total nitrogen (TN), and total phosphorus (TP) concentrations decreased significantly following external nutrient loading reduction. Both summer and winter TN concentrations declined markedly, whereas TP and Chl a decreased significantly only in winter. The decline in the concentrations of TN was larger than that of TP, resulting in a significant reduction in the TN/TP ratio from 33.3 to 15.5 on an annual basis, from 23.3 to 10.9 in summer, and from 44.3 to 21.2 in winter. A high TN/TP ratio and low SRP concentration (<10 μg/L) indicate that Lake Wuli was P-limited in winter. The changes in the summer TN/TP ratio indicate a shift from P limitation of phytoplankton growth to N and P co-limitation, which was confirmed by a nutrient addition experiment conducted in summer in 2023. Our results indicate that, at the present environmental conditions, inputs of either N or P, and especially both nutrients, will increase the risk of phytoplankton blooming in summer in this subtropical shallow lake.
Key words: TN/TP ratio / nutrient limitation / phytoplankton biomass / long-term changes / nutrient addition experiment
© S. Fu et al., Published by EDP Sciences, 2026
 This is an Open Access article distributed under the terms of the Creative Commons Attribution License CC-BY-ND (https://creativecommons.org/licenses/by-nd/4.0/), which permits unrestricted use, distribution, and reproduction in any medium, provided the original work is properly cited. If you remix, transform, or build upon the material, you may not distribute the modified material.
1 Introduction
The sustained occurrence of harmful algal blooms, driven by nutrient over-enrichment, is a severe problem affecting lake water quality worldwide (Reynolds, 1992; Ho et al., 2019; Hu et al., 2024; Paerl et al., 2024). Reducing the external nutrient loading is a key strategy in combating these blooms. Nutrient control efforts have led to significant decreases in nitrogen (N) and phosphorus (P) concentrations and, consequently, where sufficiently low concentrations could be attained, in the biomass of harmful bloom-forming algae (Jeppesen et al., 2005; Köhler et al., 2005).
N and P concentrations respond differently to reductions in external nutrient loading (Jeppesen et al., 2005, 2025; Su et al., 2022). In temperate shallow lakes, N concentrations usually respond more rapidly and reach a new equilibrium sooner than P concentrations (Köhler et al., 2005; Kronvang et al., 2005; Jeppesen et al., 2025). This greater decline in N than P has been mainly attributed to rapid loss of N through denitrification and temporarily high P release from the sediments (Köhler et al., 2005; Søndergaard et al., 2013), leading to a decrease in the N/P ratio. This in turn may affect the nutrient limitation status of phytoplankton (Collins et al., 2017; Tong et al., 2020; Wu et al., 2022) and result in a shift from P limitation (when nutrient concentrations are low enough to exert limitation) to N limitation of phytoplankton growth (Köhler et al., 2005; Xu et al., 2010). Using alkaline phosphatase activity (APA), N debt, and P debt (all expressed per unit chlorophyll a (Chl a)) as nutrient deficiency indicators, Guildford and Hecky (2000) analyzed samples across a broad spectrum of lake and ocean regimes and found that N-deficient growth of phytoplankton typically occurs when TN/TP < 9 (by mass), while P-deficient growth occurs when TN/TP > 22.6, and, at intermediate TN/TP ratios, neither N- nor P-deficient growth occurs. However, though not mentioned by the authors, phytoplankton growth limitation also depends on absolute concentrations of inorganic N and P (Maberly et al., 2002).
The TN/TP ratio varies seasonally in both temperate and subtropical shallow lakes, with higher values in winter and spring and lower values in summer and autumn (Köhler et al., 2005; Xu et al., 2010; Kolzau et al., 2014; Søndergaard et al., 2017), and P limitation during the colder months and N limitation during the warmer months of phytoplankton growth has been reported in many shallow lakes (Xu et al., 2010; Kolzau et al., 2014).
Lake Wuli is an isolated bay of Lake Taihu in subtropical China and has suffered from serious eutrophication since the 1980s. To restore the lake, an external nutrient loading control program involving disconnection of polluted inlet rivers was initiated in 2002, leading to significant water quality improvement (Chen et al., 2009; Chen et al., 2013). Using long-term (1998–2019) data from Lake Wuli, we elucidated whether major reduction in external N and P loading would lower N concentrations due to P internal loading, resulting in a decrease in the TN/TP and DIN/SRP ratios and a shift from P limitation of phytoplankton growth to either N and P co-limitation or N limitation alone after external nutrient loading control. We also conducted a nutrient addition experiment in summer (2023), comparing treatments with added N, added P, and a control without nutrient addition to further elucidate nutrient limitation of phytoplankton growth in the lake.
2 Methods and materials
2.1 Study area
Lake Wuli (31°30′07″-31°32′48″N, 120°15′11″-120°13′54″E) is located in Wuxi City, China. It has a surface area of 8.6 km2 and an average depth of 2.0 m (Fig. 1). Earlier the lake was in a clear-water state dominated by submerged macrophytes, but – starting in the early 1980s – it became heavily polluted by nutrients due to sewage discharge from Wuxi city. In 2002, a restoration program was initiated to control the external nutrient load to the lake by disconnecting river inflows, sediment dredging, and removal of in-lake fish ponds (established during the 1950s) in selected areas to reduce the internal nutrient loading (Chen et al., 2013).
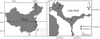 |
Fig. 1 Location of Lake Wuli and sampling sites. |
2.2 Long-term monitoring data
Monitoring of Lake Wuli was undertaken from 1998 to 2019 by the Taihu Laboratory for Lake Ecosystem Research at two regular stations (Fig. 1), involving monthly sampling before 2005 and seasonally thereafter.
2.3 Nutrient addition experiments
To assess nutrient limitations of phytoplankton growth in the lake, an in situ nutrient addition experiment was carried out in September 2023. Water was sampled from a 0.5 m depth below the surface and subsequently filtered through a 200 μm sieve. A 0.5 L subsample was analyzed to determine initial N, P, and Chl a concentrations. Acid-washed 2 L polyethylene bottles (chemically inert, unbreakable, and transparent (90% PAR transmittance)) were used for incubation. Four N and P addition treatments were applied, each with four replicates, resulting in a total of 16 incubation bottles (Tab. 1). Nitrogen was added as KNO3, the dominant form of inorganic N in lakes, and P as K2HPO4. Additionally, to avoid inorganic carbon limitation during incubation, dissolved inorganic carbon (DIC) was added at a concentration of 560 μmol/L NaHCO3 (Rudek et al., 1992).
The polyethylene bottles were incubated for six days, floating just under the lake surface and fixed to plastic racks. At the end of the experiment, Chl a and nutrient concentrations were determined, and the Chl a concentration was used as a proxy for phytoplankton biomass.
Initial nutrient concentrations and N/P ratios in the water used for each nutrient addition experiment, each with four replicates. +N refers to N addition, +P to P addition, and +NP to co-addition of N and P.
2.4 Chemical measurements
The chemical variables analyzed included TN, TP, nitrate (NO3-N), nitrite (NO2-N), ammonium (NH3-N), soluble reactive phosphorus (SRP), and Chl a. The SRP was measured spectrophotometrically using the molybdenum blue method with a detection limit of 10 μg/L (EPA, 1993; APHA, 1998). Where NH3-N was measured by the indophenol blue method, NO3-N and NO2-N were analyzed by the cadmium reduction method (APHA, 1998). TN and TP were both determined by digesting water samples with potassium persulfate (K2S2O8), followed by spectrophotometric measurement as the same as measuring NO2-N and SRP (Ebina et al., 1983). The Chl a concentration was measured using heat ethanol extraction and spectrophotometric analysis (Xu et al., 2010; Li et al., 2022). These methods were used in both long-term monitoring and nutrient addition experiments.
2.5 Statistical analyses
Since some variables such as TN changed quickly after the restoration in 2002 until 2008, for statistical analysis, the long-term time series were divided into two periods: pre-restoration (1998–2002) and post-restoration (2008–2019). To examine the temporal fluctuations of all variables, we employed a generalized additive model (GAM). As physicochemical and biological data in lakes often exhibit non-linear trends and substantial fluctuations over time, GAM enables accurate fitting of trends and assessment of their significance (Frenken et al., 2023). The GAM in this study was fitted using the mgcv package in R ver. 4.3.2 (www.r-project.org).
For the nutrient addition experiment, differences in Chl a concentration among treatments were analyzed using one-way ANOVA. In all cases, the untransformed data meet the assumptions of normality or homogeneity of variance. Statistical analyses were performed using the SPSS 25.0 statistical package, and the significance level for all tests was P < 0.05.
3 Results
3.1 The long-term responses of Chl a and nutrient concentrations
After restoration, the annual mean Chl a concentration in Lake Wuli decreased significantly (P < 0.01), from 58.1 μg/L before restoration (mean of 1998–2002) to 24.3 μg/L after restoration (mean of 2008–2019) (Fig. 2A and Tab. 2). However, the summer Chl a concentration showed no significant change over time (P = 0.07), with mean values of 57.0 and 45.7 μg/L pre- and post-restoration, respectively (Fig. 2B and Tab. 2). In contrast, the winter Chl a concentration decreased significantly (P = 0.02) after restoration, from 17.7 μg/L before restoration to 10.0 μg/L afterward (Fig. 2C and Tab. 2). The Chl a concentration was generally higher in summer than in winter.
Following restoration, annual mean TN concentrations declined rapidly until 2008, by 74% from 5.83 mg/L before restoration (1998–2002) to 1.31 mg/L during 2008–2019 (Fig. 2D and Tab. 2). Significant reductions in mean TN concentrations were observed in both summer and winter following restoration (summer: P < 0.01, winter: P < 0.01), with a 56% decrease from 3.65 to 1.60 mg/L in summer and an 85% decrease from 7.53 to 1.14 mg/L in winter (Figs. 2E, 2F and Tab. 2). DIN (NO3-N, NO2-N, and NH3-N) concentrations followed a similar pattern – a rapid and significant decline of 90% occurred until 2008, from 4.30 mg/L before restoration (1998–2002) to 0.43 mg/L during 2008–2019 (Fig. 2G and Tab. 2). Significant reductions in mean DIN concentrations during both summer and winter were recorded post-restoration (summer: P < 0.01, winter: P < 0.01) – a 75% decrease from 2.12 to 0.49 mg/L in summer and a 93% decrease from 5.77 to 0.40 mg/L in winter (Figs. 2H, 2I and Tab. 2).
Annual mean TP concentration also decreased significantly (P < 0.01) after restoration, showing a 46% reduction from 0.19 to 0.10 mg/L (Fig. 2J and Tab. 2). In winter, TP concentrations (P < 0.01) declined significantly from 0.18 to 0.07 mg/L (62%); in contrast, there was no significant reduction of summer TP (P = 0.12) (Figs. 2K, 2L and Tab. 2). After restoration, winter SRP concentrations showed a significant 38% decrease (P < 0.01), from 0.008 to 0.005 mg/L, whereas changes in annual and summer mean SRP concentrations (annual from 0.015 to 0.017 mg/L and summer from 0.034 to 0.036 mg/L) were not significant (annual: P = 0.38, summer: P = 0.37) (Figs. 2M–2O and Tab. 2). Note that the values of SRP were not reliable below 0.01 mg/L, which is the detection limit of the method used in this study.
The annual mean TN/TP ratio decreased significantly from 33.3 to 15.5, summer and winter ratios declining from 23.3 to 10.9 and from 44.3 to 21.2, respectively (P < 0.01) (Figs. 3A–3C and Tab. 2). The annual mean DIN/SRP ratio decreased significantly after restoration from 1299 to 81.4, with significant reductions in both summer and winter from 299 to 22.8 and from 1665 to 137, respectively (P < 0.01) (Figs. 3D–3F and Tab. 2).
Chl a/TN values increased significantly both in summer and winter (P < 0.01) (Figs. 3D–3F and Tab. 2), while Chl a/TP increased significantly only in winter (annual: P = 0.14, summer: P = 0.07, winter: P < 0.01) (Figs. 3G–3I and Tab. 2).
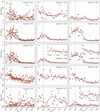 |
Fig. 2 Long-term trends in annual, summer, and winter concentrations of Chl a, TN, DIN, TP, and SRP in Lake Wuli (the solid line is fitted by a generalized additive model; P-values represent significance levels). The dotted lines indicate the time of the restoration (note that the values of SRP were not reliable below 0.01 mg/L, which is the detection limit of the method used in this study). |
The annual, summer, and winter mean values of Chl a and nutrient concentrations in the pre-restoration period (1998–2002) and post-restoration period (2008–2019). Significance is indicated by P-values in bold based on the GAM model.
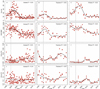 |
Fig. 3 Long-term trends in annual, summer, and winter TN/TP, DIN/SRP, Chl a/TN, and Chl a/TP in Lake Wuli (the solid line is fitted by a generalized additive model; P-values represent significance levels). The dotted lines indicate the time of restoration. |
3.2 Nutrient addition experiment
Phytoplankton biomass (Chl a concentration) peaked on the sixth day of the nutrient addition experiment, with a mean Chl a concentration of 27.3 μg/L in the control treatment without nutrient addition. Both N and P addition alone significantly increased Chl a concentration compared to the control (P < 0.05). Co-addition of N and P resulted in a significantly higher Chl a concentration than in all the other treatments (P < 0.05), with a mean value of 114.4 μg/L – more than twice the concentration observed with N alone (40.5 μg/L) or P alone (43.6 μg/L). Additionally, the concentration of Chl a in the control treatment increased significantly compared to the initial value (P < 0.05) (11.8 μg/L) (Fig. 4).
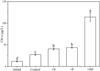 |
Fig. 4 Initial Chl a concentrations and maximum response in the different treatments (control, + N, + P, and + NP) of the nutrient limitation experiment in Lake Wuli. N is nitrogen addition, P phosphorus addition, and NP nitrogen and phosphorus co-addition. Error bars indicate ±1 SD of four replicates. Differences between treatments are based on ANOVA post hoc tests (a > b > c > d; P < 0.05). |
4 Discussion
Long-term data from Lake Wuli showed a greater decline in annual mean TN than mean TP concentrations after restoration. Further analyses revealed a delayed response of TP concentrations to external loading reduction, particularly in summer, where no change was observed over time. A rapid decline in N concentrations in shallow lakes after N loading reduction has been attributed to denitrification at the water-sediment interface, especially during the summer months (Jensen et al., 1992; Saunders and Kalff, 2001). In contrast, a delayed response of TP concentrations to reduced external P loading has been extensively reported in eutrophic shallow lakes (Jeppesen et al., 2005, 2025; Noges et al., 2007; Søndergaard et al., 2017). This delay is mainly attributed to P release from the P pool accumulated in the sediments, especially in summer and autumn when water temperatures are high (Søndergaard et al., 2013, 2017). Jeppesen et al. (2005) analyzed long-term data from 35 temperate lakes and found that N can reach a new equilibrium adapted to the adjusted nutrient loadings in less than five years, whereas P may take 10–15 years or longer to reach an equilibrium after external nutrient reduction.
The TN/TP ratio was highest in 2003 in both summer and winter, far exceeding the 22.6 that potentially indicates P limitation of phytoplankton growth provided SRP is sufficiently low to be limiting (Guildford and Hecky, 2000), but during this period both SRP (76 μg/L) and DIN (1.74 mg/L) were too high to limit phytoplankton growth. After restoration, TN/TP and DIN/SRP ratios decreased, approaching levels in summer characteristic of potentially N-limited systems. Greater increases in Chl a/TN than in Chl a/TP also indicate a higher degree of N limitation in response to loading reduction (Reynolds, 1992). However, our observed mean winter TN/TP ratio was 21.2, and the winter SRP concentration was lower than 10 μg/L, while DIN was around 0.40 mg/L, indicating that Lake Wuli remains P-limited in winter after restoration.
Although both mean summer concentrations of DIN (0.49 mg/L) and SRP (36 μg/L) exceeded the commonly accepted N and P limitation threshold values reported in the literature (Dolman et al., 2012; Kolzau et al., 2014; Chorus and Spijkerman, 2020), the nutrient addition experiment demonstrated the occurrence of co-limitation in summer in Lake Wuli. The experimental results showed that, while addition of either N or P alone significantly increased Chl a concentration, combined addition of N and P increased Chl a concentration to more than twice the levels observed with addition of single N or P (Fig. 3). Similar results have been recorded in many other lakes. Barnard et al. (2021) found that, despite a high average SRP concentration of 66 μg/L in summer, the cyanobacteria still showed an increased growth rate in response to P addition, while initial DIN concentrations were high (>2.8 mg/L) in Lake Erie, USA, and Andersen et al. (2020) found a threshold DIN concentration above which there was no response in phytoplankton to N addition as high as 0.56 mg/L DIN in Acton Lake, a hypertrophic reservoir in the USA.
Notably, a significant increase in Chl a concentration also occurred in the control without N or P addition during the course of the experiment (Fig. 3). This increase likely reflects that the phytoplankton had not yet reached the maximum biomass defined by the carrying capacity of N and P in the lake at the time when the experiment was carried out (Reynolds, 1992; Chorus and Spijkerman, 2020; Andersen et al., 2025). Alternatively, phytoplankton growth in the lake may have been limited by factors other than N and P, which were alleviated when the phytoplankton communities were collected and incubated in the bottles. For instance, zooplankton grazing – known to reduce Chl a to TP ratio (Jeppesen et al., 1999; Li et al., 2025) – decreased in our experiment as we filtered the water through 200 μm sieves to remove zooplankton. Moreover, in lakes, phytoplankton is often circulated to deeper, low-light water depths due to turbulence. In our experiment, reduced vertical mixing in the incubation bottles just under the lake surface compared to the lake likely alleviated light limitation (MacIntyre, 1993; Diehl, 2002). Although carbon limitation is common in many eutrophic lakes (Zagarese et al., 2021), we added dissolved inorganic carbon (DIC) at a concentration of 560 μmol/L NaHCO3 to avoid carbon limitation during the experiment. Further well-designed experimental studies are required to understand how multiple factors affect phytoplankton production at the community level in response to N and P addition in eutrophic shallow lakes, such as Lake Wuli, where dramatic changes in turbidity and nutrient availability may occur even within hours.
5 Conclusions
The results of our analysis of long-term data from subtropical Lake Wuli showed that a reduction of external nutrient loading significantly decreased annual mean Chl a, TN, and TP concentrations. The decline in TN concentrations exceeded that of TP due to the insignificant reduction of summer TP. This led to a notable decrease in annual as well as summer and winter TN/TP ratios. The TN/TP ratio response to external loading reduction indicates a shift in phytoplankton production in Lake Wuli from P limitation to N and P co-limitation in summer, while the lake likely remained P limited in winter. Our nutrient addition experiment confirmed summer co-limitation, as both separate and – even more so – combined N and P addition significantly increased phytoplankton biomass (Chl a concentrations). Our results, therefore, indicate that, at the present environmental conditions, inputs of either N or P, and especially of both nutrients, will increase the risk of phytoplankton blooming in summer in this subtropical shallow lake.
Acknowledgments
This work was supported the National Natural Science Foundation of China (U25A20639; 32371629). EJ was supported by Yunnan Provincial Council of Academicians and Experts Workstations (202405AF140006). We thank Amy-Jane Beer for suggestions and the English improvements of this manuscript, and the reviewer Ingrid Chorus for her valuable constructive comments.
References
- Andersen IM, Williamson TJ, González MJ, Vanni MJ. 2020. Nitrate, ammonium, and phosphorus drive seasonal nutrient limitation of chlorophytes, cyanobacteria, and diatoms in a hyper‐eutrophic reservoir. Limnol Oceanogr 65: 962–978. [Google Scholar]
- Andersen IM, Taylor JM, Kelly PT, Hoke AK, Robbins CJ, Scott JT. 2025. Nitrogen fixation may not alleviate stoichiometric imbalances that limit primary production in eutrophic lake ecosystems. Ecology 106: e4516. [Google Scholar]
- APHA. 1998. Standard Methods for the Examination of Water and Wastewater, 20thTwentieth ed. American Public Health Association, Washington DC, 2151 p. [Google Scholar]
- Barnard MA, Chaffin JD, Plaas HE, Boyer GL, Wei B, Wilhelm SW, Rossignol KL, Braddy JS, Bullerjahn GS, Bridgeman TB, Davis TW, Wei J, Bu M, Paerl HW. 2021. Roles of nutrient limitation on western Lake Erie CyanoHAB toxin production. Toxins 13: 47. [Google Scholar]
- Chen KN, Bao CH, Zhou WP. 2009. Ecological restoration in eutrophic Lake Wuli: a large enclosure experiment. Ecol Eng 35: 1646–1655. [Google Scholar]
- Chen FZ, Shu TT, Jeppesen E, Liu ZW, Chen YW. 2013. Restoration of a subtropical eutrophic shallow lake in China: effects on nutrient concentrations and biological communities. Hydrobiologia 718: 59–71. [Google Scholar]
- Chorus I, Spijkerman E. 2020. What Colin Reynolds could tell us about nutrient limitation, N:P ratios and eutrophication control. Hydrobiologia 848: 95–111. [Google Scholar]
- Collins SM, Oliver SK, Lapierre JF, Stanley EH, Jones JR, Wagner T, Soranno PA. 2017. Lake nutrient stoichiometry is less predictable than nutrient concentrations at regional and sub-continental scales. Ecol Appl 27: 1529–1540. [Google Scholar]
- Diehl S. 2002. Phytoplankton, light, and nutrients in a gradient of mixing depths: theory. Ecology 83: 386–398. [CrossRef] [Google Scholar]
- Dolman AM, Rücker J, Pick FR, Fastner J, Rohrlack T, Mischke U, Wiedner C. 2012. Cyanobacteria and Cyanotoxins: The influence of nitrogen versus phosphorus. PLoS One 7: e38757. [Google Scholar]
- Ebina J, Tsutsui T, Shirai T. 1983. Simultaneous determination of total nitrogen and total phosphorus in water using peroxodisulfate oxidation. Water Res 17: 1721–1726. [Google Scholar]
- EPA. 1993. Method 365.1, Revision 2.0: Determination of Phosphorus by Semi-Automated Colorimetry, Environmental Monitoring Systems Laboratory Office of Research and Development U.S. Environmental Protection Agency, Cincinnati Ohio, 17 p. [Google Scholar]
- Frenken T, Brandenburg KM, Van de Waal DB. 2023. Long‐term nutrient load reductions and increasing lake TN: TP stoichiometry decrease phytoplankton biomass and diversity in a large shallow lake. Limnol Oceanogr 68: 2389–2401. [Google Scholar]
- Guildford SJ, Hecky RE. 2000. Total nitrogen, total phosphorus, and nutrient limitation in lakes and oceans: Is there a common relationship? Limnol Oceanogr 45: 1213–1223. [Google Scholar]
- Ho JC, Michalak AM, Pahlevan N. 2019. Widespread global increase in intense lake phytoplankton blooms since the 1980s. Nature 574: 667–670. [Google Scholar]
- Hu MQ, Ma RH, Xue K, Cao ZG, Xiong JF, Loiselle SA, Shen M, Hou X. 2024. Eutrophication evolution of lakes in China: Four decades of observations from space. J Hazard Mater 470: 134225. [Google Scholar]
- Jensen HS, Kristensen P, Jeppesen E, Skytthe A. 1992. Iron: phosphorus ratio in surface sediment as an indicator of phosphate release from aerobic sediments in shallow lakes. Hydrobiologia 235: 731–743. [Google Scholar]
- Jeppesen E, Jensen JP, Søndergaard M, Lauridsen T. 1999. Trophic dynamics in turbid and clearwater lakes with special emphasis on the role of zooplankton for water clarity. Hydrobiologia 408: 217–231. [Google Scholar]
- Jeppesen E, Søndergaard M, Jensen JP, Havens KE, Anneville O, Carvalho L, Coveney MF, Deneke R, Dokulil MT, Foy B, Gerdeaux D, Hampton SE, Hilt S, Kangur K, Köhler J, Lammens EHHR, Lauridsen TL, Manca M, Miracle MR, Moss B, Nõges P, Persson G, Phillips G, Portielje R, Romo S, Schelske CL, Straile D, Tatrai I, Willén E, Winder M. 2005. Lake responses to reduced nutrient loading – an analysis of contemporary long‐term data from 35 case studies. Freshwater Biol 50: 1747–1771. [Google Scholar]
- Jeppesen E, Sørensen LS, Johansson LS, Søndergaard M, Lauridsen TL, Nielsen A, Mejlhede P. 2025. Recovery of lakes from eutrophication: changes in nitrogen retention capacity and the role of N legacy in 10 Danish lakes studied for 30 years. Hydrobiologia 852: 377–387. [Google Scholar]
- Köhler J, Hilt S, Adrian R, Nicklisch A, Kozerski P, Walz N. 2005. Long‐term response of a shallow, moderately flushed lake to reduced external phosphorus and nitrogen loading. Freshwater Biol 50: 1639–1650. [Google Scholar]
- Kolzau S, Wiedner C, Rücker J, Köhler J, Köhler A, Dolman AM. 2014. Seasonal patterns of nitrogen and phosphorus limitation in four German lakes and the predictability of limitation status from ambient nutrient concentrations. PLoS One 9: e96065. [Google Scholar]
- Kronvang B, Jeppesen E, Conley DJ, Søndergaard M, Larsen SE, Ovesen NB, Carstensen J. 2005. Nutrient pressures and ecological responses to nutrient loading reductions in Danish streams, lakes and coastal waters. J Hydrol 304: 274–288. [Google Scholar]
- Li B, Chen DY, Lu JC, Liu SX, Wu JL, Gan L, Yang XQ, He XL, He H, Yu JL, Zhong P, Tang YL, Zhang XF, Du YX, Su YL, Guan BH, Chen FZ, Li KY, Jeppesen E, Liu ZW. 2025. Restoring turbid eutrophic shallow lakes to a clear-water state by combined biomanipulation and chemical treatment: A 4-hectare in-situ experiment in subtropical China. J Environ Manage 380: 125061. [Google Scholar]
- Li Y, Shen RJ, Liu X, Su HJ, Wu FQ, Chen FZ. 2022. Impacts of nutrient reduction on temporal β-diversity of rotifers: A 19-year limnology case study on Lake Wuli, China. Water Res 216: 118364. [Google Scholar]
- Maberly SC, King L, Dent MM, Jones RI, Gibson CE. 2002. Nutrient limitation of phytoplankton and periphyton growth in upland lakes. Freshw Biol 47: 2136–2152. [Google Scholar]
- MacIntyre S. 1993. Vertical mixing in a shallow, eutrophic lake: Possible consequences for the light climate of phytoplankton. Limnol Oceanogr 38: 798–817. [Google Scholar]
- Noges T, Järvet A, Kisand A, Laugaste R, Loigu E, Skakalski B, Noges P. 2007. Reaction of large and shallow lakes Peipsi and Vortsjarv to the changes of nutrient loading. Hydrobiologia 584: 253–264. [Google Scholar]
- Paerl HW, Chaffin JD, Cheshire JH, Plaas HE, Barnard MA, Goerlitz LB, Braddy JS, Sabo A, Nelson LM, Yue L. 2024. Dual phosphorus and nitrogen nutrient reduction will be more effective than a phosphorus-only reduction in mitigating diatom and cyanobacterial blooms in Lake Erie, USA-Canada. Limnol Oceanogr 69: 2913–2928. [Google Scholar]
- Reynolds CS. 1992. Eutrophication and the management of planktonic algae: what Vollenweider couldn’t tell us. In: Sutcliffe DW, Jones JG eds. Eutrophication: Research and Application to Water Supply, Ambleside, Cumbria: The Freshwater Biological Association, pp. 4–29. [Google Scholar]
- Rudek J, Paerl HW, Mallin MA, Bates PW. 1992. Seasonal and hydrological control of phytoplankton nutrient limitation in the lower Neuse River Estuary, North Carolina. Mar Ecol Prog Ser 75: 133–142. [Google Scholar]
- Saunders DL, Kalff J. 2001. Denitrification rates in the sediments of Lake Memphremagog, Canada–USA. Water Res 35: 1897–1904. [Google Scholar]
- Søndergaard M, Bjerring R, Jeppesen E. 2013. Persistent internal phosphorus loading during summer in shallow eutrophic lakes. Hydrobiologia 710: 95–107. [Google Scholar]
- Søndergaard M, Lauridsen TL, Johansson LS, Jeppesen E. 2017. Nitrogen or phosphorus limitation in lakes and its impact on phytoplankton biomass and submerged macrophyte cover. Hydrobiologia 795: 35–48. [Google Scholar]
- Su H, Zou R, Zhang XL, Liang ZY, Ye R, Liu Y. 2022. Exploring the type and strength of nonlinearity in water quality responses to nutrient loading reduction in shallow eutrophic water bodies: Insights from a large number of numerical simulations. J Environ Manage 313: 115000. [Google Scholar]
- Tong YD, Wang MZ, Penuelas J, Liu XY, Paerl HW, Elser JJ, Sardans J, Couture RM, Larssen T, Hu HY, Dong X, He W, Zhang WJ, Wang XJ, Zhang Y, Liu Y, Zeng SY, Kong XZ, Janssen ABG, Lin Y. 2020. Improvement in municipal wastewater treatment alters lake nitrogen to phosphorus ratios in populated regions. Proc Natl Acad Sci USA 117: 11566–11572. [Google Scholar]
- Wu Z, Li JC, Sun YX, Peñuelas J, Huang JL, Sardans J, Jiang QS, Finlay JC, Britten GL, Follows MJ, Gao W, Qin BQ, Ni JR, Huo SL, Liu Y. 2022. Imbalance of global nutrient cycles exacerbated by the greater retention of phosphorus over nitrogen in lakes. Nat Geosci 15: 464–468. [Google Scholar]
- Xu H, Paerl HW, Qin BQ, Zhu GW, Gao G. 2010. Nitrogen and phosphorus inputs control phytoplankton growth in eutrophic Lake Taihu, China. Limnol Oceanogr 55: 420–432. [Google Scholar]
- Zagarese HE, Sagrario MÁG, Wolf-Gladrow D, Nõges P, Nõges T, Kangur K, Matsuzaki SS, Kohzu A, Vanni MJ, Özkundakci D, Echaniz SA, Vignatti A, Grosman F, Sanzano P, Van Dam B, Knoll LB. 2021. Patterns of CO2 concentration and inorganic carbon limitation of phytoplankton biomass in agriculturally eutrophic lakes. Water Res 190: 116715. [Google Scholar]
Cite this article as: Fu S, Yu J, He H, Jeppesen E, Liu Z. 2026. The long-term change in phytoplankton nutrient limitation following external nutrient loading reduction in a subtropical shallow lake. Knowl. Manag. Aquat. Ecosyst., 427, 15. https://doi.org/10.1051/kmae/2026008
All Tables
Initial nutrient concentrations and N/P ratios in the water used for each nutrient addition experiment, each with four replicates. +N refers to N addition, +P to P addition, and +NP to co-addition of N and P.
The annual, summer, and winter mean values of Chl a and nutrient concentrations in the pre-restoration period (1998–2002) and post-restoration period (2008–2019). Significance is indicated by P-values in bold based on the GAM model.
All Figures
|
Fig. 1 Location of Lake Wuli and sampling sites. |
| In the text | |
|
Fig. 2 Long-term trends in annual, summer, and winter concentrations of Chl a, TN, DIN, TP, and SRP in Lake Wuli (the solid line is fitted by a generalized additive model; P-values represent significance levels). The dotted lines indicate the time of the restoration (note that the values of SRP were not reliable below 0.01 mg/L, which is the detection limit of the method used in this study). |
| In the text | |
|
Fig. 3 Long-term trends in annual, summer, and winter TN/TP, DIN/SRP, Chl a/TN, and Chl a/TP in Lake Wuli (the solid line is fitted by a generalized additive model; P-values represent significance levels). The dotted lines indicate the time of restoration. |
| In the text | |
|
Fig. 4 Initial Chl a concentrations and maximum response in the different treatments (control, + N, + P, and + NP) of the nutrient limitation experiment in Lake Wuli. N is nitrogen addition, P phosphorus addition, and NP nitrogen and phosphorus co-addition. Error bars indicate ±1 SD of four replicates. Differences between treatments are based on ANOVA post hoc tests (a > b > c > d; P < 0.05). |
| In the text | |
Current usage metrics show cumulative count of Article Views (full-text article views including HTML views, PDF and ePub downloads, according to the available data) and Abstracts Views on Vision4Press platform.
Data correspond to usage on the plateform after 2015. The current usage metrics is available 48-96 hours after online publication and is updated daily on week days.
Initial download of the metrics may take a while.