


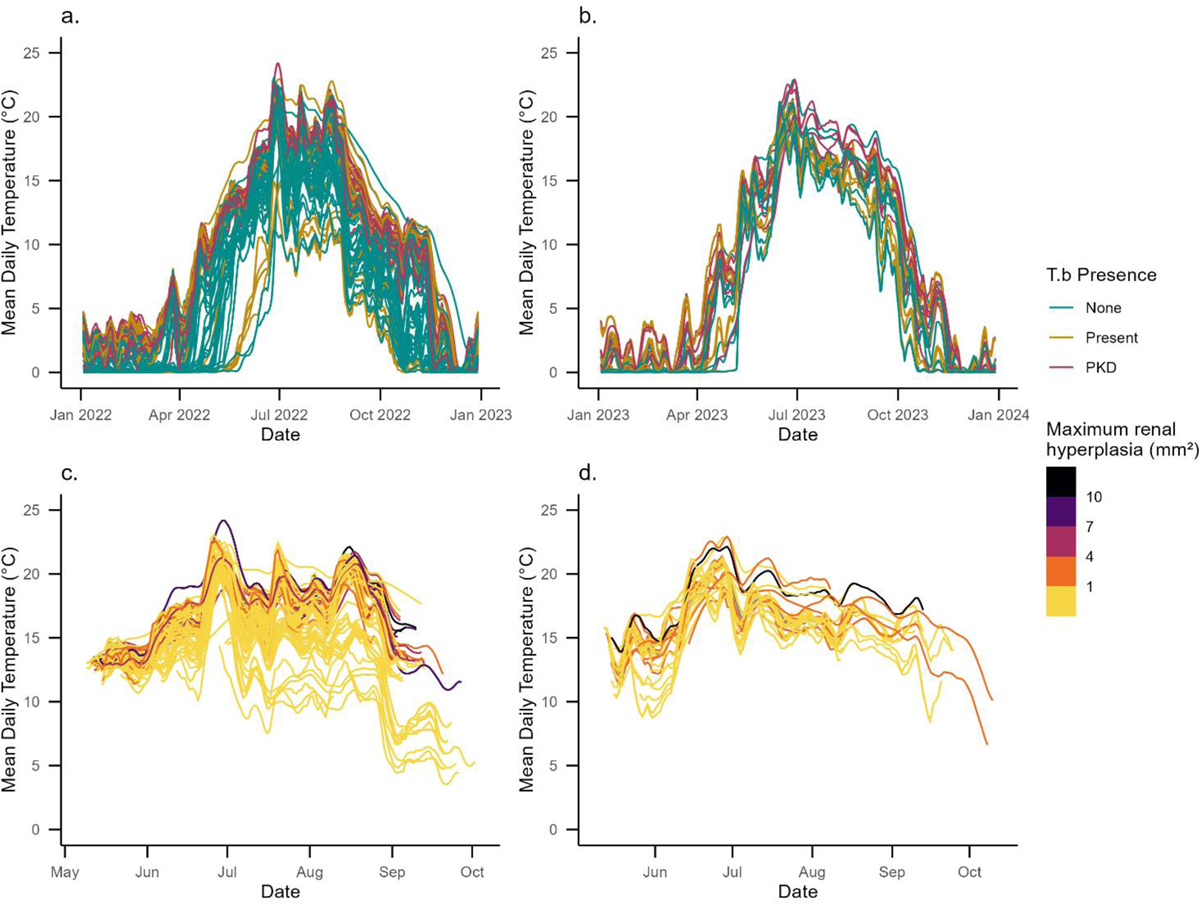
Fig. 5
Download original image
Mean modelled daily water temperature values with colours designated by parasite presence (a-b) and maximum renal hyperplasia (c-d), yellow lines represent fish without pathological symptoms. Locations sampled in 2022 are shown in (a,c), and locations sampled in 2023 are shown in (b,d).
Current usage metrics show cumulative count of Article Views (full-text article views including HTML views, PDF and ePub downloads, according to the available data) and Abstracts Views on Vision4Press platform.
Data correspond to usage on the plateform after 2015. The current usage metrics is available 48-96 hours after online publication and is updated daily on week days.
Initial download of the metrics may take a while.