


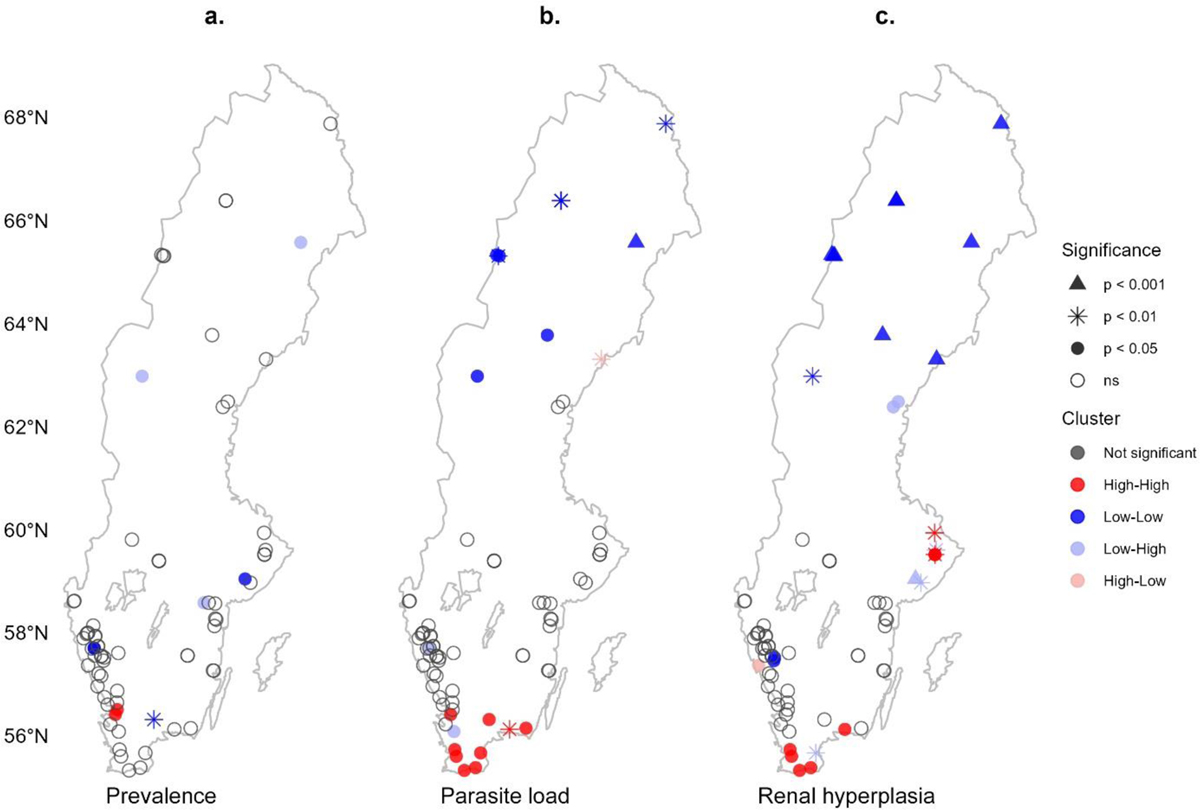
Fig. 4
Download original image
Local indicators of spatial autocorrelation for the standardised variables representing a. population infection prevalence, b. mean parasite load and c. maximum renal hyperplasia. Spatial weights were defined with an adaptive Gaussian kernel (see Methods). For each variable, LISA statistics were computed using 9,999 complete permutations. Colours designate cluster type while symbols encode permutation significance levels. Cluster assignment used a 0.05 cutoff for significance.
Current usage metrics show cumulative count of Article Views (full-text article views including HTML views, PDF and ePub downloads, according to the available data) and Abstracts Views on Vision4Press platform.
Data correspond to usage on the plateform after 2015. The current usage metrics is available 48-96 hours after online publication and is updated daily on week days.
Initial download of the metrics may take a while.