Fig. 4
Download original image
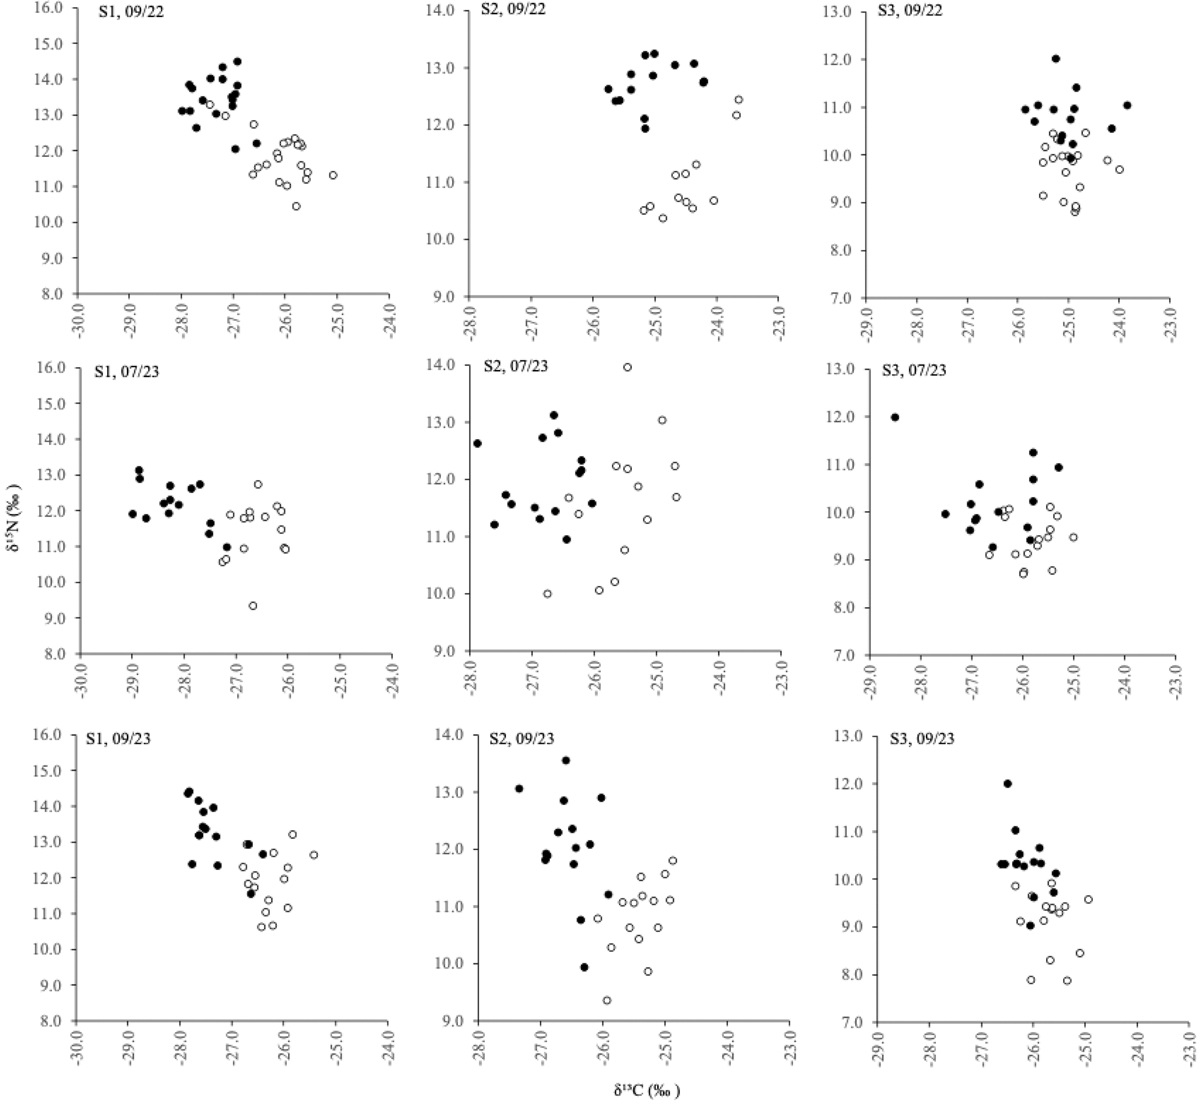
Stable isotope plots (using uncorrected values of δ13C and δ15N) of Atlantic salmon (filled circles) and brown trout (clear circles) for Site (S) 1, 2 and 3 in September (9) 2022 and 2023, and July (7) 2023. Note the differences in scales on the x and y axes for the plots between S1 to S3, which was done data comparison purposes between the two species.
Current usage metrics show cumulative count of Article Views (full-text article views including HTML views, PDF and ePub downloads, according to the available data) and Abstracts Views on Vision4Press platform.
Data correspond to usage on the plateform after 2015. The current usage metrics is available 48-96 hours after online publication and is updated daily on week days.
Initial download of the metrics may take a while.