| Issue |
Knowl. Manag. Aquat. Ecosyst.
Number 426, 2025
Anthropogenic impact on freshwater habitats, communities and ecosystem functioning
|
|
|---|---|---|
| Article Number | 12 | |
| Number of page(s) | 14 | |
| DOI | https://doi.org/10.1051/kmae/2025007 | |
| Published online | 13 May 2025 | |
Research Paper
Combined sewer overflows alter zooplankton communities in an urban river
Conservation Research Department, John G. Shedd Aquarium, Chicago, Illinois, USA
* Corresponding author: This email address is being protected from spambots. You need JavaScript enabled to view it.
Received:
6
February
2025
Accepted:
8
April
2025
Abstract
Combined sewer systems, common worldwide, transport both ‘stormwater’ and ‘wastewater’ within a single network. Many such systems include overflows, called Combined Sewer Overflows (CSOs), to prevent sewer pipes and treatment plants from being overwhelmed during heavy rainfall. In Chicago, IL, USA pumping stations actively discharge combined stormwater and wastewater into the Chicago River during extreme rain events. In 2023 12.3 billion litres of untreated stormwater and wastewater was discharged into the Chicago River, with 9.1 billion litres entering Bubbly Creek. Zooplankton populations were notably impacted: Chydoridae were eliminated, while Moinidae densities exceeded 300 individuals L−1. In contrast, zooplankton communities at other locations remained relatively unaffected. We suggest that sewage-derived nutrients fuelled a phytoplankton bloom, while low oxygen levels suppressed predators, allowing Moinidae populations to surge. This study provides in situ evidence that CSOs can significantly alter zooplankton communities in receiving water bodies.
Key words: Sewage / disturbance / community composition / urban ecosystems / pollution
© A. Happel and E. Rukstales, Published by EDP Sciences 2025
 This is an Open Access article distributed under the terms of the Creative Commons Attribution License CC-BY-ND (https://creativecommons.org/licenses/by-nd/4.0/), which permits unrestricted use, distribution, and reproduction in any medium, provided the original work is properly cited. If you remix, transform, or build upon the material, you may not distribute the modified material.
1 Introduction
Freshwater systems worldwide face threats from urbanization and anthropogenic chemical inputs, which reduce availability of high-quality habitat and in turn biodiversity (Vörösmarty et al., 2010; Albert et al., 2020). Riverine systems in particular are threatened due to their natural capacity for high biodiversity and their ubiquitous use by urban centres as waste disposal systems for domestic and industrial wastewaters as well as stormwater runoff (Booth et al., 2016; van Vliet et al., 2017). The rapid and direct delivery of stormwater from impervious urban surfaces represents a major driver of urban riverine ecosystems (Walsh et al., 2005). Water that is treated via reclamation plants, and discharged as effluent into waterways, creates downstream areas with species poor aquatic communities dominated by invasive species (Tetreault et al., 2013; Mccallum et al., 2019; Mehdi et al., 2020). A related yet understudied stressor affecting many urban waterbodies is the release of untreated wastewater and stormwater (Marques and Cunico, 2023). Raw sewage indicators have increased across two-thirds of all rivers in Africa, Asia, and Latin America over the last 30 years (UNEP, 2016), while direct outfalls of untreated sewage exist at roughly 650,000 locations in Europe and another 11,000 across the United States and Canada (Perry et al., 2023; US-EPA, 2023; Government of Canada, 2024). Releases of untreated wastewater represent a growing issue in freshwater ecology with relatively unknown consequences for aquatic communities and populations (Marques and Cunico, 2023).
Combined sewage outfalls (CSOs) allow the release of a mixture of untreated wastewater and urban runoff during intense rainfall events (Perry et al., 2023). Well-documented effects of CSOs on receiving waters include reduced dissolved oxygen for multiple days (Alp and Melching, 2009; Motta et al., 2010), altered distributions of pharmaceuticals (e.g. caffeine and ibuprofen), hormones (e.g., oestrogen), and pesticides (Phillips et al., 2012; Launay et al., 2016; Quijano et al., 2017; Munro et al., 2019), induced behavioural changes in fishes (Gaulke et al., 2015), and elevated pharmaceutical contaminants in fish tissues (Ramirez et al., 2009). While laboratory-based toxicity testing has clearly shown the risks associated with isolated components of effluents, mixtures of pharmaceuticals, pesticides, and hormones can have enhanced, synergistic toxicological effects (Cleuvers, 2004; Schnell et al., 2009). Few studies have documented biological responses of multicellular organisms to the ambient ‘cocktail’ released via combined sewer overflow events (Perry et al., 2023). In many urban areas with extensive combined sewer systems, existing records show increased frequency and magnitude of precipitation, suggesting that CSO events would continue to pose a problem in the future (Semadeni-Davies et al., 2008; Abdellatif et al., 2015; Gooré Bi et al., 2015; Roseboro et al., 2021). Despite all these valuable contributions, a knowledge gap remains regarding the risks that precipitation-induced CSO events pose to aquatic communities.
Zooplankton are often-overlooked indicators of an aquatic ecosystems health and resilience (Gannon and Stemberger, 1978; Jeppesen et al., 2011). With urbanisation frequently comes increased nutrient loads and heavy metal concentrations in local surface waters, which alter zooplankton communities toward smaller-bodied taxa (Shen et al., 2021). For example, high nutrient levels can lead to increased abundances of small cladocerans, cyclopoid copepods, and especially rotifers (McQueen et al., 1989; Moody and Wilkinson, 2019) and low oxygen levels reduce survival of copepods (Roman et al., 1993; Marcus, 2011). Pesticides have been shown to reduce abundances of larger zooplankton, such as Daphnia spp. and calanoid copepods (Hanazato, 2001). Conversely, Moina spp. has been found in untreated domestic sewage, living in high-density (>9000 L–1) monocultures despite persistent low oxygen levels, indicating some taxa capitalise on poor conditions (Janakiraman et al., 2024). As primary consumers, zooplankton play important roles in supporting higher trophic levels, particularly by linking phytoplankton to fish. Thus, changes in zooplankton composition may have cascading effects throughout the food chain (Chen et al., 2021b; Martin et al., 2022). Due to their critical role in food webs and trophic cascades, their rapid response to instream conditions, and the relative ease of sampling methodology, changes in zooplankton communities represent underappreciated endpoints to use when assessing environmental disturbances in urban waters, such as CSOs (Pinel-Alloul et al., 1995; Taylor et al., 2002; Cottenie et al., 2003; Carter et al., 2017).
The Chicago River (Illinois, USA) exhibits classic urban stream syndrome modifications seen worldwide, including shoreline armouring, dredging of materials, urban runoff, and a general lack of riparian areas (LimnoTech, 2010; Booth et al., 2016; Hill, 2019; Happel et al., 2024). In addition, the Chicago River is connected to a man-made canal system built through the Saint Lawrence continental divide to aid in the removal of water from the city (MWRD, 2008; Duncker and Johnson, 2015; Olson and Morton, 2017; Hill, 2019). The primary source of flow for the Chicago River is treated effluent from Chicago’s Terrence J. O’Brien Water Reclamation Plant (one of the largest in the world; Illinois Coastal Management Program, 2011; MWRD, 2019a; US Army Corps of Engineers − Chicago District, 2001), which, when combined with a lock-and-dam system, allows the river to flow over a continental divide, away from its original river mouth in Lake Michigan. While the Metropolitan Water Reclamation District of Greater Chicago (hereafter referred to as MWRD) maintains one of the most advanced storm- and wastewater management systems, including a network of interceptors, deep tunnels, and several water reclamation plants, CSOs still periodically discharge untreated water into the Chicago River ecosystem during intense storm events (Sinha et al., 2010; Duncker and Johnson, 2015; Chen et al., 2021a; Happel and Gallagher, 2022). As many of Chicago’s neighbourhoods were built near the water table, pumping stations were added to reduce flooding by discharging storm- and wastewater into the Chicago River. These pumping stations are capable of releasing billions of litres via discharge rates greater than 100 m3s−1 (Quijano et al., 2017). The activation of these pumping stations represents distinct, large-magnitude CSO events that can be used to assess the responses of zooplankton communities.
To assess the impact of CSO events on zooplankton communities, we conducted a monitoring study that sampled zooplankton at three distinct locations before and after a major CSO event in 2023. The selected locations represented different exposure levels to treated and untreated wastewater: (1) a distant control location within the North Branch of the Chicago River, primarily influenced by treated effluent; (2) our disturbed location, Bubbly Creek, which received the highest concentration of untreated CSO water via a pumping station; and (3) a nearby control location, the South Branch of the Chicago River, where waters from the first two locations converge. We hypothesised that zooplankton communities in the disturbed location would undergo the most pronounced changes due to the high volume of sewage input and the relatively stagnant flow conditions, whereas both control locations would exhibit comparatively few shifts in taxa abundance and community composition due to limited exposure to CSOs and water turnover rates. As cyclopoid abundance correlates positively with eutrophication, we suspected this species would increase in abundance in the disturbed location following the influx of nutrients in the CSO discharge. Conversely, we suspect sensitive taxa such as large Cladocera spp. will be eliminated from the location disturbed by the CSO event.
2 Methods
2.1 Study system
Prior to settlement, the Chicago River consisted of a North and South Branch, each draining a low-lying wetland system (Olson and Morton, 2017; Hill, 2019). By the late 1800s, it was used for transportation and sewage disposal, flowing into Lake Michigan, the city’s drinking water source (Olson and Morton, 2017; Hill, 2019). To prevent contamination, engineers reversed the river’s flow in 1900 via a canal system.
To aid this reversal, the North Shore Channel was built in the early 1900s. It receives inflow from Lake Michigan via sluice gates, as well as treated wastewater from the O’Brien Water Reclamation Plant, which serves 1.3 million people and processes 871 million litres of wastewater daily (∼10 m3s–1; MWRD, 2019a). The upper North Branch of the Chicago River adds surface water to the channel, continuing the flow towards the city centre and the Main Stem of the Chicago River, where sluice gates again allow water inflow from Lake Michigan.
The confluence of the lower North Branch and the Main Stem creates the South Branch of the Chicago River, which flows south-west into the Chicago Sanitary and Shipping Canal. This canal is wholly manmade and facilitates transportation and wastewater removal. Historically the South Branch had >12 barge slips; now, only 4 remain (two active, two inactive). Bubbly Creek was a drainage site for Chicago’s Union Stockyards until its closure in 1971. Decades of accumulating decomposing organic matter have led to very high sediment oxygen demand in Bubbly Creek (Waterman et al., 2011). The name “Bubbly Creek” from the ebullition caused by the decades of offal deposited into the aquatic environment, which can still sometimes be experienced (Viana et al., 2012, 2018).
Chicago has a combined sewer system, meaning stormwater and wastewater share pipes. Heavy rainfall events can overwhelm the system, causing untreated storm- and waste-water to flow into the Chicago River. During extreme rain events, pumping stations actively pull combined storm- and waste-waters out of low-lying neighbourhoods and sewers and discharge into the system. Chicago’s Tunnel and Reservoir Project aims to create enough storage capacity by 2030 such that untreated sewage is no longer released into the system.
The water in the Chicago River is primarily composed of treated effluent from the O’Brien Water Reclamation Plant. On average, ∼10 m3s–1 is discharged from the plant, whereas the upper North Branch of the Chicago River discharges only 1.1 m3 s−1 of surface water into the North Shore Channel (median of 2018–2024, USGS stream gauge 05536085). The lower North Branch of the Chicago River discharges 12.15 m3 s−1 (median of 2016–2024, USGS stream gauge 5536118) prior to meeting the western flowing Main Stem of the Chicago River which only discharges 0.62 m3 s−1. Together, these numbers indicate that the Chicago River is primarily composed of treated wastewater effluent, which flows at a sluggish rate of <0.03 m s−1 (Sinha et al., 2012). Bubbly Creek only experiences flow during times when the Racine Avenue Pumping Station is active (Duncker and Johnson, 2015; He, 2016).
Boat electrofishing surveys of the Chicago River indicate that the fish community is numerically dominated by Gizzard Shad (Dorosoma cepedianum), a native zooplanktivore (Happel and Gallagher, 2021; Happel, 2022). By biomass, the larger-bodied detritivore Common Carp (Cyprinus carpio) dominate. Together these two species comprise nearly half of the fish community in both abundance and biomass. There are other abundant cyprinid and centrarchid species that consume zooplankton within the system as well (Happel and Gallagher, 2021; Happel, 2022).
2.2 Study event
Between 25 June and 15 July 2023, 27.7 cm of rain fell, including approximately 10 cm within 24 hours on 2 July 2023 (as recorded at Midway Airport), overwhelming much of Chicago’s combined sewer system. To alleviate pressure in the sewage system and avoid flooding communities and homes, 6.6 ×10⁹ L (or 6.6 GL) of untreated waste- and storm-water were pumped into Bubbly Creek (aka, South Fork of the South Branch of the Chicago River, our ‘disturbed’ location) via the Racine Avenue pumping station over the course of 67 hours between 2 and 6 July. At the same time, 2.2 GL were pumped into the North Branch over 28.4 h. A second event occurred 12 July and 15 July 2023 where 2.5 GL was pumped into the disturbed site, Bubbly Creek.
2.3 Sampling methodology
MWRD maintains seven continuous dissolved oxygen monitoring stations (Eureka Manta2™ or Manta+™ Probes of Austin, Texas) within the Chicago River and North Shore Channel which are situated 1 m below the water surface (Minarik et al., 2024). We obtained data from MWRD from one station in each of our study locations —‘Far Control’, ‘Near Control’, and ‘Disturbed’ (Fig. 1). Oxygen concentrations (mg L−1) were plotted versus time for each of these stations in May through September, encompassing our sampling period. We calculated the percentage of hourly readings which were below 5 mg L−1 and below 2 mg L−1 for each week of the sampling period.
The MWRD also conducts monthly water quality testing across the Chicago River, including three sites within our far control, two within our near control, and one within the disturbed area. Water is sampled via stainless steel bucket and analysed back at the lab following EPA protocols (USEPA-approved methods listed in 40 CFR Parts 136, 141, and 145; MWRD, 2019b). Water quality variables of interest for this study included: dissolved oxygen (DO; mg L−1), water temperature (TEMP; °C), pH, total Kjeldahl nitrogen (TKN; mg L−1), ammonia-nitrogen (NH3_N; mg L−1), nitrite and nitrate (NO2.NO3; mg L−1), total phosphates (Tot.P; mg L−1), faecal coliform bacterial counts (FEC_COL; colonies per 100 ml), chlorophyll-a (chlorophyll-a; μg L−1).
Seven sites were chosen to represent the North and South Branches of the Chicago River for zooplankton sampling (Fig. 1). These included three sites on the North Shore Channel and North Branch (referred to as ‘Far Control’), two sites in the South Branch (referred to as ‘Near Control’), and two sites to represent the main Disturbed location, Bubbly Creek. All sites were accessible via a pier or wading, allowing sampling of water from a depth 0.6 m.
All sites were sampled between 09:30 and 15:00, typically in order from North to South, with some variation in the order of the southern sites that is not expected to affect results. Samples consisted of 20 L of sub-surface (top 0.6 m) water which was filtered through a 53 μm mesh sieve. Samples were collected via four grabs using a 5 L horizontal Niskin Bottle (General Oceanics) or by using 19 L and 1L buckets to compose 20 L. Collected organisms were then washed into 20 ml scintillation vials and preserved onsite with 90% denatured ethanol for later enumeration. A handheld YSI meter was used to collect data on temperature, conductivity, and dissolved oxygen during each sampling event. Samples were taken as close to the centre of the waterway as possible. Sites were visited approximately weekly between 8 June and 12 September 2023, for a total of 15 sample dates. As visible clouds of zooplankton were present on 27 July in the Disturbed location, two 20 L samples were taken via bucket to help account for potential variability in zooplankton numbers captured on this date. Video was also taken of these clouds, freely available online (https://doi.org/10.6084/m9.figshare.28212548). We sampled using both the Niskin bottle and bucket concomitantly on 1, 8, and 15 August to facilitate analysis of any differences in the communities or abundances they captured.
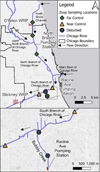 |
Fig. 1 Map of sampling locations where water quality and zooplankton were collected in 2023. Pumping stations active in 2023 are displayed. Locations of the T.J. O'Brien and Stickney Water Reclamation Plants (WRP) are included as they contribute much of the southern flow for the system (see text for discharge details). Colour figures available online. |
2.4 Lab methods
Zooplankton were enumerated under a dissection microscope using a gridded square Petri dish. Samples with large numbers of zooplankton were diluted to a known volume (i.e., 300 mL), and four subsamples were taken using a 10 mL Hensen–Stempel sampler following agitation. Subsample counts were adjusted to reflect the full 20 L sample volume, and averaged to obtain a value for that date, location, and sampling method combination. During lab work, a sample from 22 August was lost after one 10 mL subsample was counted (the beaker broke). We maintained this sample in the analysis despite lower confidence in community composition (78 individuals were counted, compared to a mean of 109, median of 45, and standard deviation of 171 across 139 samples). Zooplankton were classified into the following groups: Bosminidae, Calanoida, chironomid larvae, Cyclopoida, Chydoridae, other Daphniidae (including Scapholeberis spp., Daphnia lumholtzi, among others), Diaphanosoma (Sididae), Moinidae, Naididae, Ostracoda, Polyphemus pediculus (Polyphemidae); and the presence of nauplii and rotifers was noted but not counted.
2.5 Analysis methods
We used mixed-effect ANOVAs to compare before and after the sewage pumping event, as well as among locations, for our collected water quality and zooplankton data. We applied negative binomial models to assess taxa richness, total abundance, and individual species’ catches, and included site and date of capture as random effects (Brooks et al., 2017). We included an effect of sampling method in our models to account for the use of two different methods. Model fits were evaluated using the DHARMa package (Hartig, 2022), along with plots of observed versus predicted data (Wickham, 2016).
Moinidae data exhibited near-complete separation, before the release no individuals were found in the near control or disturbed locations, and only two samples in the far control contained individuals, which caused issues with model estimation. This was handled in two ways: 1) only assessing differences among locations after the sewage event, and 2) adding 1 to all Moinidae catches in a similar vein to using a log(x+1) transformation, as we are using negative binomial regressions with a log link function. comparisons among these models yielded similar statistical interpretations despite biasing mean estimation. We retained the latter model as the model formulation matched all other taxa assessed.
Significant interactions between the CSO event and locations were explored using post hoc testing (Lenth, 2022), and marginal means were displayed in figures included herein (Lüdecke, 2018). We were primarily interested in comparing before and after within each location, or alternatively among the three locations either before or after. Rather than conducting all 15 possible comparisons, multivariate t-tests were used to control for multiple comparisons within the the specific questions of interest (Lenth, 2022).
Changes in zooplankton community composition were assessed, using analysis of similarity tests (ANOSIM) and visualised using non-metric multidimensional scaling (nMDS). A dummy variable consisting of all 1s was added to the community data, as 1 sample had no zooplankton observed in it and otherwise would have to be excluded. Zooplankton count data were converted into community composition (i.e. relative abundance) data by standardising to sample’s total counts, and subsequently square root transforming (Hellinger transformation). Bray–Curtis similarities among samples were then used for both the ANOSIM testing and nMDS visualisation.
3 Results
Continuous (i.e. hourly) dissolved oxygen data from the far control location exhibited low oxygen (< 5.0 mg L–1) for only 21 records from May through September 2023, and the near control had 56 records < 5.0 mg L–1. Conversely, a total of 1,491 records at the disturbed site indicated oxygen concentrations < 5.0 mg L–1. From May through September, this equates to 40% of the hourly dissolved oxygen values in our disturbed location, primarily after the CSO event (Fig. 2). For comparison, in 2022 no CSO events occurred within our disturbed location and ≤ 5% of recordings across the year exhibited oxygen levels < 5.0 mg L–1 (Minarik et al., 2023). We display the continuous dissolved oxygen data as daily medians to ease interpretation from the visualisation (Fig. 2).
We present monthly water quality data collected by MWRD and use these visualisations to draw conclusions from but did not conduct statistical tests (Fig. 3). We note that chlorophyll-a at the disturbed location remained very high throughout June − August. We also note peaks in ammonia-nitrogen and total Kjeldahl nitrogen in July samples from the disturbed location but not elsewhere, suggesting a possible effect of the CSO discharge.
We conducted analyses on the water quality variables which were taken concurrently with the zooplankton samples. Water temperature at both control locations was significantly higher after the CSO event; however, this trend was not observed at the disturbed location (Fig. 4). Conversely, dissolved oxygen was lower and conductivity was higher following the sewage release at the disturbed location but not at control sites (Fig. 4). After the sewage release event, dissolved oxygen values < 5.0 mg L−1 occurred on 8 zooplankton sampling events in the disturbed location, and only once in each of the control locations.
Generally, five taxa (median = 5; quartile range = 4–6; range = 0–9), and 34 individuals (median = 34; quartile range = 17–90; range = 0–7,640) were found in each 20 L sample. We did not find significant effects of location or the CSO event on richness. Conversely, total zooplankton abundance was significantly altered by the CSO event at the disturbed location but not at the control locations (Fig. 5).
Taxon-specific regressions frequently revealed significant interactions between the CSO event and locations (Fig. 6), particularly when comparing before and after at the disturbed location. Cyclopoida and Moinidae significantly increased in abundance at the disturbed location after the sewage release, whereas Chydoridae significantly decreased. Following the CSO event Bosminidae significantly increased in the far control sites whereas Calanoids significantly decreased in the near control. Across the system other daphnids significantly increased following the CSO event.
Several taxa did not exhibit changes related to the CSO event and showed only geographical differences (Fig. 7). Both chironomids and naidids were significantly more abundant in the far control location, while Ostracoda and Diaphanosoma were significantly more abundant in the disturbed location. We did not find statistical evidence for differences in the abundance of Polyphemus pediculus; however, we note that none were found prior to the CSO event.
Multivariate analysis and visualisation (Fig. 8) revealed a shift in the zooplankton community at the disturbed site (ANOSIM R = 0.495, p < 0.001), while no significant change was observed at the control sites (R< 0.09, p > 0.16). This aligns with previous regression analyses of individual taxa. The 2D visualisation of zooplankton composition returned a stress value of 0.20 (Fig. 8), suggesting that careful interpretation is required. In nMDS space, samples from the disturbed location shifted from left (before the CSO event) to right (after the CSO event), while control locations showed no clear shift along nMDS1 or nMDS2. Additionally, post-CSO samples exhibited greater dispersion, contributing to the significant ANOSIM result. Species vectors indicate Moinidae correlates positively with nMDS1, whereas Chydoridae and Naididae correlate negatively.
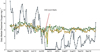 |
Fig. 2 Daily median dissolved oxygen (mg L−1) sampled hourly from each of the three locations zooplankton were also sampled from in 2023. Data provided by the Metropolitan Water Reclamation District of Greater Chicago. |
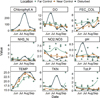 |
Fig. 3 Water quality variables from three locations within the Chicago River sampled once per month from May through September 2023. Data provided by the Metropolitan Water Reclamation District of Greater Chicago. Chlorophyll-a measured in μg L−1, Fecal Coliforms (FEC_COL; natural log transformed) as colonies per 100mL, temperature (TEMP) is in degrees Celsius, whereas all other variables are measured in mg L–1. Other abbreviations include dissolved oxygen (DO), ammonia-nitrogen (NH3_N), nitrite and nitrate (NO2.NO3), total Kjeldahl nitrogen (TKN), and total phosphorus (Tot.P). |
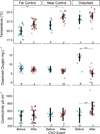 |
Fig. 4 Water temperature, dissolved oxygen, and conductivity measured alongside zooplankton sampling in the Chicago River before and after a major CSO event in 2023. Three locations were sampled, with the disturbed location receiving 9.1 billion litres over two weeks. Shared letters indicate statistical similarity among locations within each period (‘a/b’ before the CSO; ‘x/y’ after the CSO), while asterisks denote significant changes within locations before and after the event. |
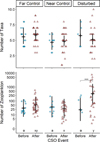 |
Fig. 5 Number of zooplankton taxa and total abundance of zooplankton sampled from the Chicago River before and after a large CSO event from three locations sampled in 2023. Three locations were sampled, with the disturbed location receiving 9.1 billion liters over two weeks. Sharing letters indicate similarities among locations within each period (‘a/b’ before CSO, ‘x/y’ after CSO), while asterisks denote significant changes within locations before and after the event. |
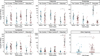 |
Fig. 6 Chicago River zooplankton taxa abundances which exhibited significant differences before and after a large CSO event based on samples from three locations in 2023. Three locations were sampled, with the disturbed location received 9.1 billion litres of untreated effluent over two weeks. Shared letters indicate statistical similarity among locations within each period (‘a/b’ before CSO, ‘x/y’ after CSO), while asterisks denote changes within locations before and after the event. |
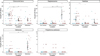 |
Fig. 7 Chicago River zooplankton taxa abundances which exhibited significant differences among locations but but not in response to a large CSO event in 2023. Three locations were sampled, with the disturbed location receiving 9.1 billion liters over two weeks. Asterisks denote significant differences among locations. |
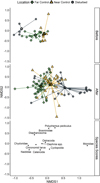 |
Fig. 8 Zooplankton community composition shifts shown via non-metric multidimensional scaling (nMDS) based on Hellinger-transformed count data and Bray–Curtis similarities. A single nMDS was faceted to compare pre- and post-CSO event communities, with a final facet displaying species correlation vectors. The 2D stress value was 0.20; see Results for further interpretation. |
4 Discussion
Our study demonstrates that replacement of chydorid Cladocera by Moinidae at a location which received 9.1 GL of combined untreated storm- and wastewater —our disturbed location, Bubbly Creek, in Chicago, Illinois. Furthermore, the densities reached by Moinidae (> 300 individuals L–1) following the release were several orders of magnitude higher than any other simultaneously sampled sites in the system (< 25 individuals L–1). In addition, numerous other population differences existed between disturbed and control locations during the study. For instance, Diaphanosoma and Ostracoda maintained higher abundances in the disturbed location compared with controls. While the whole Chicago River experienced some exposure to the CSO event, few populations changed in response to it outside of the disturbed location. For example, chironomid larvae and Naididae were more abundant at the far control location regardless of the CSO event. While each of these are statistically significant, taken together they are evidence that releases of untreated storm- and waste-water destabilise the relative abundance and taxonomic structure of zooplankton communities in natural surface waters.
The release of 9.1 GL of combined untreated storm- and waste-water significantly altered the water quality of the disturbed location for multiple weeks. Dissolved oxygen in the disturbed location remained at near 0 mg L–1 levels for approximately 30 days, then fluctuated between 1 and 5 mg L–1 for another 30 days (Fig. 2). Spikes in ammonia-nitrogen and total Kjeldahl nitrogen occured in the disturbed location in the weeks following the CSO event (Fig. 3). These patterns were absent in the control locations and illustrate that the disturbed location received large inputs of nitrogen, likely in the form of organic sewage wastes. The decomposition of organic nitrogenous waste is known to deplete dissolved oxygen in aquatic systems for weeks to months (Turner et al., 2005; Zhu et al., 2011). Increased oxygen demand downstream of the CSO outfalls is a commonly reported environmental impact (Daniel et al., 2002; Even et al., 2007; Miskewitz and Uchrin, 2013). Beyond the documented anoxic conditions, a myriad of potentially hazardous compounds which are common in domestic wastewater including biocides, endocrine disruptors, illicit drugs, and pharmaceuticals are likely discharged during CSO events (Gardner et al., 2012; Perry et al., 2023; Munro et al., 2019). Some estimates indicate that CSOs account for up to 95% of the annual loads for such contaminants in receiving waters (Phillips et al., 2012; Launay et al., 2016b). Therefore, it is difficult to ascribe species declines or tolerances to specific chemical compositions with our current observational data.
The changes in zooplankton populations shown at the disturbed location are due to the CSO event occurring during the growing season. The most drastic shifts in abundances—particularly of Chydoridae, Cyclopoida, and Moinidae— were exclusive to the disturbed location, suggesting the CSO event was the driving force. While the Chydorid population at the disturbed location relatively disappeared after the CSO event, the Cyclopoida and Moinidae populations appear to have boomed as a result of it. We note that in a separate light-trapping study of larval fish communities of the Chicago River, a large pulse of unidentified zooplankton was noted in 2021 four weeks after a 5.4 GL CSO event at the disturbed location (A. Happel unpublished data; video evidence of 2021 zooplankton bloom publicly viewable: https://doi.org/10.6084/m9.figshare.28146791.v2). Similar zooplankton population booms were not detected in 2022 surveys when no CSO events occurred in the Chicago River (A. Happel unpublished data). The Moinidae bloom we enumerated from the disturbed location was present for several sampling dates, suggesting that had it occurred in 2022 it would have been observed in the weekly light trapping efforts conducted by A. Happel between June through August in the study area. We take these field notes, combined with the data herein, as evidence that CSO events result in zooplankton blooms within receiving waters—specifically, in this case Bubbly Creek, Illinois, USA.
It is likely that Moinidae are present in the Chicago River system annually, but a mechanism associated with CSOs allowed the population densities to reach the high levels we documented. Moinidae occur in the Illinois River system, although typically in low abundances (up to 30 but more often < 10 per L–1) and have not been documented as the primary species contributing to samples with high macrozooplankton densities in the system (J. Parkos, Kaskaskia Biological Station, personal communication). Moinidae are thought to exploit favourable conditions, leveraging their short generation times, fast population growth rates through parthenogenesis, and tolerance of conditions unfavourable to other zooplankton—including hyper-eutrophic and sewage ponds or canals—to rapidly increase in density (Petrusek, 2002). In low-oxygen waters, Moinidae have been shown to upregulate haemoglobin synthesis to the point that they adopt a reddish body colour (Kato et al., 2001); reddish coloration was observed in the clouds of zooplankton recorded from Bubbly Creek in 2023, suggesting an adaptive response to hypoxic conditions (publicly viewable: https://doi.org/10.6084/m9.figshare.28212548.v1). Some Moinidae populations have even been shown to feed on animal manure and food waste (He et al., 2001; Kamrunnahar et al., 2019), including thriving in untreated sewage canals (Janakiraman et al., 2024) —environments theoretically similar to those produced by CSO releases (He et al., 2013). Water samples collected monthly by MWRD indicate ten times higher chlorophyll-a values (μg L–1; Fig. 3) at the disturbed location than control locations during June through September 2023. The highest chlorophyll-a concentration recorded by MWRD in 2023 was in the disturbed area (273.4 μg L−1) on 24 July, suggesting abundant phytoplankton resources, even as large zooplankton populations occurring 27 July. It is possible that the CSO event provided food either directly (i.e. manure, food waste, etc.) or nutrients to support an algal bloom and in turn supported dense Moinidae populations in the area that received the CSO.
In addition to increased resource availability, dense Moinidae populations may have been caused by a reduction in predation pressure. It has been shown that anoxic conditions caused by CSO events alter fish behaviour, including leaving and avoiding disturbed areas (Gaulke et al., 2015). Water quality data from the disturbed location indicate that dissolved oxygen remained < 5.0 mg L–1 for much of the time during the weeks following the event. Fish, including Gizzard Shad—the dominant zooplanktivore in the Chicago River—exhibit avoidance behaviour when dissolved oxygen levels fall below 5.0 mgL–1 (Pollock et al., 2007; Dillon et al., 2021). Gizzard Shad populations have been shown to regulate zooplankton communities (Stein et al., 1995; Vanni et al., 2005). Avoidance of CSO—disturbed areas by Gizzard Shad would reduce predation pressures on zooplankton and could facilitate the high population densities. We suspect that reduced predation pressure, combined with increased forage availability, contributed to the high Moinidae population densities documented.
Dissolved oxygen levels prior to the sewage release suggest that the disturbed location already supported prolific photosynthetic activity. Oxygen concentrations of > 5 mg L−1, while other Chicago River locations were around 8–10 mg L−1 suggest CSO events are not the sole source of nutrients for phytoplankton in the disturbed location (He, 2016). Sediment oxygen demand is high in the disturbed location, indicating that the decades of organic matter discharges from various sources (i.e., CSOs, Union Stock Yards, etc.) have led to an accumulation of decomposing organic matter within Bubbly Creek (Waterman et al., 2011). This organic sediment material also contains high concentrations of PAHs, PCBs, heavy metals and sulphides (Zhao et al., 2007). These compounds have been shown to increase in concentration in areas downstream of CSO outfalls elsewhere (Hnaťuková, 2011). The decomposition of organic sediments causes gas ebullition—where the name ‘Bubbly Creek’ came from—composed of various organic gases such as methane and hydrogen sulphide, and enhances aqueous contaminant concentrations (Viana et al., 2012, 2018). Attempts to model the dissolved oxygen and chlorophyll-a content in the disturbed location proved difficult, likely due to an inability to model and account for sediment sources phosphorus fuelling perpetual algal growth (He, 2016). We suspect that leaching of nutrients, or resuspension by disruption (i.e. ebullition, physical stirring from CSO flows, or fish activity), allows the disturbed location to maintain high phytoplankton populations resulting in the high mid-day dissolved oxygen values noted prior to the CSO event.
The lack of zooplankton population changes after the CSO event in control areas of the Chicago River system is due to differences in the magnitude and duration of exposure to untreated waters discharged. While the North Avenue Pumping station did discharge some 2.2 GL into the far control location the disturbed location received a total of 9.1 GL. Extensive periods of 2023 (20–25% of the whole year) in the disturbed location experienced low oxygen levels (≤ 5 mg L−1), whereas relatively rapid recoveries (< 36 h at a time) were noted in the control locations of our study (Minarik et al., 2024). For comparison most locations in the Chicago River exhibit hypoxia for a non-zero but ≤ 5% of the year even if no CSO events occur that year (Minarik et al., 2023). Flow in the disturbed location is essentially stagnant without the Racine Avenue Pumping Station being active —barring wind action —which contributes to the long duration of CSO effects within it (Duncker and Johnson, 2015). By contrast, flow at the control locations averages < 0.03 m s–1 (Sinha et al., 2012), which in theory would flush, or replace, the 21 km area we studied of untreated water in eight days days. The large amount of CSO wastewater discharged into the disturbed location combined with the lack of flow in that area likely contribute to the magnitude of zooplankton response and length of hypoxia compared to control locations.
Although chironomid larvae and Naididae were found across the Chicago River system, their higher abundances in the far control location may be due to increased proximity to the O’Brien WRP. Generally, larger abundances of Oligochaeta (especially Naididae) and Chironomidae are considered indicative of lower-quality environments, particularly when compositionally dominant (Learner et al., 1978; Lenat, 1983; Verdonschot, 2006; Arimoro et al., 2007). Abundances of chironomids and oligochaetes were also higher immediately downstream of the O’Brien WRP than elsewhere in the Chicago River in samples (both Ponar and Hester-Dendy methods) collected between 2001 and 2007 by MWRD (Baetis Environmental Services Inc. and LimnoTech Inc., 2009). Importantly, other species were also present in our samples from the far control location, and across those samples, chironomid larvae made up an average of ≤ 13% of organisms, Naididae even less. While the difference in abundance is interesting, compositionally, we do not have evidence that the zooplankton community in the far control location represents an impacted one.
Chydoridae represent small-bodied plankton taxa common in eutrophic waters where substrates are rich in organic matter (Fryer, 1968; Vijverberg and Boersma, 1997; Irvine, 2001). Chydorids appeared to favour areas with extensive phytoplankton blooms, especially cyanobacterial blooms (Vijverberg and Boersma, 1997; Bowen and Currie, 2017; Hann and Salki, 2017). We would expect the CSO event to increase organic matter within the disturbed area, particularly in the absence of flow allowing material to settle on the substrate (Motta et al., 2010; Sinha et al., 2010; He, 2016). Chlorophyll-a data also indicate extensive phytoplankton populations were present in the disturbed location throughout the summer. A favoured food resources were likely abundant, the loss of chydorids following the CSO event is surprising. While chydorids are typically associated with submerged structures (i.e. rocks, vegetation, substrates, etc.), they have been found free swimming (Whiteside, 1974). Despite being found free-swimming, chydorids are generally poor swimmers (Fryer, 1968). The high discharge velocity of the CSO (up to 175 m3s–1) into the disturbed location is known to scour the substrate (Viana et al., 2007; Quijano et al., 2017). This velocity and scouring may have removed Chydorids from the waterbody and reintroduction was hindered by poor swimming ability.
Diversity metrics of zooplankton communities may be poor indicators of environmental change. Each metric—richness, evenness, and diversity—is designed to capture different information about the community (Gallardo et al., 2011). Some have recommended the use of multiple indices to understand changes to an ecosystem (Lyashevska and Farnsworth, 2012). Others advocate maintaining an assemblage approach to better understand changes among communities (Kremen, 1992). We identified our taxa to varying levels of specificity, precluding the use of rigorous and varied biodiversity metrics. We also did not identify or count rotifers, which have been shown to be strong indicators of water quality conditions, including increasing in density with eutrophication and nutrient loading (Attayde and Bozelli, 1998; Lodi et al., 2011). However, our analysis using assemblages (i.e. multivariate analyses), despite the varied taxonomic resolution, captured a shift in the community due to a disturbance, offering evidence that assemblage-level methods can track ecosystem changes.
Our study of a single large precipitation event indicates that CSOs can alter zooplankton populations in receiving waters. Although CSO events are difficult to predict due to their reliance on heavy rainfall, ongoing monitoring efforts could help to elucidate other ecological responses to these events. A recent literature review found few, if any, published studies on responses of multicellular organisms to CSOs (Perry et al., 2023), indicating a gap in understanding the effects of urban developments on aquatic systems. The contaminant loading by CSOs can comprise a substantial proportion of annual loadings for systems (Phillips et al., 2012; Launay et al., 2016), and the infusion of such pollutants into food webs can potentially harm recreational users, especially anglers (Batt et al., 2017). Rainstorm intensity—a primary contributor to CSO events—is predicted to increase as a result of climate change, creating a scenario in which climate-driven change outpaces mitigation efforts (Widhalm et al., 2018; Wuebbles et al., 2021). Solving the issue of CSOs requires a combination of legislative, engineering, and consumer behavioural changes, all of which have associated costs (Quaranta et al., 2022; Perry et al., 2023). Continued documentation of the consequences of releases of untreated sewage, including CSOs, will be essential in evaluating the costs and benefits of mitigation strategies.
Acknowledgements
This material is based upon work supported by the U.S. Department of Agriculture, under agreement number NR235A12XXXXG002. We thank Dr. Andrew Casper (Illinois Natural History Survey) for providing critical feedback on earlier versions of this work, helping to shape the final product. We also thank the Metropolitan Water Reclamation District of Greater Chicago for sharing data on water quality and combined sewer overflow event magnitudes. We also thank the anonymous reviewers for their comments, which improved the clarity of our results and discussion.
Conflicts of interest
The authors do not claim any competing interests.
Data availability statement
Data and R-code supporting this work are publicly available on FigShare (https://doi.org/10.6084/m9.figshare.28212716).
References
- Abdellatif M, Atherton W, Alkhaddar RM, Osman YZ. 2015. Quantitative assessment of sewer overflow performance with climate change in northwest England. Hydrological Sciences Journal 60: 636–650. [CrossRef] [Google Scholar]
- Albert JS, Destouni G, Duke-Sylvester SM, Magurran AE, Oberdorff T, Reis RE, Winemiller KO, Ripple WJ. 2020. Scientists’ warning to humanity on the freshwater biodiversity crisis. Ambio. [Google Scholar]
- Alp E, Melching CS. 2009. Evaluation of the duration of storm effects on in-stream water quality. Journal of Water Resources Planning and Management 135: 107–116. [CrossRef] [Google Scholar]
- Arimoro FO, Ikomi RB, Iwegbue CMA. 2007. Water quality changes in relation to Diptera community patterns and diversity measured at an organic effluent-impacted stream in the Niger Delta, Nigeria. Ecological Indicators 7: 541–552. [CrossRef] [Google Scholar]
- Attayde JL, Bozelli RL. 1998. Assessing the indicator properties of zooplankton assemblages to disturbance gradients by canonical correspondence analysis. Canadian Journal of Fisheries and Aquatic Sciences 55: 1789–1797. [CrossRef] [Google Scholar]
- Baetis Environmental Services Inc. LimnoTech Inc. 2009. Characterisation of the macroinvertebrate community, Chicago Area Waterway System − habitat restoration evaluation and improvement study. Chicago. [Google Scholar]
- Batt AL, Wathen JB, Lazorchak JM, Olsen AR, Kincaid TM. 2017. Statistical survey of persistent organic pollutants: risk estimations to humans and wildlife through consumption of fish from U.S. rivers, graphical abstract, EPA public access. Environ Sci Technol 51: 3021–3031. [CrossRef] [PubMed] [Google Scholar]
- Booth DB, Roy AH, Smith B, Capps KA. 2016. Global perspectives on the urban stream syndrome. Freshwater Sci 35: 412–420. Chicago: University of Chicago Press. [CrossRef] [Google Scholar]
- Bowen KL, Currie WJS. Elevated zooplankton production in a eutrophic Lake Ontario embayment: Hamilton Harbour 2002–2014. Aquatic Ecosyst Health Manag 20: 230–241. Michigan State University Press. [Google Scholar]
- Brooks ME, Kristensen K, van Benthem KJ, Magnusson A, Berg CW, Nielsen A, Skaug HJ, Maechler M, Bolker BM. 2017. glmmTMB balances speed and flexibility among packages for zero-inflated generalized linear mixed modeling. R J 9: 378–400. [CrossRef] [Google Scholar]
- Carter JL, Schindler DE, Francis TB. 2017. Effects of climate change on zooplankton community interactions in an Alaskan lake. Clim Change Responses 4: 3. [CrossRef] [Google Scholar]
- Chen CY, Fytanidis DK, García MH. 2021a. Entrainment, transport, and fate of sediments during storm events in urban canals and rivers: case study on Bubbly Creek, Chicago. J Hydraul Eng 147: 05021005. [CrossRef] [Google Scholar]
- Chen M, Si Y, Han L, Liu X, Huang B, Kang CK. 2021b. Effect of prey selectivity and trophic cascades induced by mesozooplankton on the dynamics of phytoplankton. Mar Ecol Prog Ser 662: 35–51. [CrossRef] [Google Scholar]
- Cleuvers M. 2004. Mixture toxicity of the anti-inflammatory drugs diclofenac, ibuprofen, naproxen, and acetylsalicylic acid. Ecotoxicol Environ Saf 59: 309–315. [CrossRef] [PubMed] [Google Scholar]
- Cottenie K, Michels E, Nuytten N, De Meester L. 2003. Zooplankton metacommunity structure: regional vs. local processes in highly interconnected ponds. Ecology 84: 991–1000. [CrossRef] [Google Scholar]
- Daniel MHB, Montebelo AA, Bernardes MC, Ometto JPHB, de Camargo PB, Krusche AV, Ballester MV, Victoria RL, Martinelli LA. 2002. Effects of urban sewage on dissolved oxygen, dissolved inorganic and organic carbon, and electrical conductivity of small streams along a gradient of urbanization in the Piracicaba River Basin. Water, Air, and Soil Pollution 136: 189–206. [CrossRef] [Google Scholar]
- Dillon RA, Conroy JD, Lang KJ, Pangle KL, Ludsin SA. 2021. Bottom hypoxia alters the spatial distribution of pelagic intermediate consumers and their prey. Canadian Journal of Fisheries and Aquatic Sciences 78: 522–538. [CrossRef] [Google Scholar]
- Duncker JJ, Johnson KK. 2015. Hydrology of and current monitoring issues for the Chicago Area Waterway System, northeastern Illinois. Reston, VA. [Google Scholar]
- Even S, Mouchel JM, Servais P, Flipo N, Poulin M, Blanc S, Chabanel M, Paffoni C. 2007. Modelling the impacts of combined sewer overflows on the River Seine water quality. Sci Total Environ 375: 140–151. [CrossRef] [PubMed] [Google Scholar]
- Fryer G. 1968. Evolution and adaptive radiation in the Chydoridae (Crustacea: Cladocera): a study in comparative functional morphology and ecology. Philos Trans R Soc Lond B Biol Sci 254: 221–384. [CrossRef] [Google Scholar]
- Gallardo B, Gascón S, Quintana X, and Comín F. A. 2011. How to choose a biodiversity indicator-Redundancy and complementarity of biodiversity metrics in a freshwater ecosystem. Elsevier. Ecological indicators 11: 1177–1184. [CrossRef] [Google Scholar]
- Gannon JE, Stemberger RS. 1978. Zooplankton (especially crustaceans and rotifers) as indicators of water quality. Trans Am Microsc Soc 97: 16–35. [CrossRef] [Google Scholar]
- Gardner M, Comber S, Scrimshaw MD, Cartmell E, Lester J, Ellor B. 2012. The significance of hazardous chemicals in wastewater treatment works effluents. Sci Total Environ 437: 363–372. [CrossRef] [PubMed] [Google Scholar]
- Gaulke GL, Wolfe JR, Bradley DL, Moskus PE, Wahl DH, Suski CD. 2015. Behavioral and physiological responses of largemouth bass to rain-induced reductions in dissolved oxygen in an urban system. Trans Am Fish Soc 144: 927–941. [CrossRef] [Google Scholar]
- Gooré Bi E, Monette F, Gachon P, Gaspéri J, Perrodin Y. 2015. Quantitative and qualitative assessment of the impact of climate change on a combined sewer overflow and its receiving water body. Environ Sci Pollut Res 22: 11905–11921. [CrossRef] [PubMed] [Google Scholar]
- Government of Canada. 2024. Combined sewer overflow points − Wastewater systems effluent regulations − Open Government Portal. Available from: https://open.canada.ca/data/en/dataset/0d206ba7-1d8a-4480-b735-301dcd5c2483. [Google Scholar]
- Hanazato T. 2001. Pesticide effects on freshwater zooplankton: an ecological perspective. Environmental Pollution 112: 1–10. [CrossRef] [Google Scholar]
- Hann B., and Salki A. 2017. Patterns in the crustacean zooplankton community in Lake Winnipeg, Manitoba: Response to long-term environmental change. Journal of Great Lakes Research 43: 80–90. [CrossRef] [Google Scholar]
- Hann B, and Salki A. 2017. Patterns in the crustacean zooplankton community in Lake Winnipeg, Manitoba: Response to long-term environmental change. Journal of Great Lakes Research 43: 80–90. [CrossRef] [Google Scholar]
- Happel A., and Gallagher D. 2021. Chicago’s fish assemblage over ∼30 years − more fish and more native species. Urban Ecosystems 24: 311–325. https://doi.org/10.1007/s11252-020-01020-3. [CrossRef] [Google Scholar]
- Happel A., and Gallagher D. 2022. Decreases in wastewater pollutants increased fish diversity of Chicago’s waterways. Science of The Total Environment 824: 153776. https://doi.org/10.1016/j.scitotenv.2022.153776. [CrossRef] [Google Scholar]
- Happel A., Lederman N., and Snyder C. 2024. Natural shorelines support greater diversity and abundances of fishes than armoured shores along Chicago’s waterways. Aquatic Conservation: Marine and Freshwater Ecosystems 34: e4158. [CrossRef] [Google Scholar]
- Hartig F. 2022. DHARMa: Residual diagnostics for hierarchical (multi-level / mixed) regression models. Available from: https://cran.r-project.org/web/packages/DHARMa/index.html. [Google Scholar]
- He C., DeMarchi C., Tao W., and Johengen T. H. 2013. Modeling distribution of point and nonpoint sources pollution loadings in the Saginaw Bay watersheds, Michigan. In: Geospatial tools for urban water resources. Dordrecht: Springer, pp. 97–113. https://doi.org/10.1007/978-94-007-4734-0_6. [Google Scholar]
- He Y. 2016. Implementation of a three-dimensional eutrophication model of Bubbly Creek, Chicago, Illinois. Unpublished report. [Google Scholar]
- He Z. H., Qin J. G., Wang Y., Jiang H., and Wen Z. 2001. Biology of Moina mongolica (Moinidae, Cladocera) and perspective as live food for marine fish larvae: Review. Hydrobiologia 457: 25–37. [CrossRef] [Google Scholar]
- Hill L. 2019. The Chicago River: A Natural and Unnatural History. Southern Illinois University Press. [Google Scholar]
- Hnaťuková P. 2011. Geochemical distribution and mobility of heavy metals in sediments of urban streams affected by combined sewer overflows. Journal of Hydrology and Hydromechanics 59: 85–94. [CrossRef] [Google Scholar]
- Illinois Coastal Management Program. 2011. Illinois Coastal Management Program Issue Paper: Chicago River and North Shore Channel Corridors. pp. 1–22. Available from: http://www.chicagoareawaterways.org/documents/CAWS-UAA-DRAFT-REPORT.pdf [Google Scholar]
- Irvine K. 2001. The response of three chydorid species to temperature, pH and food. Hydrobiologia 453: 195–202. [Google Scholar]
- Janakiraman A., Thangaraj S., Gokula V., and Stalin A. 2024. Report on high-density population of a Cladoceran, Moina macrocopa, and their gut microbes in anoxic sewage water: a potential bio-indicator of aquatic pollution. Aquatic Ecology 58: 1255–1265. [CrossRef] [Google Scholar]
- Jeppesen E., Nõges P., Davidson T. A., Haberman J., Nõges T., Blank K., Lauridsen T. L., Søndergaard M., Sayer C., and Laugaste R. 2011. Zooplankton as indicators in lakes: a scientific-based plea for including zooplankton in the ecological quality assessment of lakes according to the European Water Framework Directive (WFD). Hydrobiologia 676: 279–297. [CrossRef] [Google Scholar]
- Kamrunnahar K., Md A., Jeong U. C., and Kang S. J. 2019. Mass culture of Moina macrocopa using organic waste and its feeding effects on the performance of Pagrus major larvae. Egyptian Journal of Aquatic Research 45: 75–80. [CrossRef] [Google Scholar]
- Kato K., Tokishita S. I., Mandokoro Y., Kimura S., Ohta T., Kobayashi M., and Yamagata H. 2001. Two-domain hemoglobin gene of the water flea Moina macrocopa: duplication in the ancestral Cladocera, diversification, and loss of a bridge intron. Gene 273: 41–50. [CrossRef] [PubMed] [Google Scholar]
- Kremen C. 1992. Assessing the indicator properties of species assemblages for natural areas monitoring. Ecological Applications 2: 203–217. [CrossRef] [PubMed] [Google Scholar]
- Launay M. A., Dittmer U., and Steinmetz H. 2016. Organic micropollutants discharged by combined sewer overflows-characterisation of pollutant sources and stormwater-related processes. Water Research 104: 82–92. [CrossRef] [PubMed] [Google Scholar]
- Learner M. A., Lochhead G., and Hughes B. D. 1978. A review of the biology of British Naididae (Oligochaeta) with emphasis on the lotic environment. Freshwater Biology 8: 357–375. [CrossRef] [Google Scholar]
- Lenat D. R. 1983. Chironomid taxa richness: Natural variation and use in pollution assessment. Freshwater Invertebrate Biology 2: 192–198. [CrossRef] [Google Scholar]
- Lenth R. V. 2022. Emmeans: Estimated marginal means, aka least-squares means. [Google Scholar]
- LimnoTech. 2010. Chicago Area Waterway System Habitat Evaluation and Improvement Study: Habitat Evaluation Report. Ann Arbor, MI. Available from: https://mwrd.org/sites/default/files/documents/Habitat_Improvement_Report_FINAL_1-4-10.pdf. [Google Scholar]
- Lodi S, Cardoso Galli Vieira L, Felipe Machado Velho L, Costa Bonecker C, de Carvalho P, Bini LM. 2011. Zooplankton community metrics as indicators of eutrophication in urban lakes. Brazilian Journal of Nature Conservation Research Letters Natureza and Conservação 9: 87–92. [Google Scholar]
- Lüdecke D. 2018. Ggeffects: Tidy data frames of marginal effects from regression models. Journal of Open Source Software 3: 772. [CrossRef] [Google Scholar]
- Lyashevska O, Farnsworth KD. 2012. How many dimensions of biodiversity do we need? Ecological Indicators 18: 485–492. [CrossRef] [Google Scholar]
- Marcus NH. 2011. Zooplankton: Responses to and consequences of hypoxia. In: Geophysical Monograph Series, American Geophysical Union (AGU), pp. 49–60. Available from: https://doi.org/10.1029/CE058P0049. [Google Scholar]
- Marques P, Cunico A. 2023. Integrating the influence of untreated sewage into our understanding of the urban stream syndrome. Freshwater Sci 42: 195–203. Chicago, IL: The University of Chicago Press. [CrossRef] [Google Scholar]
- Martin BE, Walsh JR, Vander Zanden MJ. 2022. Rise of a native apex predator and an invasive zooplankton cause successive ecological regime shifts in a North Temperate Lake. Limnol Oceanogr 67: S163–S172. [CrossRef] [Google Scholar]
- McCallum ES, Nikel KE, Mehdi H, Du SN, Bowman JE, Midwood JD, Kidd KA, Scott GR, Balshine S. 2019. Municipal wastewater effluent affects fish communities: A multi-year study involving two wastewater treatment plants. Environ Pollut 255: 113118. [Google Scholar]
- McQueen DJ, Johannes MRS, Post JR, Stewart TJ, Lean DR. 1989. Bottom‐up and top‐down impacts on freshwater pelagic community structure. Ecol Monogr 59: 289–309. [CrossRef] [Google Scholar]
- Mehdi H, Lau SC, Synyshyn C, Salena MG, McCallum ES, Muzzatti MN, Bowman JE, Mataya K, Bragg LM, Servos MR, Kidd KA, Scott GR, Balshine S. 2020. Municipal wastewater as an ecological trap: Effects on fish communities across seasons. Sci Total Environ 714: 143430. [Google Scholar]
- Minarik TA, Gallagher DW, Kollias NJ, Vick JA, Podczerwinski EW. 2023. Report No. 23-34: Continuous dissolved oxygen monitoring in the service area of the Metropolitan Water Reclamation District of Greater Chicago during 2022. Chicago. [Google Scholar]
- Minarik TA, Gallagher DW, Kollias NJ, Vick JA, Podczerwinski EW. 2024. Report No. 24-32: Continuous dissolved oxygen monitoring in the service area of the Metropolitan Water Reclamation District of Greater Chicago during 2023. Chicago. [Google Scholar]
- Miskewitz R, Uchrin C. 2013. In-stream dissolved oxygen impacts and sediment oxygen demand resulting from combined sewer overflow discharges. Journal of Environmental Engineering 139: 1307–1313. [CrossRef] [Google Scholar]
- Moody EK, Wilkinson GM 2019. Functional shifts in lake zooplankton communities with hypereutrophication. Freshwater Biology 64: 608–616. [CrossRef] [Google Scholar]
- Motta D, Abad JD, García MH. 2010. Modeling framework for organic sediment resuspension and oxygen demand: Case of Bubbly Creek in Chicago. Journal of Environmental Engineering 136: 952–964. Available from: https://doi.org/10.1061/(ASCE)EE1943-7870.0000228. [CrossRef] [Google Scholar]
- Munro K, Martins CPB, Loewenthal M, Comber S, Cowan DA, Pereira L, Barron LP. 2019. Evaluation of combined sewer overflow impacts on short-term pharmaceutical and illicit drug occurrence in a heavily urbanised tidal river catchment (London, UK). Science of the Total Environment 657: 1099–1111. Available from: https://doi.org/10.1016/J.SCITOTENV2018.12.108. [CrossRef] [Google Scholar]
- MWRD, 2008. Description of the Chicago waterways system for the use of attainability analysis. 1–23. [Google Scholar]
- MWRD. 2019a. Terrence J. O’Brien Water Reclamation Plant, Metropolitan Water Reclamation District of Greater Chicago Fact Sheet. [Google Scholar]
- MWRD. 2019b. Ambient Water Quality Monitoring Quality Assurance Project Plan, Revision 2.6. [Google Scholar]
- Olson KR, and Morton LW. 2017. Chicago’s 132-year effort to provide safe drinking water. Journal of Soil and Water Conservation 72: 19A–25A. https://doi.org/10.2489/jswc.72.2.19A. [Google Scholar]
- Perry W.B. Ahmadian R. Munday M. Jones O. Ormerod S.J. and Durance I. 2023. Addressing the challenges of combined sewer overflows. Environmental Pollution 343: 123225. https://doi.org/10.1016/j.envpol.2023.123225. [Google Scholar]
- Petrusek A. 2002. Moina (Crustacea: Anomopoda, Moinidae) in the Czech Republic: a review. Acta Societatis Zoologicae Bohemicae 66: 213–220. [Google Scholar]
- Phillips P. J., Chalmers A. T., Gray J. L., Kolpin D. W., Foreman W. T., and Wall G. R.. 2012. Combined sewer overflows: An environmental source of hormones and wastewater micropollutants. Environmental Science and Technology 46: 5336–5343. https://doi.org/10.1021/es3001294. [CrossRef] [PubMed] [Google Scholar]
- Pinel-Alloul B., Niyonsenga T., Legendre P., and Gril G.. 1995. Spatial and environmental components of freshwater zooplankton structure. Ecoscience 2: 1–19. https://doi.org/10.1080/11956860.1995.11682263. [CrossRef] [Google Scholar]
- Pollock M. S., Clarke L. M. J., and Dubé M. G.. 2007. The effects of hypoxia on fishes: from ecological relevance to physiological effects. Environmental Reviews 15: 1–14. https://doi.org/10.1139/a06-006. [CrossRef] [Google Scholar]
- Quaranta E., Fuchs S., Liefting H. J., Schellart A., and Pistocchi A.. 2022. Costs and benefits of combined sewer overflow management strategies at the European scale. Journal of Environmental Management 318: 115629. https://doi.org/10.1016/j.jenvman.2022.115629. [CrossRef] [PubMed] [Google Scholar]
- Quijano J. C., Zhu Z., Morales V., Landry B. J., and Garcia M. H.. 2017. Three-dimensional model to capture the fate and transport of combined sewer overflow discharges: A case study in the Chicago Area Waterway System. Science of the Total Environment 576: 362–373. https://doi.org/10.1016/j.scitotenv.2016.08.191. [CrossRef] [Google Scholar]
- Ramirez A. J., Brain R. A., Usenko S., Mottaleb M. A., O’Donnell J. G., Stahl L. L., Wathen J. B., Snyder B. D., Pitt J. L., and Perez‐Hurtado P.. 2009. Occurrence of pharmaceuticals and personal care products in fish: results of a national pilot study in the United States. Environmental Toxicology and Chemistry 28: 2587–2597. https://doi.org/10.1897/08-561.1. [CrossRef] [PubMed] [Google Scholar]
- Roman M. R., Gauzens A. L., Rhinehart W. K., and White J. R.. 1993. Effects of low oxygen waters on Chesapeake Bay zooplankton. Limnology and Oceanography 38: 1603–1614. https://doi.org/10.4319/lo.1993.38.8.1603. [CrossRef] [Google Scholar]
- Roseboro A., Torres M. N., Zhu Z., and Rabideau A. J.. 2021. The impacts of climate change and porous pavements on combined sewer overflows: A case study of the city of Buffalo, New York, USA. Frontiers in Water 3: 725174. https://doi.org/10.3389/FRWA.2021.725174/BIBTEX. [CrossRef] [Google Scholar]
- Schnell S., Bols N. C., Barata C., and Porte C.. 2009. Single and combined toxicity of pharmaceuticals and personal care products (PPCPs) on the rainbow trout liver cell line RTL- W1. Aquatic Toxicology 93: 244–252. https://doi.org/10.1016/j.aquatox.2009.05.007. [CrossRef] [Google Scholar]
- Semadeni-Davies A., Hernebring C., Svensson G., and Gustafsson L. G.. 2008. The impacts of climate change and urbanisation on drainage in Helsingborg, Sweden: Combined sewer system. Journal of Hydrology 350: 100–113. https://doi.org/10.1016/J.JHYDROL.2007.05.028. [CrossRef] [Google Scholar]
- Shen J., Qin G., Yu R., Zhao Y., Yang J., An S., Liu R., Leng X., and Wan Y.. 2021. Urbanization has changed the distribution pattern of zooplankton species diversity and the structure of functional groups. Ecological Indicators 120: 106944. https://doi.org/10.1016/J.ECOLIND.2020.106944. [CrossRef] [Google Scholar]
- Sinha S., Liu X., and Garcia M. H.. 2010. Three-dimensional hydrodynamic and water quality modeling of a CSO event in Bubbly Creek, Chicago, IL. In: Riverflow-2010 conference, pp. 1556–1564. [Google Scholar]
- Sinha S., Liu X., and Garcia M. H.. 2012. Three-dimensional hydrodynamic modeling of the Chicago River, Illinois. Environmental fluid mechanics 12: 471–494. Springer. [CrossRef] [Google Scholar]
- Stein R. A., DeVries D. R., and Dettmers J. M.. 1995. Food-web regulation by a planktivore: exploring the generality of the trophic cascade hypothesis. Canadian Journal of Fisheries and Aquatic Sciences 52: 2518–2526. NRC Research Press, Ottawa, Canada. https://doi.org/10.1139/f95-842. [CrossRef] [Google Scholar]
- Taylor A. H., Allen J., and Clark P. A.. 2002. Extraction of a weak climatic signal by an ecosystem. Nature 416: 629–632. Nature Publishing Group. https://doi.org/10.1038/416629a. [CrossRef] [PubMed] [Google Scholar]
- Tetreault G. R., Brown C. J. M., Bennett C. J., Oakes K. D., McMaster M. E., and Servos M. R. 2013. Fish community responses to multiple municipal wastewater inputs in a watershed. Integrated Environmental Assessment and Management 9: 456–468. [CrossRef] [PubMed] [Google Scholar]
- Turner R. E., Rabalais N. N., Swenson E. M., Kasprzak M., and Romaire T. 2005. Summer hypoxia in the northern Gulf of Mexico and its prediction from 1978 to 1995. Marine Environmental Research 59: 65–77. https://doi.org/10.1016/J.MARENVRES2003.09.002. [CrossRef] [PubMed] [Google Scholar]
- UNEP, A., 2016. A snapshot of the world’s water quality: towards a global assessment. Nairobi, United Nations Environment Programme. [Google Scholar]
- US Army Corps of Engineers − Chicago District. 2001. Lake Michigan Diversion Accounting − Water Year 2001 Report. Chicago. [Google Scholar]
- US-EPA. 2023. EPA’s National Combined Sewer Overflow Inventory Summary | ECHO | US EPA. Available from: https://echo.epa.gov/tools/data-downloads/cso-inventory-summary. [Google Scholar]
- Vanni MJ, Arend KK, Bremigan MT, Bunnell DB, Garvey JE, Gonzalez MJ, Renwick WH, Soranno PA, Stein RA. 2005. Linking landscapes and food webs: effects of omnivorous fish and watersheds on reservoir ecosystems. BioScience 55: 155–167. https://doi.org/10.1641/0006-3568(2005)055[0155:LLAFWE]2.0.CO;2. [CrossRef] [Google Scholar]
- van Vliet MTH, Flörke M, Wada Y. 2017. Quality matters for water scarcity. Nature Geoscience 10: 800–802. https://doi.org/10.1038/ngeo3047. [CrossRef] [Google Scholar]
- Verdonschot PFM. 2006. Beyond masses and blooms: The indicative value of oligochaetes. https://doi.org/10.1007/1-4020-5368-1_13. [Google Scholar]
- Viana P, Yin K, Rockne K. 2012. Field measurements and modeling of ebullition-facilitated flux of heavy metals and polycyclic aromatic hydrocarbons from sediments to the water column. Environmental Science and Technology 46: 12046–12054. https://doi.org/10.1021/es302579e. [CrossRef] [PubMed] [Google Scholar]
- Viana P, Yin K, Rockne K. 2018. Comparison of direct benthic flux to ebullition-facilitated flux of polycyclic aromatic hydrocarbons and heavy metals measured in the field. Journal of Soils and Sediments 18: 1729–1742. https://doi.org/10.1007/S11368-017-1893-Z/METRICS. [CrossRef] [Google Scholar]
- Viana P, Yin K, Zhao X, Rockne K. 2007. Active sediment capping for pollutant mixtures: Control of biogenic gas production under highly intermittent flows. Land Contamination and Reclamation 15: 413. [CrossRef] [Google Scholar]
- Vijverberg J, Boersma M. 1997. Long-term dynamics of small-bodied and large-bodied Cladocerans during the eutrophication of a shallow reservoir, with special attention for Chydorus sphaericus. Hydrobiologia 360: 233–242. https://doi.org/10.1007/978-94-011-4964-8_26. [CrossRef] [Google Scholar]
- Vörösmarty CJ, McIntyre PB, Gessner MO, Dudgeon D, Prusevich A, Green P, Glidden S, Bunn SE, Sullivan CA, Liermann CR, Davies PM. 2010. Global threats to human water security and river biodiversity. Nature 467: 555–561. https://doi.org/10.1038/nature09440. [CrossRef] [PubMed] [Google Scholar]
- Walsh CJ, Roy AH, Feminella JW, Cottingham PD, Groffman PM, Morgan RP. 2005. The urban stream syndrome: current knowledge and the search for a cure. Journal of the North American Benthological Society 24: 706–723. https://doi.org/10.1899/04-028.1. [CrossRef] [Google Scholar]
- Waterman DM, Waratuke AR, Motta D, Cataño-Lopera YA, Zhang H, García MH. 2011. In situ characterization of resuspended-sediment oxygen demand in Bubbly Creek, Chicago, Illinois. Journal of Environmental Engineering 137: 717–730. https://doi.org/10.1061/(ASCE)EE1943-7870.0000382. [CrossRef] [Google Scholar]
- Whiteside MC. 1974. Chydorid (Cladocera) ecology: seasonal patterns and abundance of populations in Elk Lake, Minnesota. Ecology 55: 538–550. https://doi.org/10.2307/1935145. [CrossRef] [Google Scholar]
- Wickham H. 2016. ggplot2: Elegant graphics for data analysis. New York: Springer-Verlag. [Google Scholar]
- Widhalm M, Hamlet A, Byun K, Robeson S, Baldwin M, Staten P, Chiu C, Coleman J, Hall E, Hoogewind K. 2018. Indiana's past and future climate: A report from the Indiana climate change impacts assessment. Indiana: Purdue University. [Google Scholar]
- Wuebbles DJ, Angel JR, Petersen K, Lemke AM. 2021. An assessment of the impacts of climate change in Illinois. Illinois: The Nature Conservancy. [Google Scholar]
- Zhao X, Viana P, Yin K, Rockne K, Hey D, Schuh J, Lanyon R. 2007. Combined active capping/wetland demonstration in the Chicago River. In: Proceedings of the Fourth International Conference on Remediation of Contaminated Sediments. Columbus (OH): Battelle Press. [Google Scholar]
- Zhu ZY, Zhang J, Wu Y, Zhang YY, Lin J, Liu SM. 2011. Hypoxia off the Changjiang (Yangtze River) Estuary: Oxygen depletion and organic matter decomposition. Marine Chemistry 125: 108–116. [CrossRef] [Google Scholar]
Cite this article as: Happel A, Rukstales E. 2025. Combined sewer overflows alter zooplankton communities in an urban river. Knowl. Manag. Aquat. Ecosyst., 426, 12. https://doi.org/10.1051/kmae/2025007.
All Figures
|
Fig. 1 Map of sampling locations where water quality and zooplankton were collected in 2023. Pumping stations active in 2023 are displayed. Locations of the T.J. O'Brien and Stickney Water Reclamation Plants (WRP) are included as they contribute much of the southern flow for the system (see text for discharge details). Colour figures available online. |
| In the text | |
|
Fig. 2 Daily median dissolved oxygen (mg L−1) sampled hourly from each of the three locations zooplankton were also sampled from in 2023. Data provided by the Metropolitan Water Reclamation District of Greater Chicago. |
| In the text | |
|
Fig. 3 Water quality variables from three locations within the Chicago River sampled once per month from May through September 2023. Data provided by the Metropolitan Water Reclamation District of Greater Chicago. Chlorophyll-a measured in μg L−1, Fecal Coliforms (FEC_COL; natural log transformed) as colonies per 100mL, temperature (TEMP) is in degrees Celsius, whereas all other variables are measured in mg L–1. Other abbreviations include dissolved oxygen (DO), ammonia-nitrogen (NH3_N), nitrite and nitrate (NO2.NO3), total Kjeldahl nitrogen (TKN), and total phosphorus (Tot.P). |
| In the text | |
|
Fig. 4 Water temperature, dissolved oxygen, and conductivity measured alongside zooplankton sampling in the Chicago River before and after a major CSO event in 2023. Three locations were sampled, with the disturbed location receiving 9.1 billion litres over two weeks. Shared letters indicate statistical similarity among locations within each period (‘a/b’ before the CSO; ‘x/y’ after the CSO), while asterisks denote significant changes within locations before and after the event. |
| In the text | |
|
Fig. 5 Number of zooplankton taxa and total abundance of zooplankton sampled from the Chicago River before and after a large CSO event from three locations sampled in 2023. Three locations were sampled, with the disturbed location receiving 9.1 billion liters over two weeks. Sharing letters indicate similarities among locations within each period (‘a/b’ before CSO, ‘x/y’ after CSO), while asterisks denote significant changes within locations before and after the event. |
| In the text | |
|
Fig. 6 Chicago River zooplankton taxa abundances which exhibited significant differences before and after a large CSO event based on samples from three locations in 2023. Three locations were sampled, with the disturbed location received 9.1 billion litres of untreated effluent over two weeks. Shared letters indicate statistical similarity among locations within each period (‘a/b’ before CSO, ‘x/y’ after CSO), while asterisks denote changes within locations before and after the event. |
| In the text | |
|
Fig. 7 Chicago River zooplankton taxa abundances which exhibited significant differences among locations but but not in response to a large CSO event in 2023. Three locations were sampled, with the disturbed location receiving 9.1 billion liters over two weeks. Asterisks denote significant differences among locations. |
| In the text | |
|
Fig. 8 Zooplankton community composition shifts shown via non-metric multidimensional scaling (nMDS) based on Hellinger-transformed count data and Bray–Curtis similarities. A single nMDS was faceted to compare pre- and post-CSO event communities, with a final facet displaying species correlation vectors. The 2D stress value was 0.20; see Results for further interpretation. |
| In the text | |
Current usage metrics show cumulative count of Article Views (full-text article views including HTML views, PDF and ePub downloads, according to the available data) and Abstracts Views on Vision4Press platform.
Data correspond to usage on the plateform after 2015. The current usage metrics is available 48-96 hours after online publication and is updated daily on week days.
Initial download of the metrics may take a while.