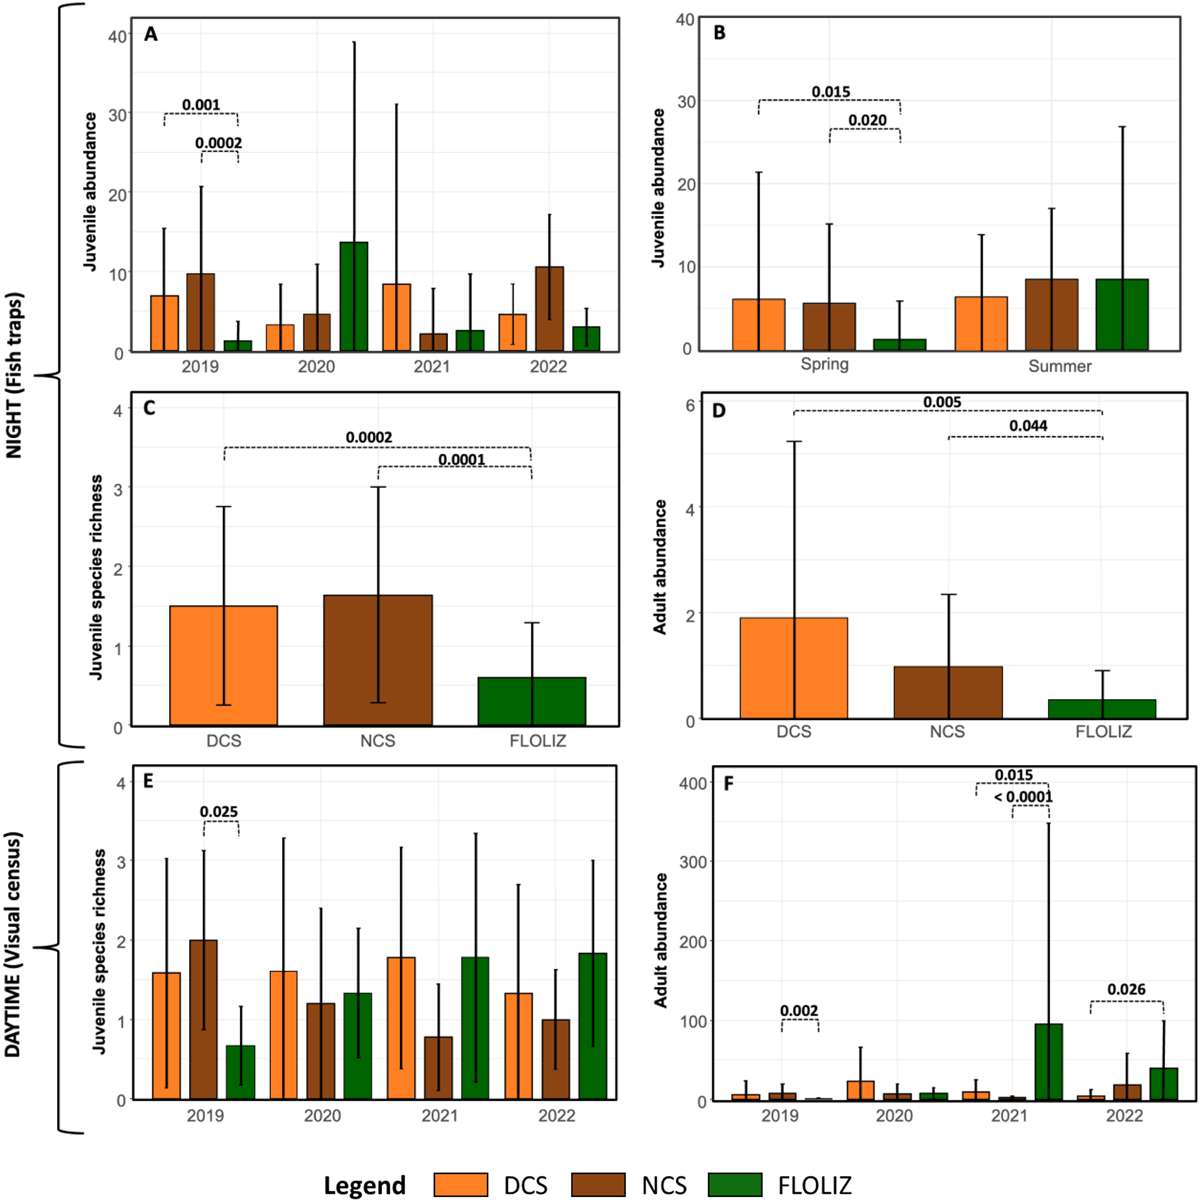
Fig. 4
Download original image
Comparison of fish abundance and species richness at night (fish trap) and daytime (visual census). Only significant effects from the deviance analysis in Table 1 and ones that involve the type of station have been detailed to focus on the station effect. (A) Mean juvenile fish abundance (+ SD) between the different type of stations (DCS, NCS, FLOLIZ) according to year; (B) Mean juvenile fish abundance (+ SD) between the different type of stations (DCS, NCS, FLOLIZ) according to season; (C) Mean juvenile fish richness (+ SD) between the different type of stations; (D) Mean adult fish abundance (+ SD) between the different type of stations; (E) Mean adult fish richness (+ SD) between the different type of stations (DCS, NCS, FLOLIZ) according to year; (F) Mean adult fish abundance (+ SD) between the different type of stations (DCS, NCS, FLOLIZ) according to year.
Current usage metrics show cumulative count of Article Views (full-text article views including HTML views, PDF and ePub downloads, according to the available data) and Abstracts Views on Vision4Press platform.
Data correspond to usage on the plateform after 2015. The current usage metrics is available 48-96 hours after online publication and is updated daily on week days.
Initial download of the metrics may take a while.