Fig. 3
Download original image
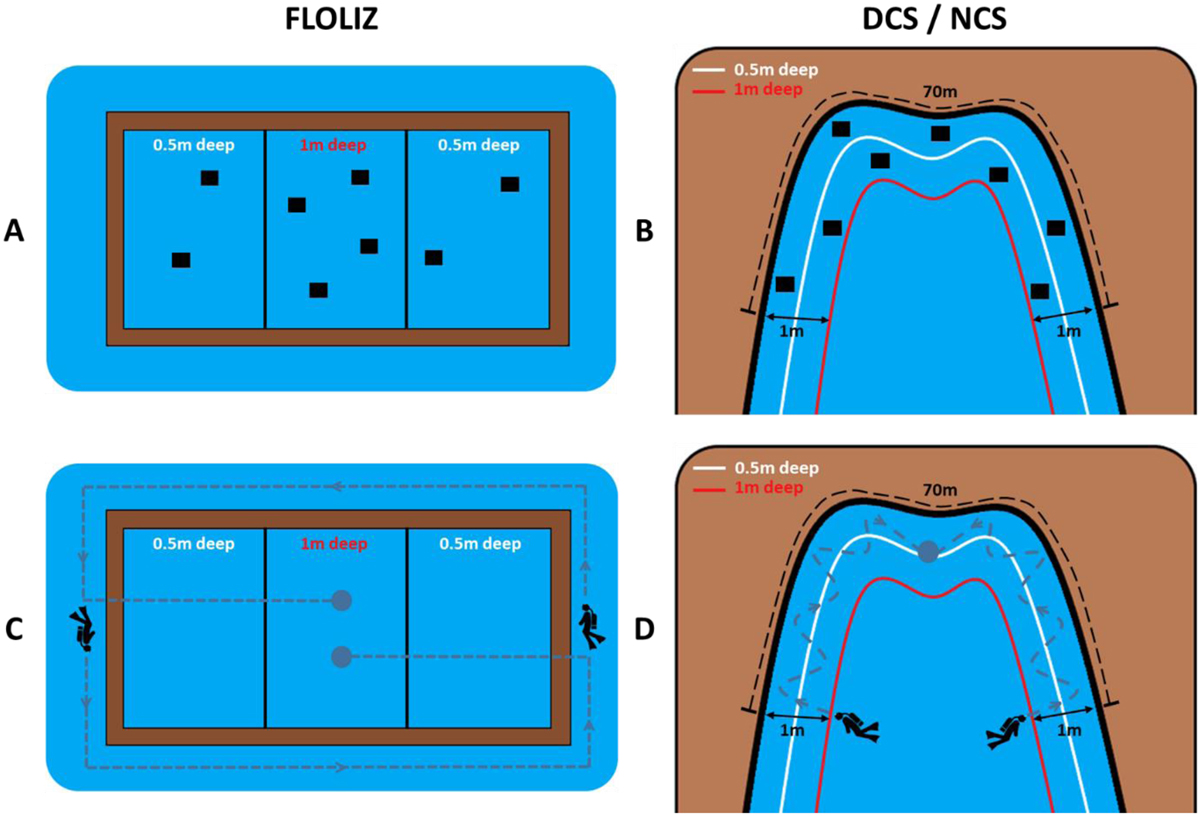
Schematic drawing of the sampling protocols in FLOLIZ and control stations. (A) Fish trap sampling (during night) in FLOLIZ. Black squares symbolize fish traps; (B) Fish trap sampling in NCS and DCS. The white line marks the 0.5 m-deep littoral zone, the red one corresponds to the 1 m-deep one; (C) Visual census (daytime) in FLOLIZ. The dashed grey line with arrow symbolizes the swimming track of each diver; (D) Visual census (daytime) in NCS and DCS.
Current usage metrics show cumulative count of Article Views (full-text article views including HTML views, PDF and ePub downloads, according to the available data) and Abstracts Views on Vision4Press platform.
Data correspond to usage on the plateform after 2015. The current usage metrics is available 48-96 hours after online publication and is updated daily on week days.
Initial download of the metrics may take a while.