Fig. 6

Download original image
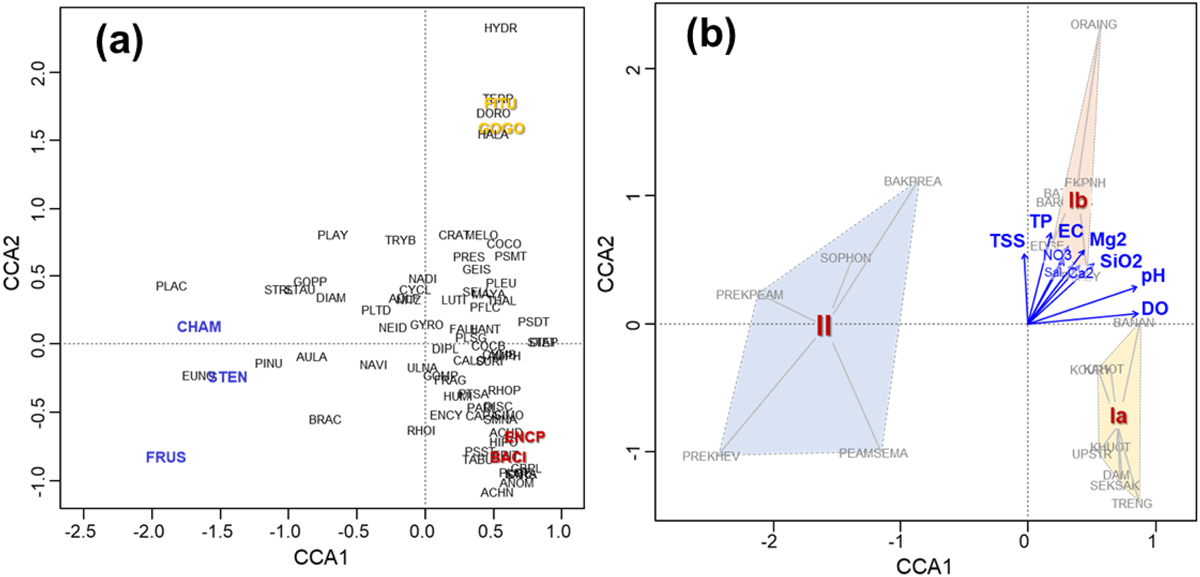
Canonical correspondence analysis (CCA) relating the benthic diatom community (a) to the physicochemical variables (b). Different colors of text on the left plot indicate the indicator genera in each diatom assemblage (yellow text denotes indicator genera from cluster Ia and red and blue from clusters Ib and II, respectively), while the grey texts on the right plot shows the monitoring sites. The blue arrows represent the vectors of physiochemical variables; only significant variables are depicted (Monte Carlo permutation tests with 999 permutations, p-value < 0.05). A detailed description of the benthic diatom genera and Monte Carlo permutation tests are given in Tabs. S1 and S2.
Current usage metrics show cumulative count of Article Views (full-text article views including HTML views, PDF and ePub downloads, according to the available data) and Abstracts Views on Vision4Press platform.
Data correspond to usage on the plateform after 2015. The current usage metrics is available 48-96 hours after online publication and is updated daily on week days.
Initial download of the metrics may take a while.


