Fig. 2
Download original image
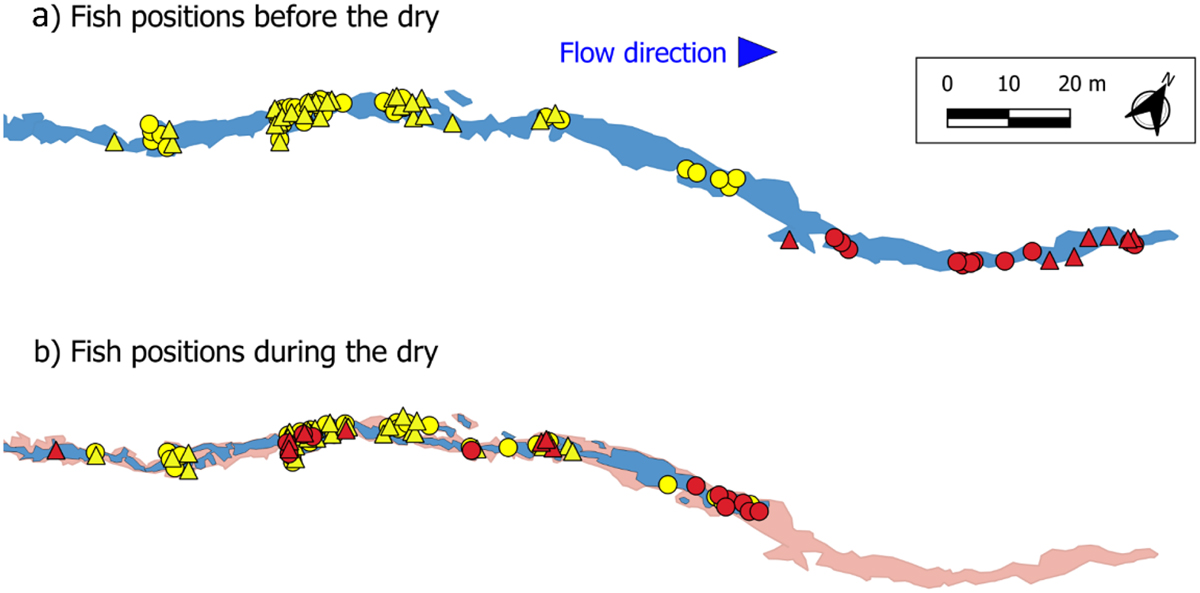
The map shows T. muticellus net travelled distance positions before (a) and during (b) river dry conditions in 2022 (triangles) and 2023 (circles). Red markers represent the intermittent groups (n = 21), while yellow markers represent the perennial groups (n = 64). Blue indicates riverbed areas with flow, while light red represents the dried area during the dry periods; the contouring is based on habitat mapping performed in March (a) and July (b) 2022. Note that one fish from the perennial group moved 200 m upstream during the drying process and is not shown on panel b.
Current usage metrics show cumulative count of Article Views (full-text article views including HTML views, PDF and ePub downloads, according to the available data) and Abstracts Views on Vision4Press platform.
Data correspond to usage on the plateform after 2015. The current usage metrics is available 48-96 hours after online publication and is updated daily on week days.
Initial download of the metrics may take a while.