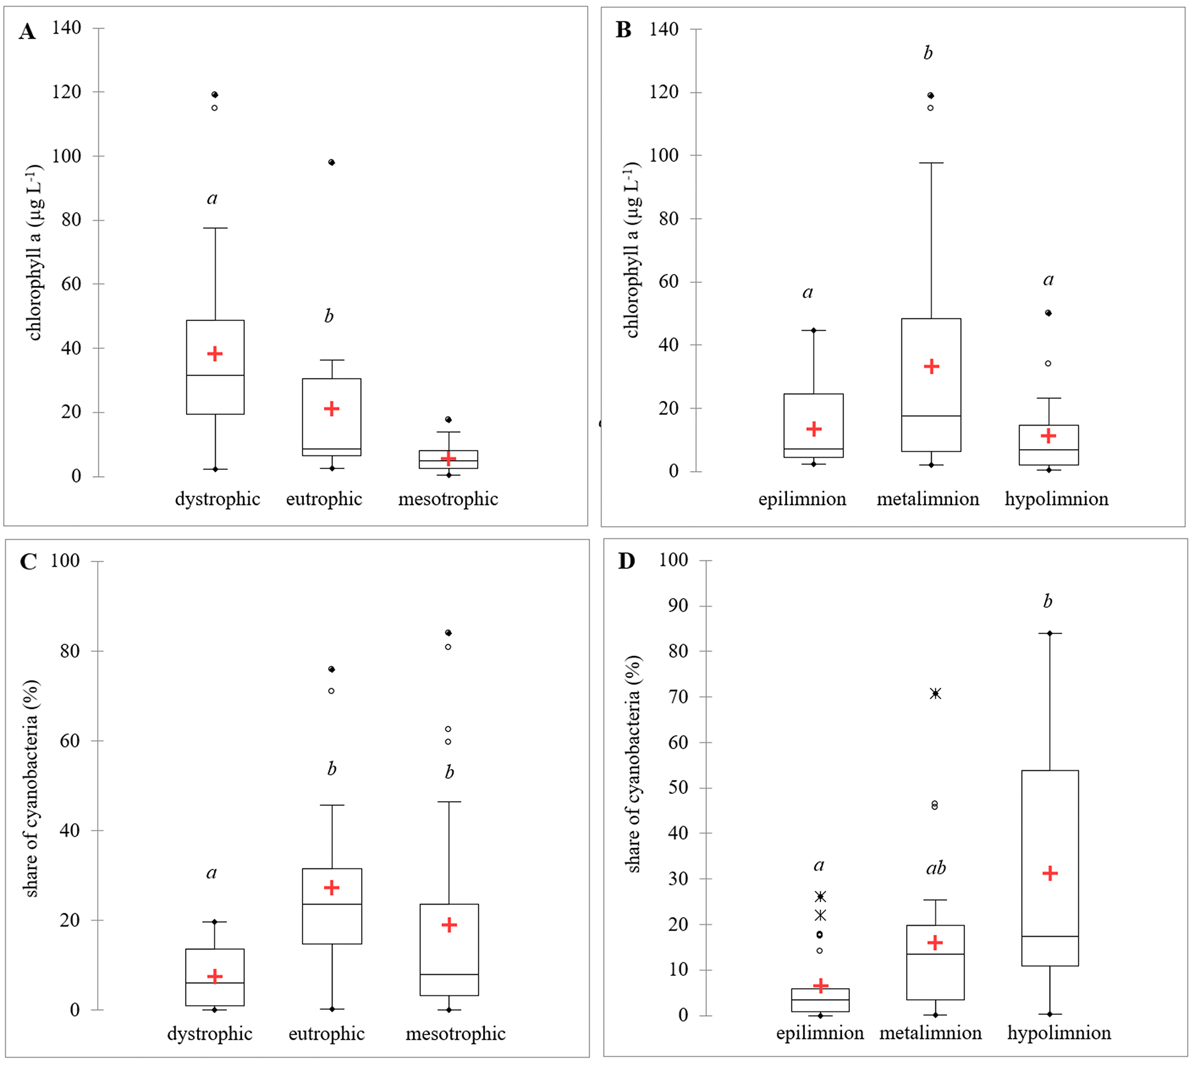
Fig. 2

Download original image
Average chlorophyll a concentrations in lakes with different trophic status (a) and average chl a in water layers (b). Percentage share of cyanobacteria in lakes with different trophic statuses (c) and in water layers (d). The different italics letters (a, b, c) above the box plots indicates significantly different values at p < 0.05, while the same letters indicate no significant differences. The lower and upper limits of the boxes are the first and third quartiles. The red crosses represent the means and the central horizontal bars are the medians. Points above or below are outliers and the whiskers represent minimum and maximum values.
Current usage metrics show cumulative count of Article Views (full-text article views including HTML views, PDF and ePub downloads, according to the available data) and Abstracts Views on Vision4Press platform.
Data correspond to usage on the plateform after 2015. The current usage metrics is available 48-96 hours after online publication and is updated daily on week days.
Initial download of the metrics may take a while.


