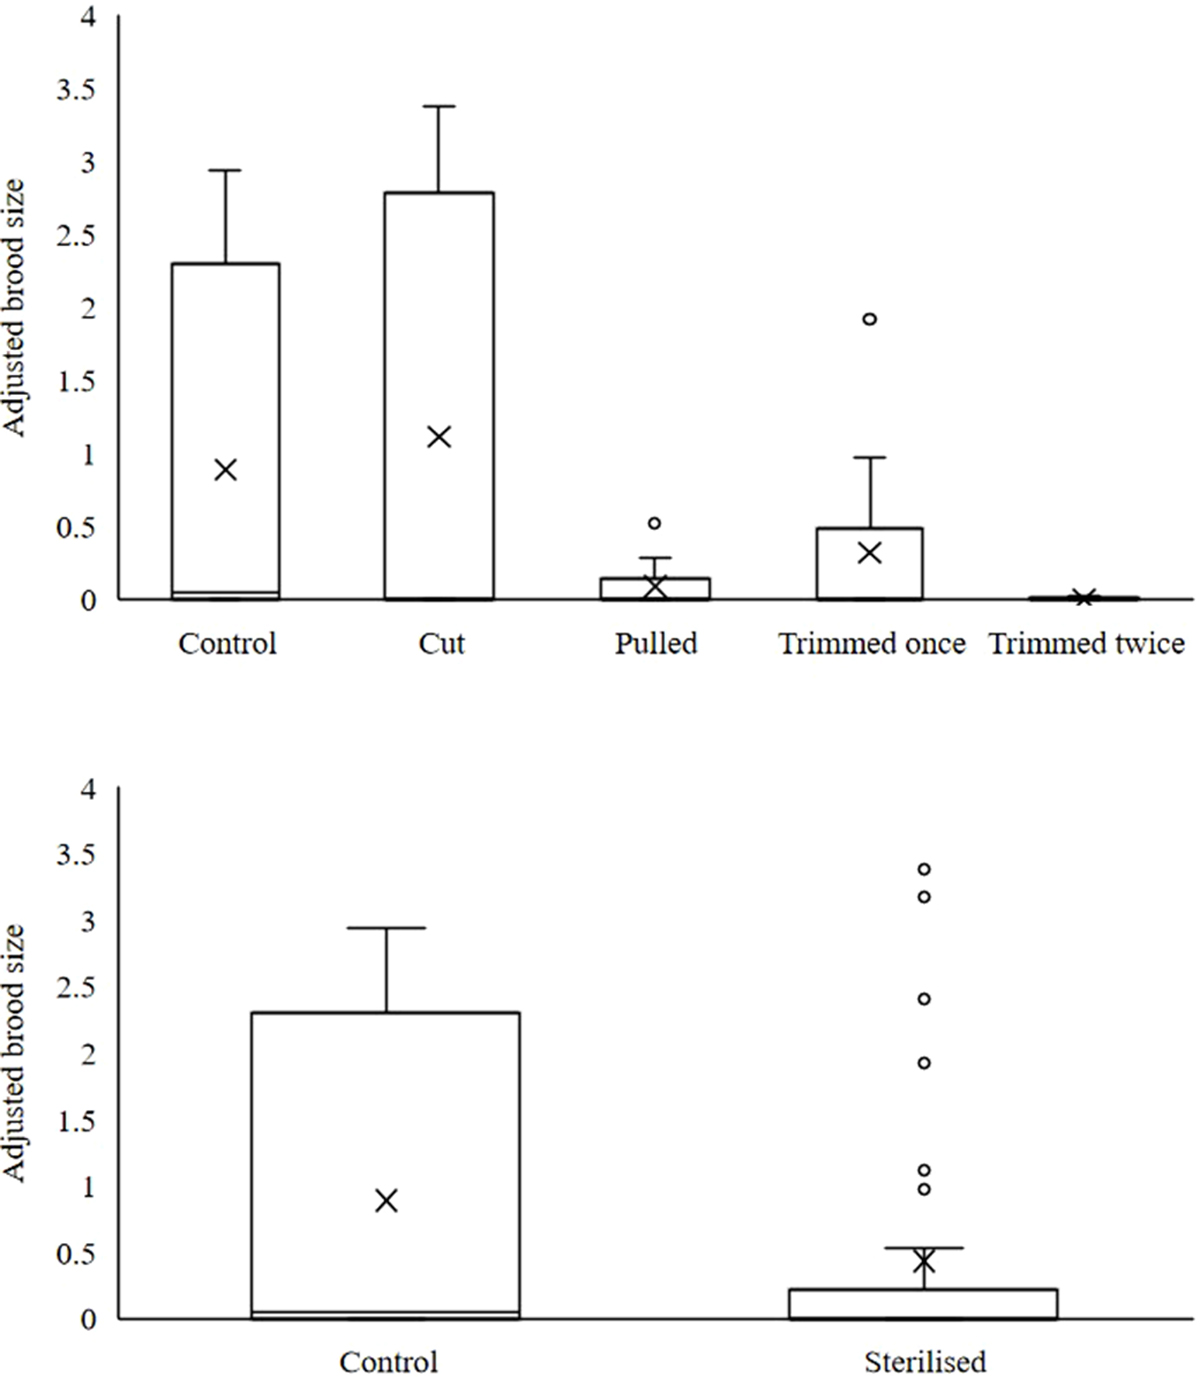
Fig. 3
Download original image
Mean brood size (adjusted for the effect of carapace length) according to the experimental treatments (top) and as sterilised versus non-sterilised (bottom). Each plot communicates the median (solid line), interquartile range (boxes), 10th and 90th percentiles (error bars), mean (x) and outlier values (circles)
Current usage metrics show cumulative count of Article Views (full-text article views including HTML views, PDF and ePub downloads, according to the available data) and Abstracts Views on Vision4Press platform.
Data correspond to usage on the plateform after 2015. The current usage metrics is available 48-96 hours after online publication and is updated daily on week days.
Initial download of the metrics may take a while.