Fig. 1
Download original image
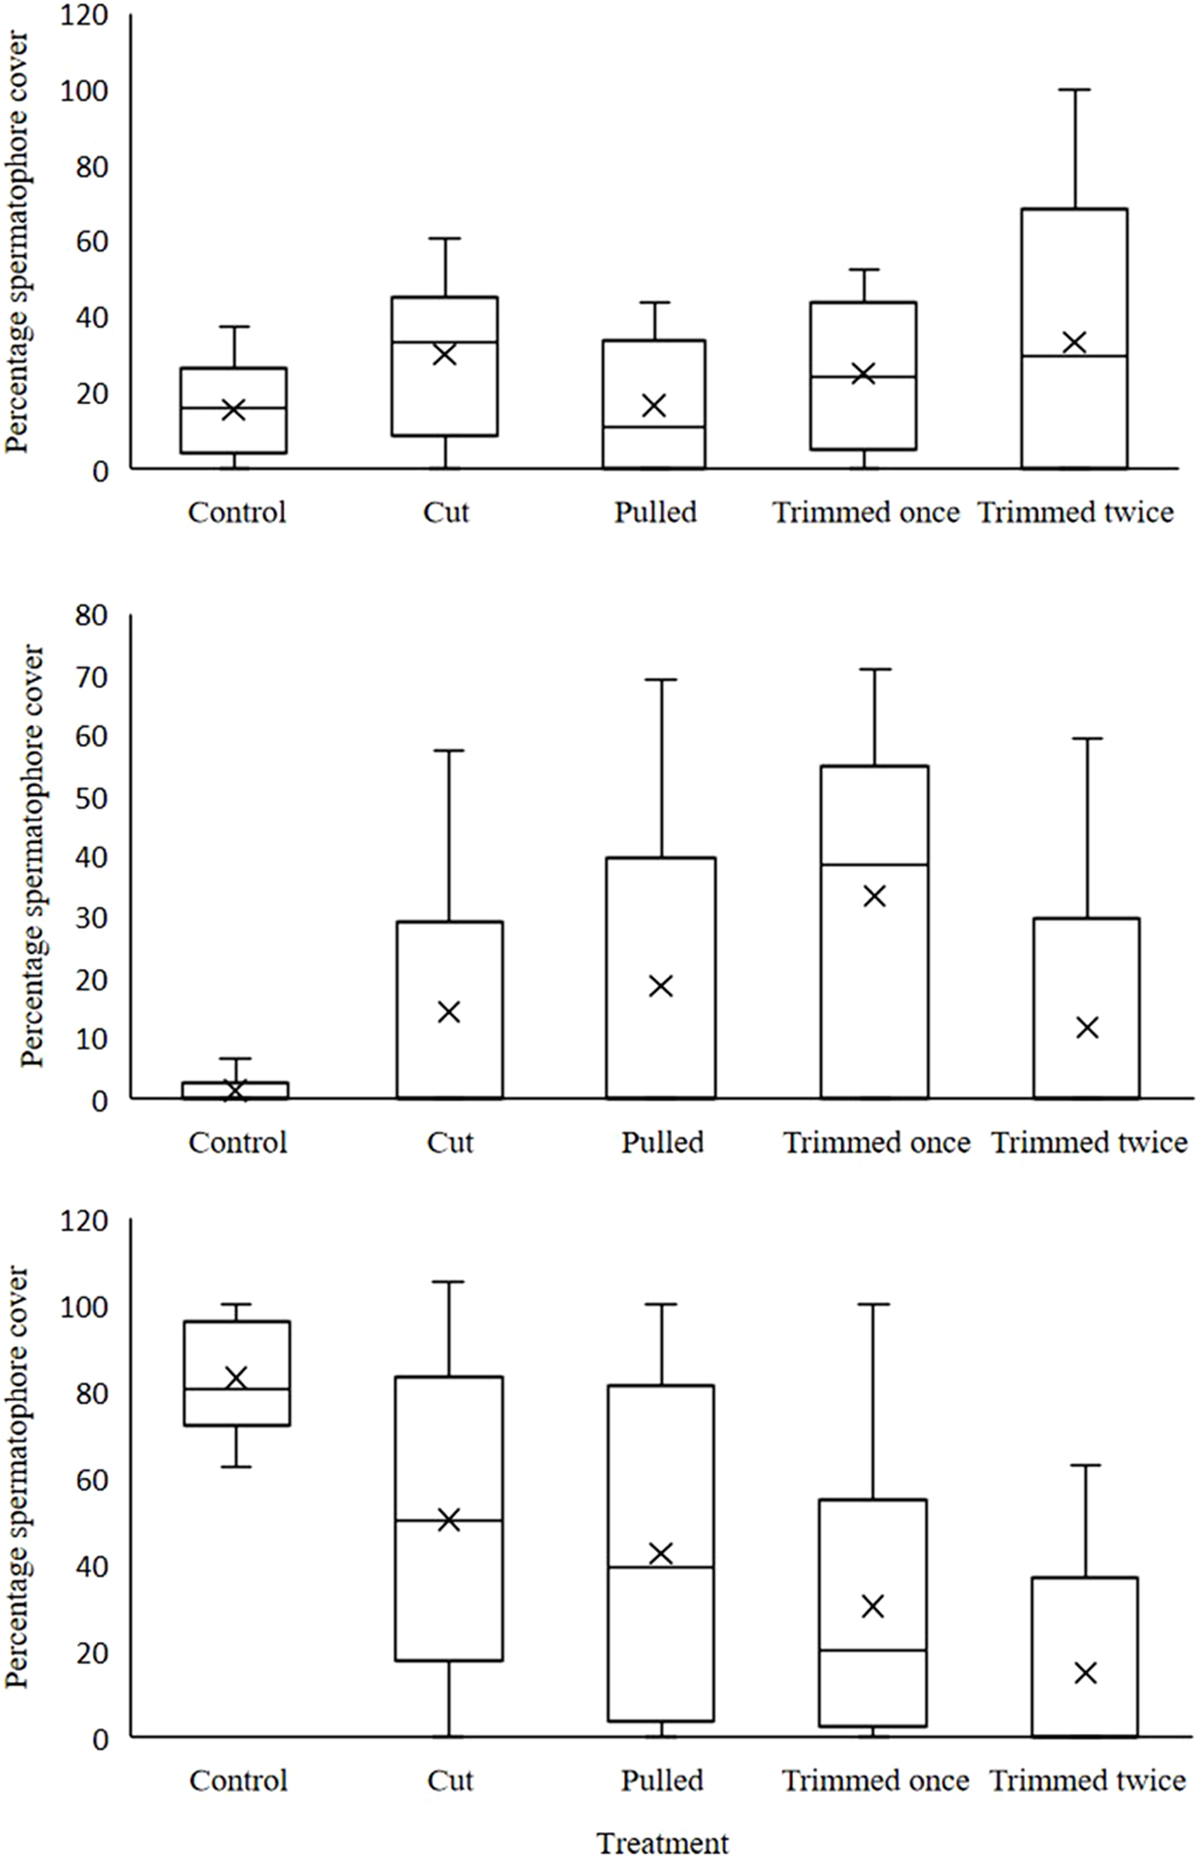
Boxplots revealing percentage spermatophore distribution between treatments for the outer (top), abdomen (middle) and middle (bottom) sections. Horizontal lines mark the 10th, 25th, 50th, 75th and 90th percentiles of the data whilst x is the mean percentage. spermatophore cover.
Current usage metrics show cumulative count of Article Views (full-text article views including HTML views, PDF and ePub downloads, according to the available data) and Abstracts Views on Vision4Press platform.
Data correspond to usage on the plateform after 2015. The current usage metrics is available 48-96 hours after online publication and is updated daily on week days.
Initial download of the metrics may take a while.