Fig. 5

Download original image
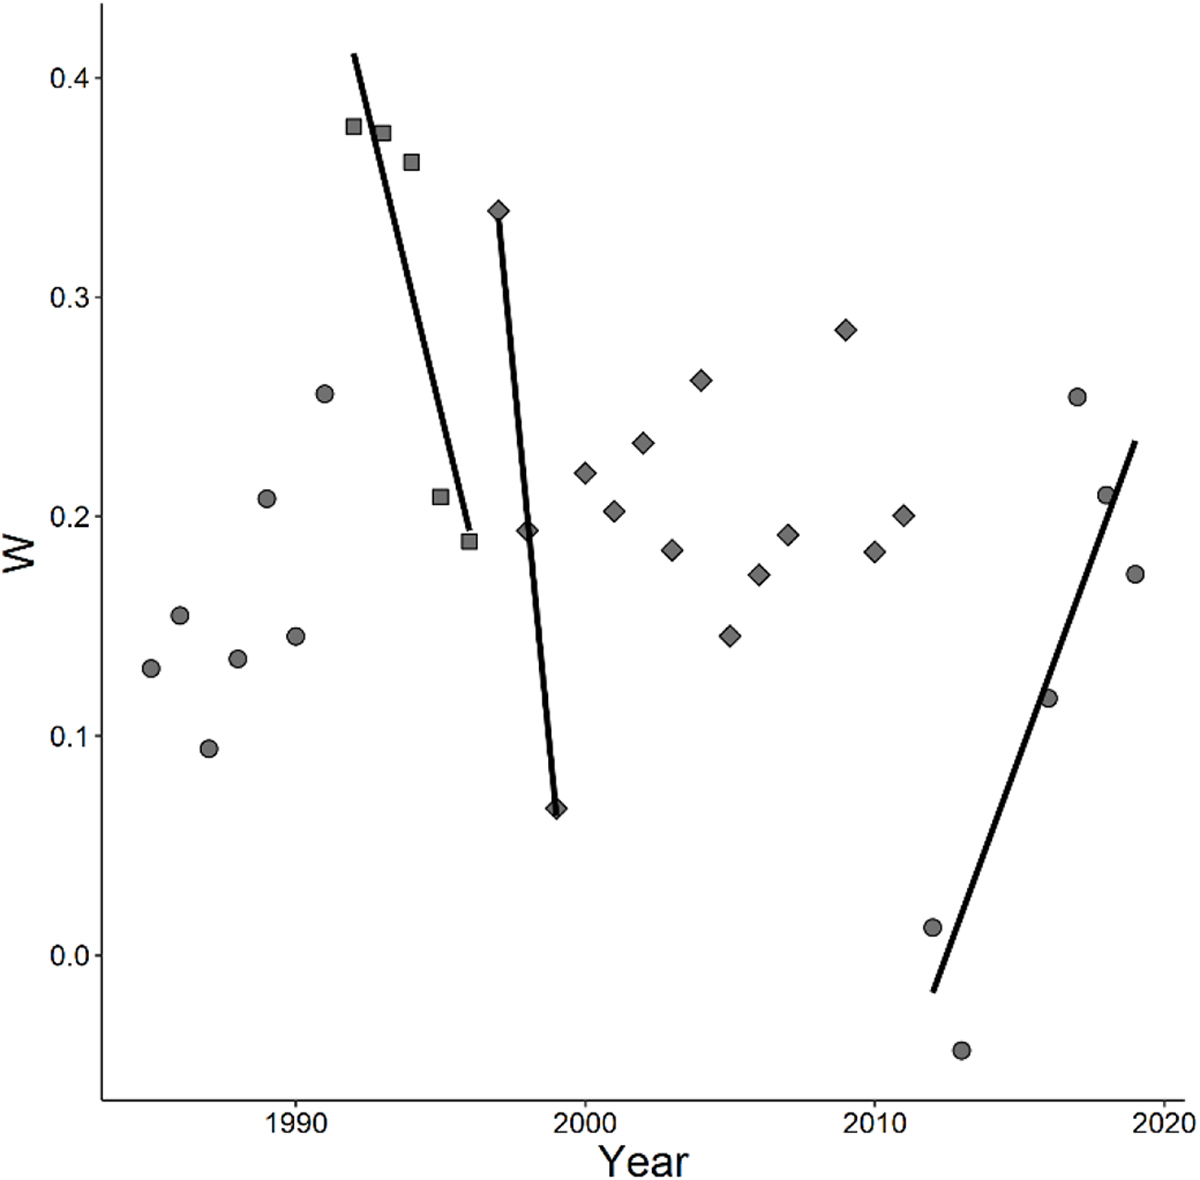
Changes in yearly means of Warwick's W statistic (ABC curves) over 35 years in the Chicago Area Waterway System. Positive values are considered indicative of un-disturbed environments (i.e., fewer larger individuals) whereas negative values indicate more disturbance (i.e., highly abundant small individuals), values near zero are non-conclusive. Lines represent significant piecewise regressions (minimum of 3-yr spans; α = 0.05). Different shapes represent groups with significantly different (A = circles vs. B = squares) or shared (AB = diamonds) means (α = 0.05).
Current usage metrics show cumulative count of Article Views (full-text article views including HTML views, PDF and ePub downloads, according to the available data) and Abstracts Views on Vision4Press platform.
Data correspond to usage on the plateform after 2015. The current usage metrics is available 48-96 hours after online publication and is updated daily on week days.
Initial download of the metrics may take a while.


